The first production release 1.0.0 of the Oracle Database Operator for Kubernetes appeared at the beginning of July 2023 in the context of numerous innovations to Oracle Database 23c. This offers many enhancements for the comprehensive operation of an Oracle Database under common Kubernetes distributions. I will try to describe what the OraOperator 1.0 has to offer for “Single Instance Databases” and how easy it is to set up a new database. Including separately available container-native monitoring support through prometheus and grafana.
OraOperator manages database containers and database-related
containers under kubernetes – comprehensive and kubernetes-native
As already described in an earlier blog article (Oracle Database – fit for Kubernetes), the container called OraOperator manages various database configurations such as Autonomous Database, Sharded Database, Database Cloud Service, Container Database and Pluggable Database under Kubernetes. It can integrate Oracle databases outside its Kubernetes cluster as native Kubernetes resources. However, it can also manage Oracle Databases within the cluster much more comprehensively. Database-related containers such as Oracle REST Data Services (ORDS) and a brand new Data Guard configuration are implicitly and explicitly supported.
Over time, additional features have been added to the management of the Oracle Database in the local Kubernetes cluster, so that one can speak of a comprehensive automated operation of database containers. Some of these features are buried quite deep in the documentation, so I would like to list and describe them first. Mind you, only in relation to the management of the Oracle Database in the local Kubernetes cluster, called “SingleInstanceDatabase” in the nomenclature of the OraOperator:
Lifecycle Management
Create a new Oracle Database (CDB + 1 PDB) “from scratch”, create a prepared database or create it by cloning one of the two previous variants. When creating the database, you can select the version and edition of the database, e.g. Express Edition, 23c Free, Standard Edition 2 and Enterprise Edition. A “prepared database” is a container image with data files contained in it, which are copied to a persistent volume when the container is set up. All three variants are well suited for integration into agile development processes in which database containers are to be set up alongside application containers, e.g. for separate testing and development.
Delete Oracle Database – by deleting the Kubernetes resource, co-managed containers are also deleted. Depending on the selected strategy for reclaimed persistent volumes (“reclaimPolicy”), these can also be deleted or emptied – or even retained.
Create/clone/delete pluggable database – if an Oracle Database (Container Database, CDB) has been created locally or integrated remotely, further pluggable databases can be created, cloned or deleted.
Oracle Database patching – once a new container image with a newer version of the Oracle Database software has been created, e.g. by importing a current release update into an existing container image, the new image only needs to be entered by name in the database resource (managed by the OraOperator). The OraOperator starts the database container with the new software version and the associated data files are also updated when the new container is started.
(High-)Availability
A Real Application Cluster (RAC) database is not currently supported by OraOperator, although RAC is certified as a Docker/Podman configuration by Oracle Support.
OraOperator configurations for high availability: container replica
with alternating responsibility or mirroring and failover with Data Guard
An automated cold failover configuration is possible by definition: The OraOperator can start several containers of an Oracle Database (actually: replica of a Kubernetes pod), whereby only one of the pods has actually connected and opened the data files. The remaining started containers wait for a signal from the Kubernetes cluster, which is sent if this pod fails or is deleted. The surviving pod signaled by Kubernetes binds the data files to itself and opens the database. This behavior can, for example, reduce the downtime when patching the database or help in the event of an unplanned outage so that the database is available again more quickly.
A Data Guard configuration has been available as preview functionality since version 1.0 of the OraOperator. The OraOperator now manages a Data Guard Broker configuration with the name of the source and target database and the choice of Data Guard Protection Mode (“MaxAvailability” or “MaxPerformance”) and creates a mirror database as a separate Kubernetes resource from a locally managed database. This is synchronized using Data Guard and activated if necessary.
Each managed database is accessible within the Kubernetes cluster via standard ports (1521 for database, 5500 for Enterprise Manager) or user-definable ports. A service of type ClusterIP generated by the OraOperator is responsible for internal access.
Each managed database is accessible outside the Kubernetes cluster via standard ports (1521 for database, 5500 for Enterprise Manager) or user-definable ports. Another service created by the OraOperator is responsible for access from outside. This service is either of the NodePort type or, provided the Kubernetes cluster is equipped with the metalLB module or runs in a cloud environment, of the LoadBalancer type.
Each managed database can be given optional access via SSL. The pre-installed cert-manager component generates and manages (i.e. renews on expiry) SSL certificates for the database listeners, the OraOperator uses these certificates and assigns them to an Oracle wallet in the respective database container. By default, these are certificates of a Self-Signed Certificate Authority, whose certificate in turn belongs to the OraOperator. It would be conceivable to replace this self-signed (root) certificate with an official certificate. In most cases, however, encryption is sufficient if this root certificate is available in the Oracle Wallet.
The OraOperator manages containers of the type OracleRestDataServices (ORDS) with an equally encrypted network connection from inside and outside. It is only necessary to specify how many containers are to be started and which database they should belong to. The required certificates, users and passwords can be taken from the same Kubernetes Secrets as those for creating and managing the databases themselves. This means that Application Express (APEX), REST enabled schemas and Database Actions (formerly SQL*Developer Web) are available for the connected database and can also be updated by simply swapping the container version number.
If you want to manage individual pluggable databases using the OraOperator, you must first establish a connection to a container database (CDB). This is done by automatically creating and managing a specially configured ORDS container that has activated and configured the REST Management API for managing the linked database.
Monitoring
The Oracle Enterprise Manager (OEM) Express is included by default in every database container managed by the OraOperator and is started in the container.
When adding an OracleRestDataSource (ORDS) resource to an operator-managed database, the integrated tool “database actions” also has quite profound monitoring capabilites.
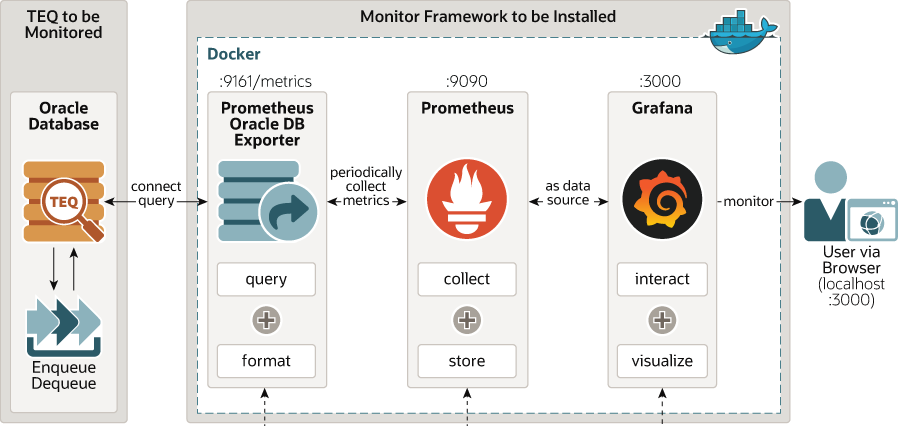
Oracle Database (und Transactional Event Queues) Metric Exporter –
für Docker, aber auch für Kubernetes
A separately available container that is not managed by the OraOperator can be set up to retrieve runtime metrics from a database linked to it. They are read into a Prometheus database at short, regular intervals to be analyzed by tools such as Grafana. Pre-built Oracle database dashboards for Grafana display metrics such as memory, CPU, SGA sizes, top wait classes, top sessions, network traffic and much more. Separate dashboards and metrics for monitoring transactional event queues are also available. This means that metrics from all managed databases can be displayed in central, configurable dashboards.
Further monitoring options exist with Kubernetes tools: additional Grafana dashboards show metrics at container level such as volume sizes, I/O, network traffic, CPU and memory utilization per container and much more. More detailed monitoring of network traffic, e.g. between individual containers and to the outside, is largely possible with the network tools istio and kiali: There are slight limitations with the Net8 protocol of the database, which should not be automatically encrypted by istio (via mTLS), otherwise clients will no longer be able to connect to the database. On the other hand, explicit Net8 TLS encryption can be set up very easily with the OraOperator.
Example setup: Oracle Database, APEX and Grafana Monitoring
1. Install OraOperator in Kubernetes
The OraOperator software can be installed in an existing Kubernetes cluster with two short commands. The “cert-manager” component should first be installed to manage SSL certificates for the internal communication of the OraOperator.
After installation, a new namespace oracle-database-operator-system should be created in the Kubernetes cluster, containing several containers or pods of the same software deployment oracle-database-operator-controller-manager. This can be checked as follows:
$ kubectl get pods -n oracle-database-operator-system
NAME                                                          READY   STATUS    RESTARTS      AGE
oracle-database-operator-controller-manager-775bb46fd-6smq7   1/1     Running   5 (24h ago)   33d
oracle-database-operator-controller-manager-775bb46fd-mkhxw   1/1     Running   6 (24h ago)   33d
oracle-database-operator-controller-manager-775bb46fd-wjxdn   1/1     Running   4 (24h ago)   33d
2. Create Oracle Database
There are numerous examples for dealing with SingleInstanceDatabase resources on github.com. Let’s take a look at the simplest possible case here: Creating a new Oracle Database with specification of a ready-made container image on container-registry.oracle.com. First, please create a new Kubernetes namespace for testing:
> kubectl create namespace oracledb
Then create a Kubernetes “Secret” in which the desired admin password of your future database is stored. Here in the example “db-admin-secret.yaml” a plain text password is specified. Alternatively, a base64-encoding of the value would be possible (the field stringData would have to be renamed to data, then a base64 value may be entered).
apiVersion: v1
kind: Secret
metadata:
  name: db-admin-secret
type: Opaque
stringData:
  ## Specify your DB password here
  oracle_pwd: "MyComplexPwd123##"
Create the secret in Kubernetes with the following command (in the namespace you just created):
kubectl apply -f db-admin-secret.yaml -n oracledb
Now we need a Kubernetes secret in which your login data for the container to be downloaded from the OraOperator with Oracle software in it is entered at container-registry.oracle.com. This is possible, for example, with the following command (the name of the secret is oracle-container-registry-secret):
Please also log in to container-registry.oracle.com with your browser, click on the “database” section and accept the license terms.
Once this is done, we can now create a new database. The following example file oracle21c.yaml contains information on the database size, the image to be used and admin passwords with the secrets just created:
apiVersion: database.oracle.com/v1alpha1
kind: SingleInstanceDatabase
metadata:
  name: db21c
spec:
  ## Use only alphanumeric characters for sid
  sid: ORCL1

  ## DB edition.
  edition: enterprise

  ## Secret containing SIDB password mapped to secretKey
  adminPassword:
    secretName: db-admin-secret

  ## DB character set
  charset: AL32UTF8

  ## PDB name
  pdbName: orclpdb1

  ## Enable/Disable ArchiveLog. Should be true to allow DB cloning
  archiveLog: true

  ## Database image details
  image:
    pullFrom: container-registry.oracle.com/database/enterprise:latest
    pullSecrets: oracle-container-registry-secret

  ## size is the required minimum size of the persistent volume
  ## storageClass is specified for automatic volume provisioning
  ## accessMode can only accept one of ReadWriteOnce, ReadWriteMany
  persistence:
    size: 100Gi
    ## oci-bv applies to OCI block volumes. Use "standard" storageClass for dynamic provisioning in Minikube. Update as appropriate for other cloud service providers
    storageClass: "oci-bv"
    accessMode: "ReadWriteOnce"

  ## Count of Database Pods.
  replicas: 1
A special feature is that the data files of the new database are created in a persistent volume that has yet to be assigned by Kubernetes. If your Kubernetes environment runs in the Oracle Cloud, a storage class called “oci-bv” is already pre-installed, which creates your required volumes freshly on request. Under Azure/AKS, a storage class called “managed-csi” or “azurefile-csi” would probably be conceivable, under AWS/EKS probably most frequently “gp2”. Another way would be to create a “dummy” storage class that does not create any new volumes and assign it a few manually created persistent volumes (e.g. via NFS) of sufficient size.
Now create the new Kubernetes resource via kubectl so that the OraOperator can do its work to create the new database:
kubectl apply -f oracle21c.yaml -n oracledb
The resource is created quickly, but downloading the container and starting the installation process takes a few minutes. You can monitor the progress by observing the status of the resource and checking the log data of the container from time to time:
> kubectl get pods -n oracledb
NAME                                    READY   STATUS    RESTARTS   AGE
db21c-h2kpr                             1/1     Running   0          10m

> kubectl logs db21c-h2kpr -n oracledb --since=0

[2023:06:21 12:29:41]: Acquiring lock .ORCL1.create_lck with heartbeat 30 secs
[2023:06:21 12:29:41]: Lock acquired
[2023:06:21 12:29:41]: Starting heartbeat
[2023:06:21 12:29:41]: Lock held .ORCL1.create_lck
ORACLE EDITION: ENTERPRISE

LSNRCTL for Linux: Version 21.0.0.0.0 - Production on 21-JUN-2023 12:29:41

Copyright (c) 1991, 2021, Oracle.  All rights reserved.

Starting /opt/oracle/product/21c/dbhome_1/bin/tnslsnr: please wait...

TNSLSNR for Linux: Version 21.0.0.0.0 - Production
System parameter file is /opt/oracle/homes/OraDB21Home1/network/admin/listener.ora
Log messages written to /opt/oracle/diag/tnslsnr/chronin-db-h2kpr/listener/alert/log.xml
Listening on: (DESCRIPTION=(ADDRESS=(PROTOCOL=ipc)(KEY=EXTPROC1)))
Listening on: (DESCRIPTION=(ADDRESS=(PROTOCOL=tcp)(HOST=0.0.0.0)(PORT=1521)))

Connecting to (DESCRIPTION=(ADDRESS=(PROTOCOL=IPC)(KEY=EXTPROC1)))
STATUS of the LISTENER
------------------------
Alias                     LISTENER
Version                   TNSLSNR for Linux: Version 21.0.0.0.0 - Production
Start Date                21-JUN-2023 12:29:42
Uptime                    0 days 0 hr. 0 min. 0 sec
Trace Level               off
Security                  ON: Local OS Authentication
SNMP                      OFF
Listener Parameter File   /opt/oracle/homes/OraDB21Home1/network/admin/listener.ora
Listener Log File         /opt/oracle/diag/tnslsnr/chronin-db-h2kpr/listener/alert/log.xml
Listening Endpoints Summary...
  (DESCRIPTION=(ADDRESS=(PROTOCOL=ipc)(KEY=EXTPROC1)))
  (DESCRIPTION=(ADDRESS=(PROTOCOL=tcp)(HOST=0.0.0.0)(PORT=1521)))
The listener supports no services
The command completed successfully
Prepare for db operation
8% complete
Copying database files
31% complete
Creating and starting Oracle instance
32% complete
36% complete
Once the installation is complete, the associated Kubernetes resource also shows a “Healthy” status in addition to version numbers and connect strings:
> kubectl get singleinstancedatabase -n oracledb
NAME    EDITION      STATUS    VERSION      CONNECT STR              TCPS CONNECT STR   OEM EXPRESS URL
db21c   Enterprise   Healthy   21.3.0.0.0   10.0.10.77:32113/ORCL1   Unavailable        https://10.0.10.77:31895/em
In case of difficulties, the Kubernetes events or the logs of the OraOperator pods (in the namespace oracle-database-operator-system) can be helpful. Perhaps the container image cannot be downloaded, or the new container is waiting indefinitely and in vain for persistent volumes of the requested type, access type (ReadWriteOnce ?) or size…
If the new resource is now Healthy, network resources have also been created by the OraOperator to access it from inside and outside the Kubernetes cluster:
> kubectl get services -n coracledb
NAME                      TYPE        CLUSTER-IP      EXTERNAL-IP   PORT(S)                         AGE
db21c-db                  ClusterIP   10.96.32.21     <none>        1521/TCP                        21d
db21c-db-ext              NodePort    10.96.84.181    <none>        5500:31895/TCP,1521:32113/TCP   21d
However, the standard type “NodePort” for the database service is often not very useful, as you have to directly address the address of the worker node on which the database container is running. If possible, it would be better to switch to a service of the type “LoadBalancer” (or to specify the correct type in advance). Kubernetes assigns the service a separate, new and externally accessible IP address. However, this only works if a load balancer implementation has been installed, such as metalLB, or with a connected LBaaS (load balancer as a service) from a cloud provider:
Often, direct database access from outside the Kubernetes cluster is not desired at all. A container such as ORDS or Application Express could access the database internally and in turn open the gates for external access via HTTP(S). And this is exactly what is being done now – let’s set up an ORDS container with APEX.
3. Connecting an ORDS or Application Express Container with the Oracle Database
To create a container for REST Data Services and / or Application Express, we first need two more Kubernetes Secrets to create a new ORDS database user and a temporary password for the admin user for Application Express. This time we’ll make do with two command line calls instead of using a YAML file with entries.
The resource description “db21c-ords.yaml” now contains information on linking the new ORDS container to the SingleInstanceDatabase just created, i.e. its Kubernetes name and the secret with the database password. In addition, there is information on the container image with the Docker registry secret created in the previous step and the two new passwords for the ORDS database user (“ORDS_PUBLIC_USER”) and for Application Express:
apiVersion: database.oracle.com/v1alpha1
kind: OracleRestDataService
metadata:
  name: db21c-ords
spec:

  ## Database ref. This can be of kind SingleInstanceDatabase.
  ## Make sure the source database has been created by applying singeinstancedatabase_express.yaml
  databaseRef: "db21c"

  ## Secret containing databaseRef password
  adminPassword:
    secretName: db-admin-secret
    secretKey: oracle_pwd
    keepSecret: true

  ## Secret containing ORDS_PUBLIC_USER password
  ordsPassword:
    secretName: ords-secret
    secretKey: oracle_pwd
    keepSecret: true

  ## To configure APEX with ORDS, specfiy the apexPassword secret details. Leave empty if Apex is not needed.
  ## This is a secret containing a common password for APEX_PUBLIC_USER, APEX_REST_PUBLIC_USER, APEX_LISTENER and Apex administrator (username: ADMIN)
  apexPassword:
    secretName: apex-secret
    secretKey: oracle_pwd
    keepSecret: true

  loadBalancer: true

  ## ORDS image details
  image:
    pullFrom: container-registry.oracle.com/database/ords:21.4.2-gh
    pullSecrets: oracle-container-registry-secret

  ## PDB Schemas to be ORDS Enabled.
  ## Schema will be created (if not exists) with password as .spec.ordsPassword.
  restEnableSchemas:
  - schemaName: restme
    enable: true
    urlMapping: restme
Here you can choose in advance whether the network service created by the OraOperator should be of the “LoadBalancer” type or not. With “loadbalancer: false” a NodePort service would be created. The SSL certificate comes again from the OraOperator (actually from cert-manager) or its configured root certificate. Please note that ORDS or APEX always installs itself into the container database in this way, not into the “first available” pluggable database. Now create the new resource with the following command:
> kubectl apply -f db21c-ords.yaml -n oracledb
If everything is entered correctly, a new container and network service will be available to you after a few minutes. The new container sets up all ORDS or Application Express schemas in the database the first time it is called, which takes a little while. Errors and problems can be seen in the events of the “oracledb” namespace and in the log of the OraOperator container.
> kubectl get pods -n oracledb
NAME                                         READY   STATUS    RESTARTS   AGE
db21c-h2kpr                                  1/1     Running   0          22d
dbc21c-ords-umlrt                            1/1     Running   0          41m

> kubectl get services -n oracledb
NAME                   TYPE           CLUSTER-IP      EXTERNAL-IP       PORT(S)                         AGE
db21c                  ClusterIP      10.96.32.21     <none>            1521/TCP                        22d
db21c-db-ext           LoadBalancer   10.96.84.181    158.101.217.247   5500:31895/TCP,1521:32113/TCP   22d
db21c-ords             LoadBalancer   10.96.75.108    158.101.201.244   8443:32309/TCP                  44m

> kubectl get oraclerestdataservice -n oracledb
NAME         STATUS    DATABASE     DATABASE API URL
     DATABASE ACTIONS URL                              APEX URL
db21c-ords   Healthy   db21c   https://158.101.201.244:8443/ords/orclpdb1/_/db-api/stable/
     https://158.101.201.244:8443/ords/sql-developer   https://158.101.201.244:8443/ords/orclpdb1/apex
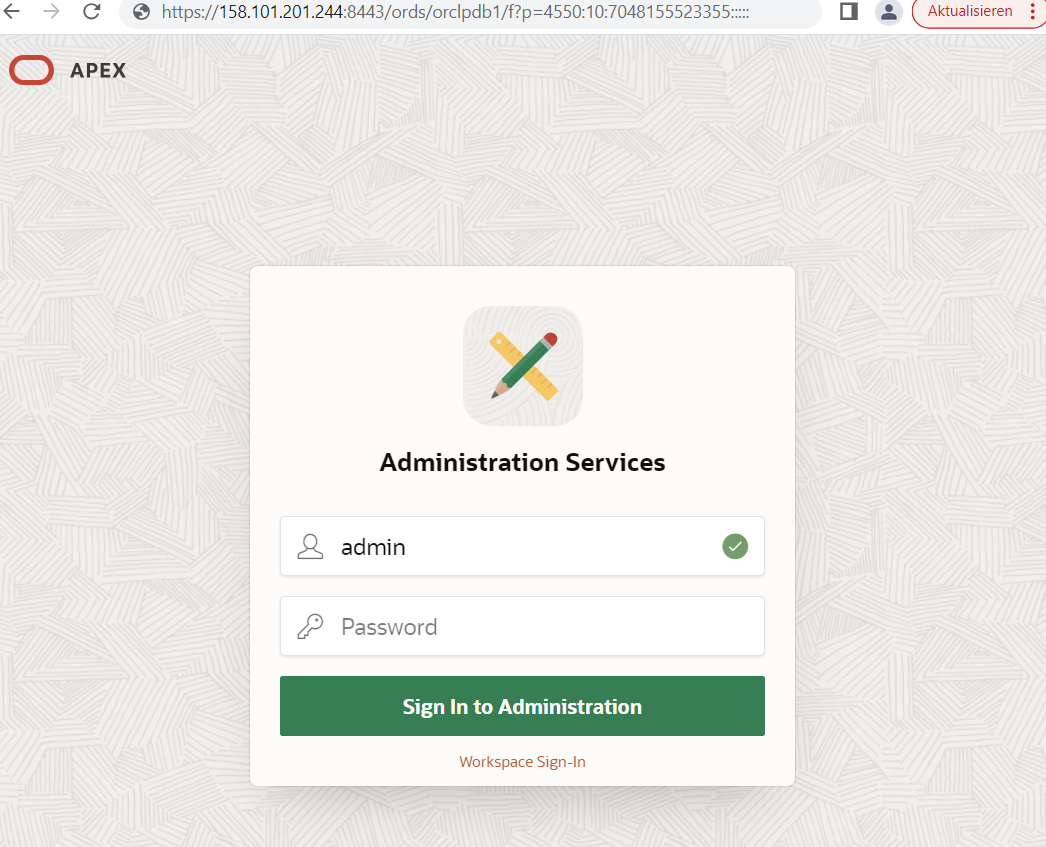
That’s it, you can now try to call up the APEX URL you just received once with your browser and change the admin password straight away. The ORDS REST API, Database Management API and Database Actions are also immediately available, but still need to be further configured within the database. For example with APEX, then you do not have to connect directly to the database.
Do not use the standard page “/ords/orclpdb1/apex” for the admin login,
but the administration page via the URI “/ords/orclpdb1/f?p=4550:10”
Congratulations! Database and development tools have been launched, now we are adding monitoring via Grafana Dashboards in addition to the classic Enterprise Manager “Database Express”.
4. Providing database metrics for prometheus and grafana
This fairly new project, which is still under development, has the official name “Unified Observability Exporter“. This project has been newly created in Java based on the Go implementation of a database metric exporter for Oracle (also available for MySQL and Postgres) by Seth Miller (https://github.com/iamseth/oracledb_exporter). Metrics can be freely defined there on the basis of SQL queries to system views of the database. There are prepared metrics in embeddable .toml files full of SQL queries and attribute mappings, e.g. for a general database overview such as SGA, Top Sessions, Top Wait Classes, but also metrics such as Trace Events, ASM Storage, Alert Logs, Advanced Queuing and Transactional Event Queues. The same applies to the Grafana monitoring tool: some prepared dashboards can be downloaded and integrated for a general overview, for the I/O behavior of the database and for Advanced Queuing or Transactional Event Queues.
In principle, only a container with an appropriately read-authorized database user needs to be connected to the database. This container executes the SQL queries listed in the .toml files whenever a Prometheus container (the metrics database below Grafana) executes its job known as “scraping”. The prepared container image of the “Unified Observability Exporter” is available for download at container-registry.oracle.com, as are the database images and ORDS/APEX images already in use. I do not want to explain the installation of Prometheus and Grafana here, but it is explained in the github project using the example of a docker-compose configuration without Kubernetes.
The github project consists of several code branches with older Go code, new Java code with instructions for the setup under Kubernetes and with new Java code, Grafana dashboards and instructions for the setup under docker-compose. I will therefore use several sub-pots in the project for the complete setup.
Let’s start by creating a Kubernetes secret that contains a database connect string for access to the database created above, more precisely to the container database / CDB. Instead of the “system” user, you could create a separate user, e.g. with “SELECT ANY DICTIONARY” rights, if that doesn’t seem too much, or SELECT rights on all “sys.gv$*” and “sys.dba_*” views requested in the .toml files. To address the databnk within the Kubernetes cluster, we may use the internal DNS service instead of specifying the current IP address of the container. The internal DNS name would be <name of the service>.<namespace>, in our example db21c.oracledb
Then please download one of the .toml files from the project and integrate it as a Kubernetes ConfigMap. This allows you to make changes at any time, which will take effect after restarting the container. Without having to build a new container. It is best to use the “default-metrics.toml” file from the main branch in the exporter subdirectory:
In the “java-impl-branch” branch of the github project, you will also find Kubernetes YAML files for installing the container as a deployment, a Kubernetes service for internal network access and a Kubernetes Resource called ServiceMonitor as Prometheus configuration. The files are located there in the examples subdirectory and would still need to be adapted to our requirements. You can save the following, already customized deployment configuration e.g. as metric-deployment.yaml and create it in your Kubernetes cluster with “kubectl apply -f metric-deployment.yaml -n oracledb“:
And, did the deployment work for you? The DEFAULT_METRICS environment variable defined in the deployment points to our .toml file included via ConfigMap. The variable DATA_SOURCE_NAME contains the user name, password and connect string from the previously created secret. The TNS_ADMIN variable is currently only a “dummy”, it could point to a secret with a contained Oracle wallet and tnsnames.ora file for encrypted access to an Oracle database. The container should run after a short time and show no errors in the log:
> kubectl get pod -n oracledb
NAME                                                   READY   STATUS    RESTARTS   AGE
db21c-h2kpr                                            1/1     Running   0          22d
db21c-ords-umlrt                                       1/1     Running   0          20h
unified-observability-exporter-db21c-bbc9d99b7-wqsc4   1/1     Running   0          28s

> kubectl logs unified-observability-exporter-db21c-bbc9d99b7-wqsc4  -n oracledb
  .   ____          _            __ _ _
 /\\ / ___'_ __ _ _(_)_ __  __ _ \ \ \ \
( ( )\___ | '_ | '_| | '_ \/ _` | \ \ \ \
 \\/  ___)| |_)| | | | | || (_| |  ) ) ) )
  '  |____| .__|_| |_|_| |_\__, | / / / /
 =========|_|==============|___/=/_/_/_/
 :: Spring Boot ::                (v2.7.0)

2023-07-14 11:21:14.173  INFO 1 --- [           main] o.o.ObservabilityExporterApplication     : Starting ObservabilityExporterApplication v0.1.0 using Java 11.0.15 on unified-observability-exporter-db21c-bbc9d99b7-wqsc4 with PID 1 (/usr/share/observability-exporter.jar started by root in /)
2023-07-14 11:21:14.177  INFO 1 --- [           main] o.o.ObservabilityExporterApplication     : No active profile set, falling back to 1 default profile: "default"
2023-07-14 11:21:15.758  INFO 1 --- [           main] o.s.b.w.embedded.tomcat.TomcatWebServer  : Tomcat initialized with port(s): 9161 (http)
2023-07-14 11:21:15.776  INFO 1 --- [           main] o.apache.catalina.core.StandardService   : Starting service [Tomcat]
2023-07-14 11:21:15.776  INFO 1 --- [           main] org.apache.catalina.core.StandardEngine  : Starting Servlet engine: [Apache Tomcat/9.0.63]
2023-07-14 11:21:15.909  INFO 1 --- [           main] o.a.c.c.C.[Tomcat].[localhost].[/]       : Initializing Spring embedded WebApplicationContext
2023-07-14 11:21:15.909  INFO 1 --- [           main] w.s.c.ServletWebServerApplicationContext : Root WebApplicationContext: initialization completed in 1636 ms
...
...
2023-07-14 11:21:19.226  INFO 1 --- [       Thread-4] oracle.observability.logs.LogsExporter   : No logs records configured
2023-07-14 11:21:19.230  INFO 1 --- [       Thread-3] o.observability.tracing.TracingExporter  : No trace records configured
2023-07-14 11:21:19.751  INFO 1 --- [           main] o.s.b.w.embedded.tomcat.TomcatWebServer  : Tomcat started on port(s): 9161 (http) with context path ''
2023-07-14 11:21:19.762  INFO 1 --- [           main] o.o.ObservabilityExporterApplication     : Started ObservabilityExporterApplication in 6.265 seconds (JVM running for 7.278)
A few SQL conversion errors or errors due to too large data types may currently occur, but this will certainly be fixed soon. Now create a Kubernetes service so that we can test whether metrics are created at all. Here you can also save the revised file “metric-service.yaml” and send it to your cluster with “kubectl apply -f metric-service.yaml -n oracledb”:
The service is only accessible internally within Kubernetes, i.e. to test it you can now start a “wget” call in another container and see whether appealing metrics are generated:
> kubectl run busybox --image=busybox --dry-run=client -o yaml --command -- /bin/sh -c "wget -O - http://unified-observability-exporter-service-db21c.oracledb:9161/metrics" | kubectl apply -f -
> kubectl logs busybox
...
...
oracledb_concurrency_background_wait_event_average_wait_bg{inst_id="1",con_id="0",event_name="PGA memory operation"} 0.0
oracledb_concurrency_background_wait_event_average_wait_bg{inst_id="1",con_id="0",event_name="Log archive I/O"} 0.0
oracledb_concurrency_background_wait_event_average_wait_bg{inst_id="1",con_id="0",event_name="latch: shared pool"} 2.0
# HELP oracledb_io_filetype_write_data_s Number of megabytes written via single block write requests
# TYPE oracledb_io_filetype_write_data_s gauge
oracledb_io_filetype_write_data_s{inst_id="1",con_id="1",filetype_name="Temp File"} 200.0
oracledb_io_filetype_write_data_s{inst_id="1",con_id="1",filetype_name="Log File"} 3229.0
oracledb_io_filetype_write_data_s{inst_id="1",con_id="1",filetype_name="Archive Log"} 0.0
oracledb_io_filetype_write_data_s{inst_id="1",con_id="1",filetype_name="Data File"} 6924.0
oracledb_io_filetype_write_data_s{inst_id="1",con_id="1",filetype_name="Control File"} 14642.0
...
...
> kubectl delete pod busybox
If you see many, many lines of text and most of them start with “oracledb_*”, then it looks very good. The metrics export works.
Now create a ServiceMonitor resource that tells an existing Prometheus installation how to get the metrics from the exporter. The customized file has the name “metric-monitor.yaml” You can copy the following content again and enter it into your cluster with “kubectl apply -f metric-monitor.yaml -n oracledb”:
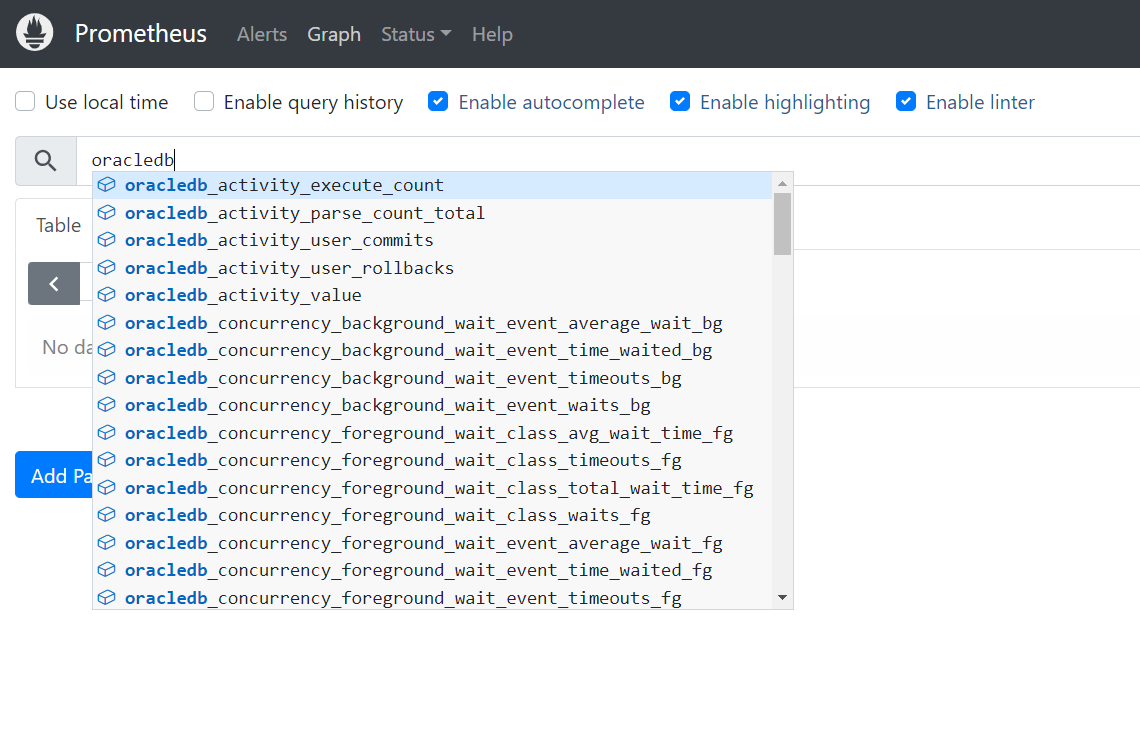
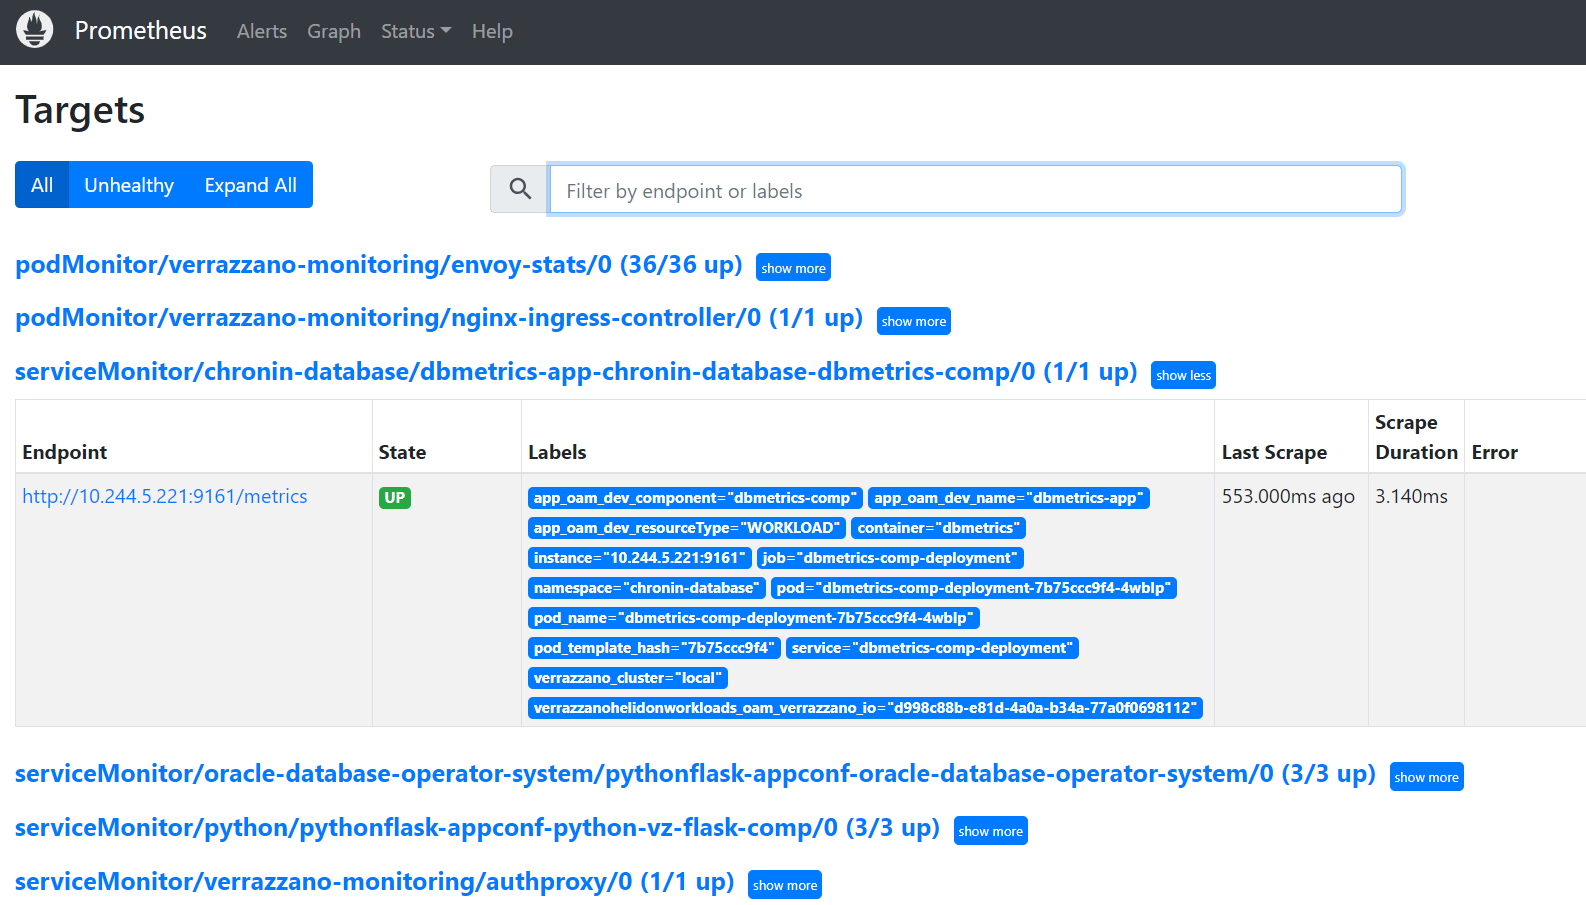
After about 20 seconds, you should be able to see in your Prometheus installation via the browser whether the metrics have arrived there. Click on “graph” and enter the initial text “oracledb”, as this is how all metrics generated by the “Unified Observability Exporter” begin:
If the list does not look as desired, it is possible that no metrics have been recorded yet. To be on the safe side, check whether the scraping configuration has been transferred to your environment as a so-called target via the ServiceMonitor. In my Verrazzano-based environment, this looks something like the following – I have chosen a different namespace and database name, but the principle is the same:
If not, there must be an authorization problem in your Prometheus installation. Please check the logs of your Prometheus container for corresponding error messages, perhaps you need to extend the Prometheus Pod’s ServiceAccount with rights to search for data in namespaces other than your own…
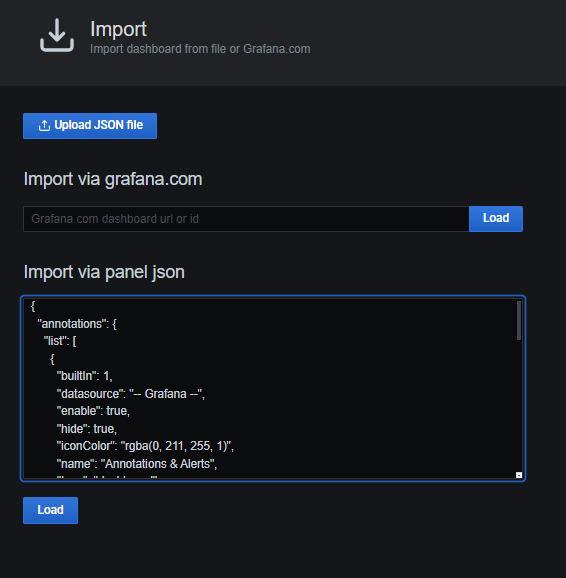
The last step now is to import the prepared dashboards into Grafana and have the collected values displayed in a meaningful way. It is best to download the dashboard.json file from the github-Projekt in the main branch from the “grafana/dashboards” subdirectory:
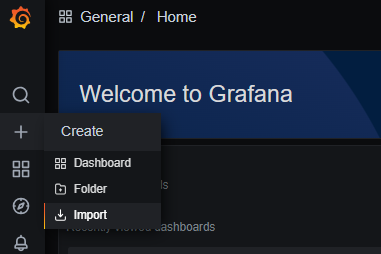
Now switch to the Grafana interface with your browser and import the dashboard – either by file upload or by copy&paste:
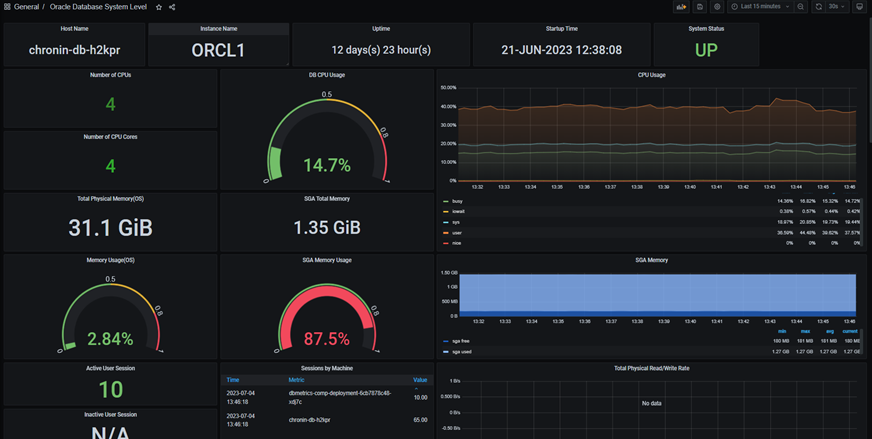
A new dashboard should now be available for viewing – and should also be filled with values from Prometheus:
In the github project, there are further dashboards and metrics (.toml files) for TEQ and Advanced Queuing in the branch called java-impl-branch, e.g. in the subdirectory oracle-teq/dashboards and oracle-teq/metrics. In the main branch, the docker_vol/graf_app_vol directory contains further database dashboards with individual parts from the main dashboard for I/O behavior, SQL cache, concurrency. These may require additional metrics from the oracle-db-monitoring-exporter subdirectory.
Congratulations and thank you for your attention so far! Have fun testing and trying things out.
Conclusion:
We can still expect some refined and improved features until Oracle Database 23c is officially available and has overcome the developer preview status. All in all, there is already quite comprehensive support for typical container environments. The current Database Operator for Kubernetes, which is fully supported by database licenses, also works with Oracle 19c and 21c database versions, even if it is primarily seen in the context of Oracle 23c’s comprehensive microservices support. The same principle also applies to the Unified Observability Exporter for Grafana.
Doing System Integration, Data Integration, System Integration Frameworks and Data Integration Frameworks since so many years and moved from Transaction Monitors to Application Servers to Cloud Infrastructure, Kubernetes and AI - all in the name of Oracle.


 The OraOperator manages containers of the type OracleRestDataServices (ORDS) with an equally encrypted network connection from inside and outside. It is only necessary to specify how many containers are to be started and which database they should belong to. The required certificates, users and passwords can be taken from the same Kubernetes Secrets as those for creating and managing the databases themselves. This means that Application Express (APEX), REST enabled schemas and Database Actions (formerly SQL*Developer Web) are available for the connected database and can also be updated by simply swapping the container version number.