
When detection coverage needs more context
A detection coverage map should answer a simple question: what do we cover? In a large cloud environment, however, the answer can quickly become more complicated. A behavior may be correctly classified and represented as covered, but that alone may not tell us where in the architecture the behavior occurs, which cloud services it applies to, or where the detection has been implemented and validated.

MITRE ATT&CK is an incredibly useful tool for detection engineering. It gives us a common language for describing adversary behavior, organizing detections, and understanding how different techniques relate to one another. At Oracle, we continue to use it for exactly that purpose.
The challenge appears when we use those behavioral mappings to measure coverage at cloud scale. A technique may be represented as covered because a detection exists, but the coverage view may not show the architectural layer, cloud service, or specific service capability for which that detection has been implemented and validated. That distinction matters in the cloud because the same broad behavior can span services with very different architectures, capabilities, APIs, and telemetry.
This was not something we discovered through a single incident, audit, or customer concern. It emerged gradually through years of building detections and reviewing coverage. The same questions kept coming up: Where in the cloud architecture does this behavior occur? Which services can be exhibited? Where have we implemented and validated the detection? Over time, those questions became an engineering problem of their own.
For me, that problem is particularly interesting because I have spent the past eight years building and leading detection engineering at OCI. As a Senior Principal Detection Engineering Lead, much of my work has focused on large-scale threat detection, behavioral analytics, and applying machine learning to security across OCI’s global cloud infrastructure. As our detection capabilities grew, understanding where to build next became just as important as understanding what we had already built. I wanted our coverage model to help answer that question.
That thinking led to the approach described in this article. We continue to use MITRE ATT&CK for behavioral classification, while adding architectural, service, and validation context to provide a more granular view of cloud detection coverage.
The goal is not to change how we describe attacker behavior. It is to make the coverage claim more precise by showing where a behavior applies, where a detection has been implemented and validated, and what evidence supports that coverage across the cloud platform.
Why cloud architecture matters to coverage
Cloud infrastructure gives us many places where security-relevant behavior can occur. Some activity happens on a host. Some happens inside an application. Other activity is visible in the network fabric, identity systems, public-facing boundaries, or directly through the control and data planes of managed services. These surfaces do not all behave the same way, and they do not necessarily expose the same telemetry.
This way of thinking about cloud infrastructure builds on the layered approach described in the OCI Engineering article, “Logonomics—Identifying the Value of Security Logs” by Peter Hanily. That work looked at OCI through different units of measure and architectural layers, from individual entities such as compute instances and VCNs to broader layers of the platform. For detection coverage, we use a similar architectural perspective and apply it to the question of where detection behavior and evidence belong.
The coverage model uses seven architectural layers as shown in Figure 1.
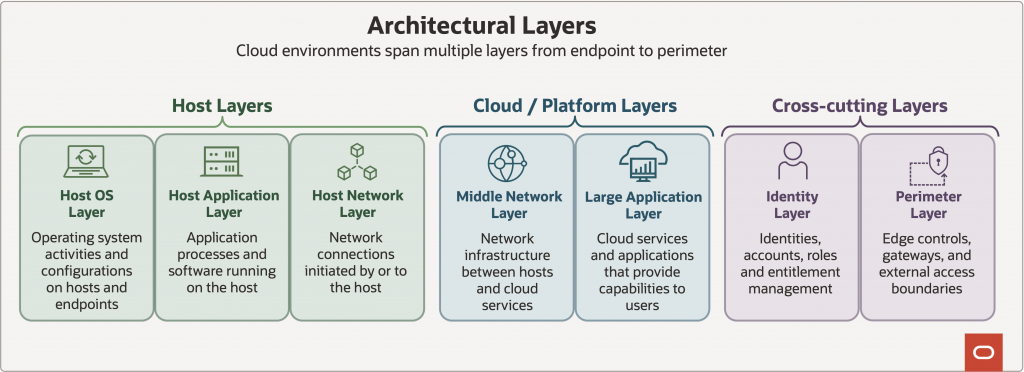
Within each layer, subcategories provide a more useful level of detail. For example, the Large Application Layer includes service-oriented behaviors such as data access and state changes, while the Identity Layer captures areas such as authentication, authorization, credential usage, and policy interactions.
The service dimension then adds another level of context. Two services can have broadly similar security behaviors while exposing different capabilities, APIs, and telemetry. A behavior can also be relevant to only a subset of services. That is why the model records not just the behavior, but where it sits architecturally and which service context is relevant.
From behavior to service-level coverage
Consider an Object Storage Pre-Authenticated Request (PAR) created with broad read access. A PAR provides access to Object Storage resources without requiring the recipient to have their own OCI credentials, making it a useful example of a behavior tied to a specific cloud service capability.
At a broad level, we could classify this as a cloud storage data-access behavior. That classification is useful, but for cloud coverage measurement we can go further. “Cloud storage” is not a single architectural surface or service. Different storage services expose different capabilities, access mechanisms, APIs, and telemetry.
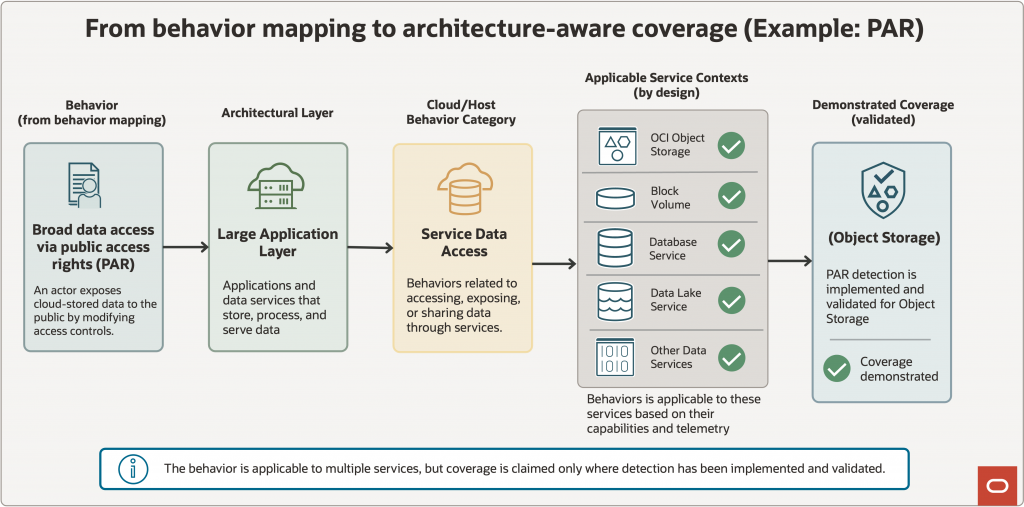
Without preserving that service context, a coverage statement can become ambiguous. For example, if a detection for broad Object Storage access is represented simply as coverage for a cloud storage behavior, an engineer reviewing the coverage map may reasonably ask: Does this coverage also apply to Block Volume? File Storage? Or another storage service? The architecture-aware model makes the scope explicit. The PAR behavior can be represented as Figure 2.
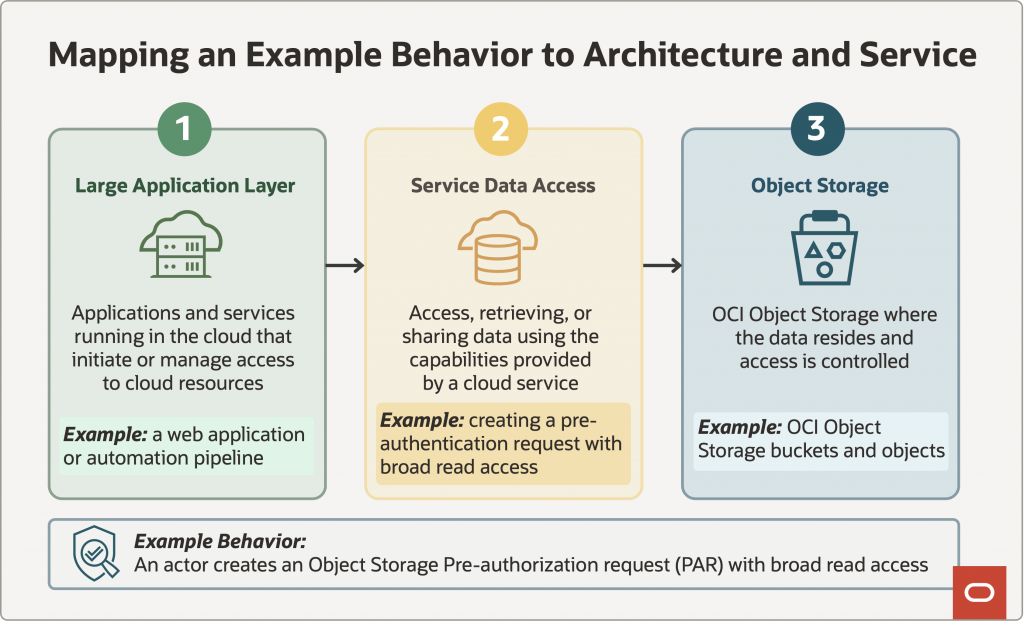
If a detection for that behavior has been implemented and validated, the model can then record demonstrated coverage for Object Storage for that specific behavior.
The value of the service dimension is therefore not simply that it tells us the detection involves Object Storage. It prevents a service-specific coverage claim from becoming unintentionally broader as it moves up the coverage hierarchy. The model preserves the architectural and service context needed to understand exactly what the evidence represents.
This becomes increasingly important as the number and variety of cloud services grow. A broad behavioral classification remains useful for understanding the activity, while the architectural and service dimensions provide the additional granularity needed to measure cloud detection coverage precisely.
Finding the right level of detail
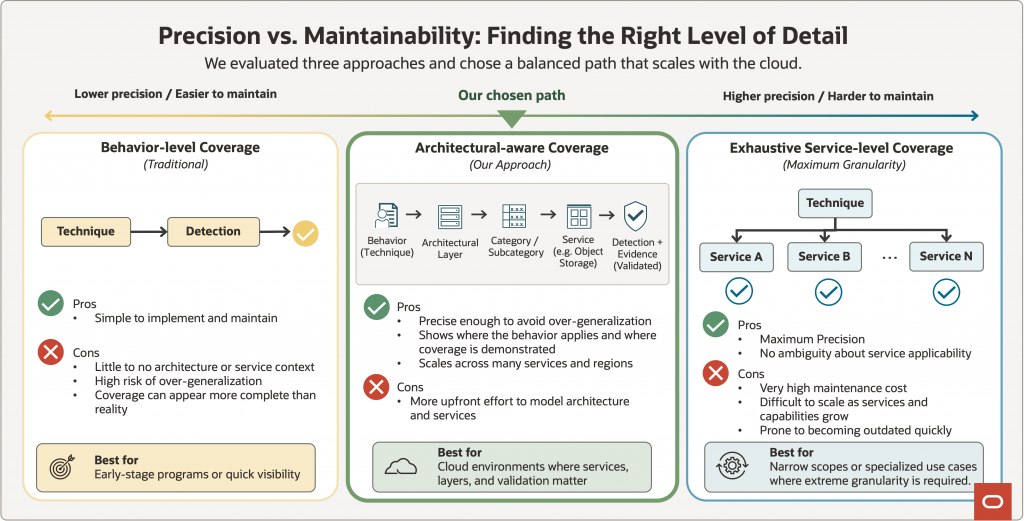
Once we decided that service context mattered, the temptation was to map everything to everything. Take every behavior, list every cloud service, and record whether the behavior applies. On paper, that gives you an extremely precise coverage matrix.
At cloud scale, though, that precision comes with a maintenance bill. Services launch and evolve. APIs change. New capabilities appear. Telemetry changes. A relationship that was not applicable yesterday may become relevant after a service introduces a new access path or feature. Keeping an exhaustive, complete behavior-by-service matrix current would mean continuously revisiting a very large number of relationships.
We also considered staying with a simpler behavior-oriented coverage view that maps detections to MITRE ATT&CK techniques without architectural or service context. That remains easy to understand and useful for classification, but it does not give us the service-level detail we wanted for this particular measurement problem.
The model therefore takes a middle path. We keep behavior mapping, add architectural categories and subcategories, identify applicable service contexts, and record validation evidence where coverage has been demonstrated. This path gives us useful granularity without requiring us to precompute and maintain every possible behavior-to-service combination. We get enough precision to be meaningful with the right context to avoid confusion while remaining maintainable at cloud scale.
That tradeoff became one of the most important design choices in the model. The aim is not maximum theoretical precision. It is enough precision to make coverage claims useful while keeping the model realistic to operate as the cloud changes.
How the coverage record works
A coverage record brings together several pieces of information: behavioral classification, architectural layer, category or subcategory, applicable service context, implemented detection, validation status and evidence, and review state. Detections can continue to carry their MITRE ATT&CK tactic and technique as behavioral classification metadata.
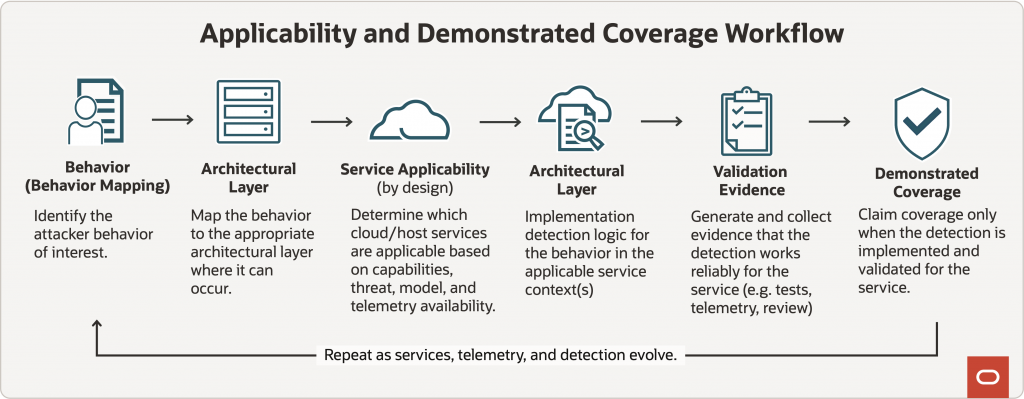
A simple way to express the workflow represented in Figure 5:
Applicability is not demonstrated coverage
The distinction that made the model practical was separating applicability from demonstrated coverage.
Applicability means that a behavior is relevant to a service or architectural layer by design. We can establish that through architecture analysis, service capabilities, threat modeling, and the telemetry available for that surface. It tells us where the behavior belongs in the model.
Demonstrated coverage is a stronger statement. It means a detection has been implemented and validated for that behavior and service context. Depending on the detection, the evidence can come from simulated events, detection-as-code testing, telemetry verification, manual review, or controlled security exercises.
Referring to our earlier PAR example, Object Storage can be identified as an applicable service context because PARs are a capability of the service. That alone is not a demonstrated coverage claim. Once the relevant detection is implemented and validation evidence exists, the record can represent demonstrated coverage for that behavior in Object Storage.
This distinction lets us be precise without using the model to make assumptions. If something is applicable but has not been demonstrated in the model, it stays as applicability. It does not imply that a service is unprotected. It simply means the coverage record only claims what its evidence supports.
Keeping the map current
Cloud coverage is a moving target. Services change, telemetry evolves, and detections are updated. A useful model has to acknowledge that a coverage claim can age.
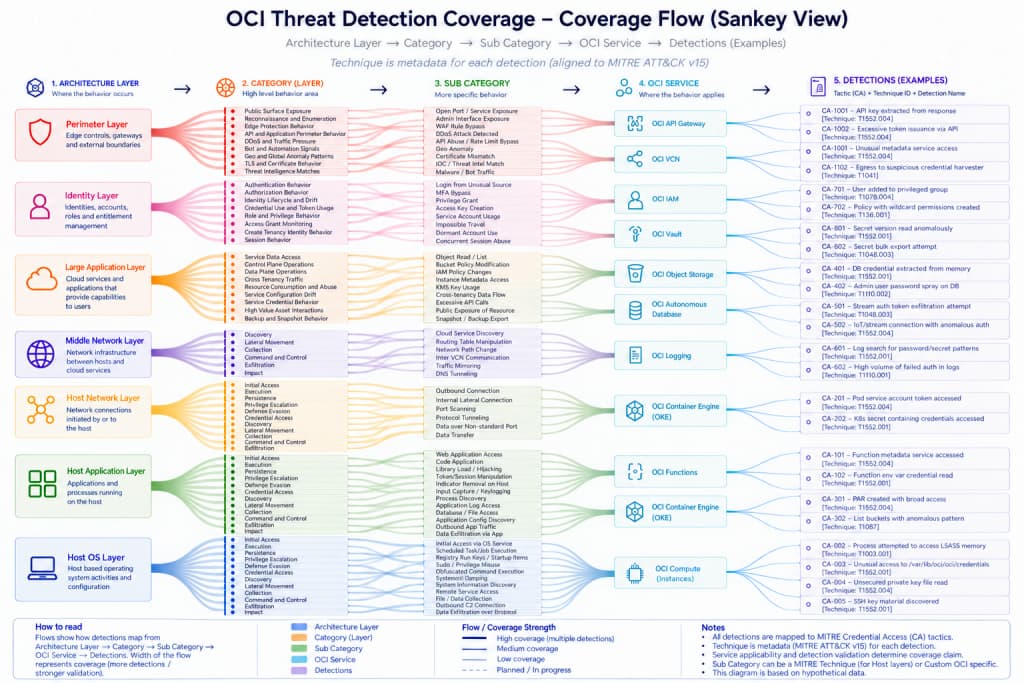
That is why validation evidence and review state are part of the record. When a relevant dependency changes, responsible detection and service owners can revisit the claim. If the evidence needs to be refreshed, the demonstrated status can be reviewed and validated again. The model can be represented through structured tables and explored visually using a Sankey-style view. The table carries the detail. The visualization helps us follow the path from behavior through architecture and service context to demonstrated coverage. Neither is an outcome by itself; they are ways of making a multidimensional coverage model usable.
What changes in practice
One of the most useful outcomes of the model is that it gives us a different way to think about the detection roadmap. Instead of prioritizing detections only by individual behaviors or requests, we can use the coverage view to understand which architectural areas and cloud services have less demonstrated coverage.
Coverage alone, however, does not determine priority. An area with fewer detections is not automatically the area where we should invest next. We combine what the coverage model shows us with threat information and feedback from our internal security teams, who have a practical view of where attacks are more likely, which services are higher value, and which behaviors deserve more attention.
Bringing those two views together helps us make better roadmap decisions. If the coverage model highlights an architectural area or service with relatively limited demonstrated coverage, and our internal security teams also identify that area as relevant to current attack patterns or risk, it becomes a stronger candidate for new detection engineering work.
This has changed the conversation from “What detection should we build next?” to “Where would the next detection meaningfully improve our coverage?” The coverage model gives us the engineering view of where coverage is concentrated or limited, while operational security knowledge helps us understand where additional coverage would have the most value.
Over time, this allows the detection roadmap to be driven by a combination of measured coverage, architectural context, service importance, and real-world threat information, rather than simply increasing the number of detections.
Acknowledgements
This work reflects collaboration across OCI security teams. I would like to thank Adrian McAlister from the SOC team, Peter Hanily, Security Analyst, and Chris Hamilton, Eric Chin, Deepa Balaji, and Ashley Tanner from Threat Detection for their feedback, collaboration, and contributions to the thinking behind this approach. I also want to acknowledge the wider SOC and Threat Detection teams whose day-to-day work and coverage discussions helped shape the problem this model is intended to address.