Logging More Wisely, Not Just More Logging
Logs are one of the most plentiful types of data on Earth. A grim prospect is that there could be more logs than any other type of data in existence. Who can really tell if this is the case? It especially feels that way if you work in security like me. The accumulation of logs is inevitable and, just like monetary wealth, the issues compound with volume, more logs, more problems. In my last Oracle “behind the scenes” blog, I walked through an approach to shrinking the logging footprint for security analysis—reducing operational costs while increasing the value of the analysis output.
However, a common piece of feedback I heard was “that’s only effective if you already know what to log”, indicating there was a missing first principles question of what to log in the first place. This also implies that your choices about what to log ultimately affect both your costs and security outcomes. At Oracle Cloud Infrastructure (OCI) our core values include putting customers first and nailing the basics, so this blog addresses that feedback and tackles the question of what to log. One way I have approached this within Oracle is through the lens of economics—or more succinctly, “logonomics” (puns are not a core value of OCI, but they are not actively discouraged).
Like other economic models, productivity increases play a huge role. In the context of logging, this would be your log pipeline, platform, and storage medium. For example, if you were a security engineer in the Silicon Valley HBO TV show universe and had access to their lossless compression algorithm, you’d be able to log about ten times more data on the same hardware, in the same period, for the same cost. However, I contend that, even with large productivity gains, it would only be a matter of time before those hard drives fill up and log volume—along with associated costs—scale at the same rate as before. This is because of the Jevons paradox and the economic principle of induced demand where making a resource more efficient (in this case, hard drive space) makes the overall demand increase (in this case, yet more logging).
So, while you can and should fight logonomic warfare on the productivity front, it’s not a perfect solution. Also, just because you’ve logged more doesn’t mean you’ve solved anything. In my experience logging more for the sake of it would increase noise and reduce useful signal, ultimately harming your investigations and outcomes. Productivity gains can also be uneven, for example, if your Security Information and Event Management (SIEM) platform can’t process the new, higher volume you can store; you’ll be in trouble when you need to use the logs. So, productivity alone won’t save us. What will? This blog seeks to address what you should log, and why.
Chasing the Unicorn—the Ideal Log Entry
Like any economic ideology we need to have in mind an optimal, almost dreamlike quality that we’re striving for aka chasing the unicorn. For me, the core of this has always been the concept of an individual log entry you could never put a price on. What magical properties would this single log entry have that billions of other logs lack? Probably something like the following table:
| Timely | Like any type of intel, it’s only useful if it appears at the right time, not before or after. Allowing you to maximize your leverage with the information it contains. |
| Clarity & density | Each field within this individual log would have the exact information you need to make informed decisions leaving no open questions or ambiguities. |
| Compliant and actionable | If you can’t actually use the log because of your company’s policies, your industry’s standards or your country’s laws, then it’s not useful to your efforts. |
| Ensured integrity | The log has to be something you can trust and believe has not been tampered with. Integrity is a core principle of information security, and it applies to logs as well. |
| Scarcity | If logs like this are 10 a penny, then it’s a horse, not a unicorn. |
| Contextual rarity | Almost a counterpoint to scarcity; contextual rarity applies to the event the log represents and how unique that is. This quality disregards volume as a factor of scarcity, for example 1 failed sign-on log tells you one thing, 10,000 such logs within 10 seconds says something else. The ideal here would be a single log that could tell you both. |
Those are all qualities of the log entry itself. It doesn’t consider something important though, which is your desire to obtain it. Desire is extremely variable and largely depends on your circumstances. For example, imagine you’re a bleary-eyed security responder, manager, or executive and seek to resolve a multi-day investigation. Like a sailor lost at sea you think logs, logs, everywhere, but not a drop to drink. The log you want in the case is the one you need! It’s the one that allows you to close out the investigation while preventing or stopping the harm coming to your company. Depending on your scenario, it might be the log that keeps your business in business. In a different context though where you’re not as hard-pressed, the same type of log would not be worth it.
Having this ideal in mind allows you to correctly frame the next step, which is: How do we maximize the chances we’ll produce not just one, but many unicorns—creating a steady stream of No. 1 hits and, ideally, a unicorn log entry farm?
Units of Measure
Like any type of prospector, you’re trying to maximize your win rate. Understanding where value is derived will increase your odds but knowing where to look for consistent sources of value will allow you to do this regularly. Anecdotally, many investigators I speak with tell me how they find themselves looking into the same types of entities with the same log sources repeatedly. You can look at this and say wow that’s boring why don’t you find new ways to look at things or new things to look at, and don’t you worry, we will get to that. However, a more favorable impression is that this is evidence for the benefits of the mundanity principle or more generally speaking the value of unglamorous work and so called “boring businesses.”
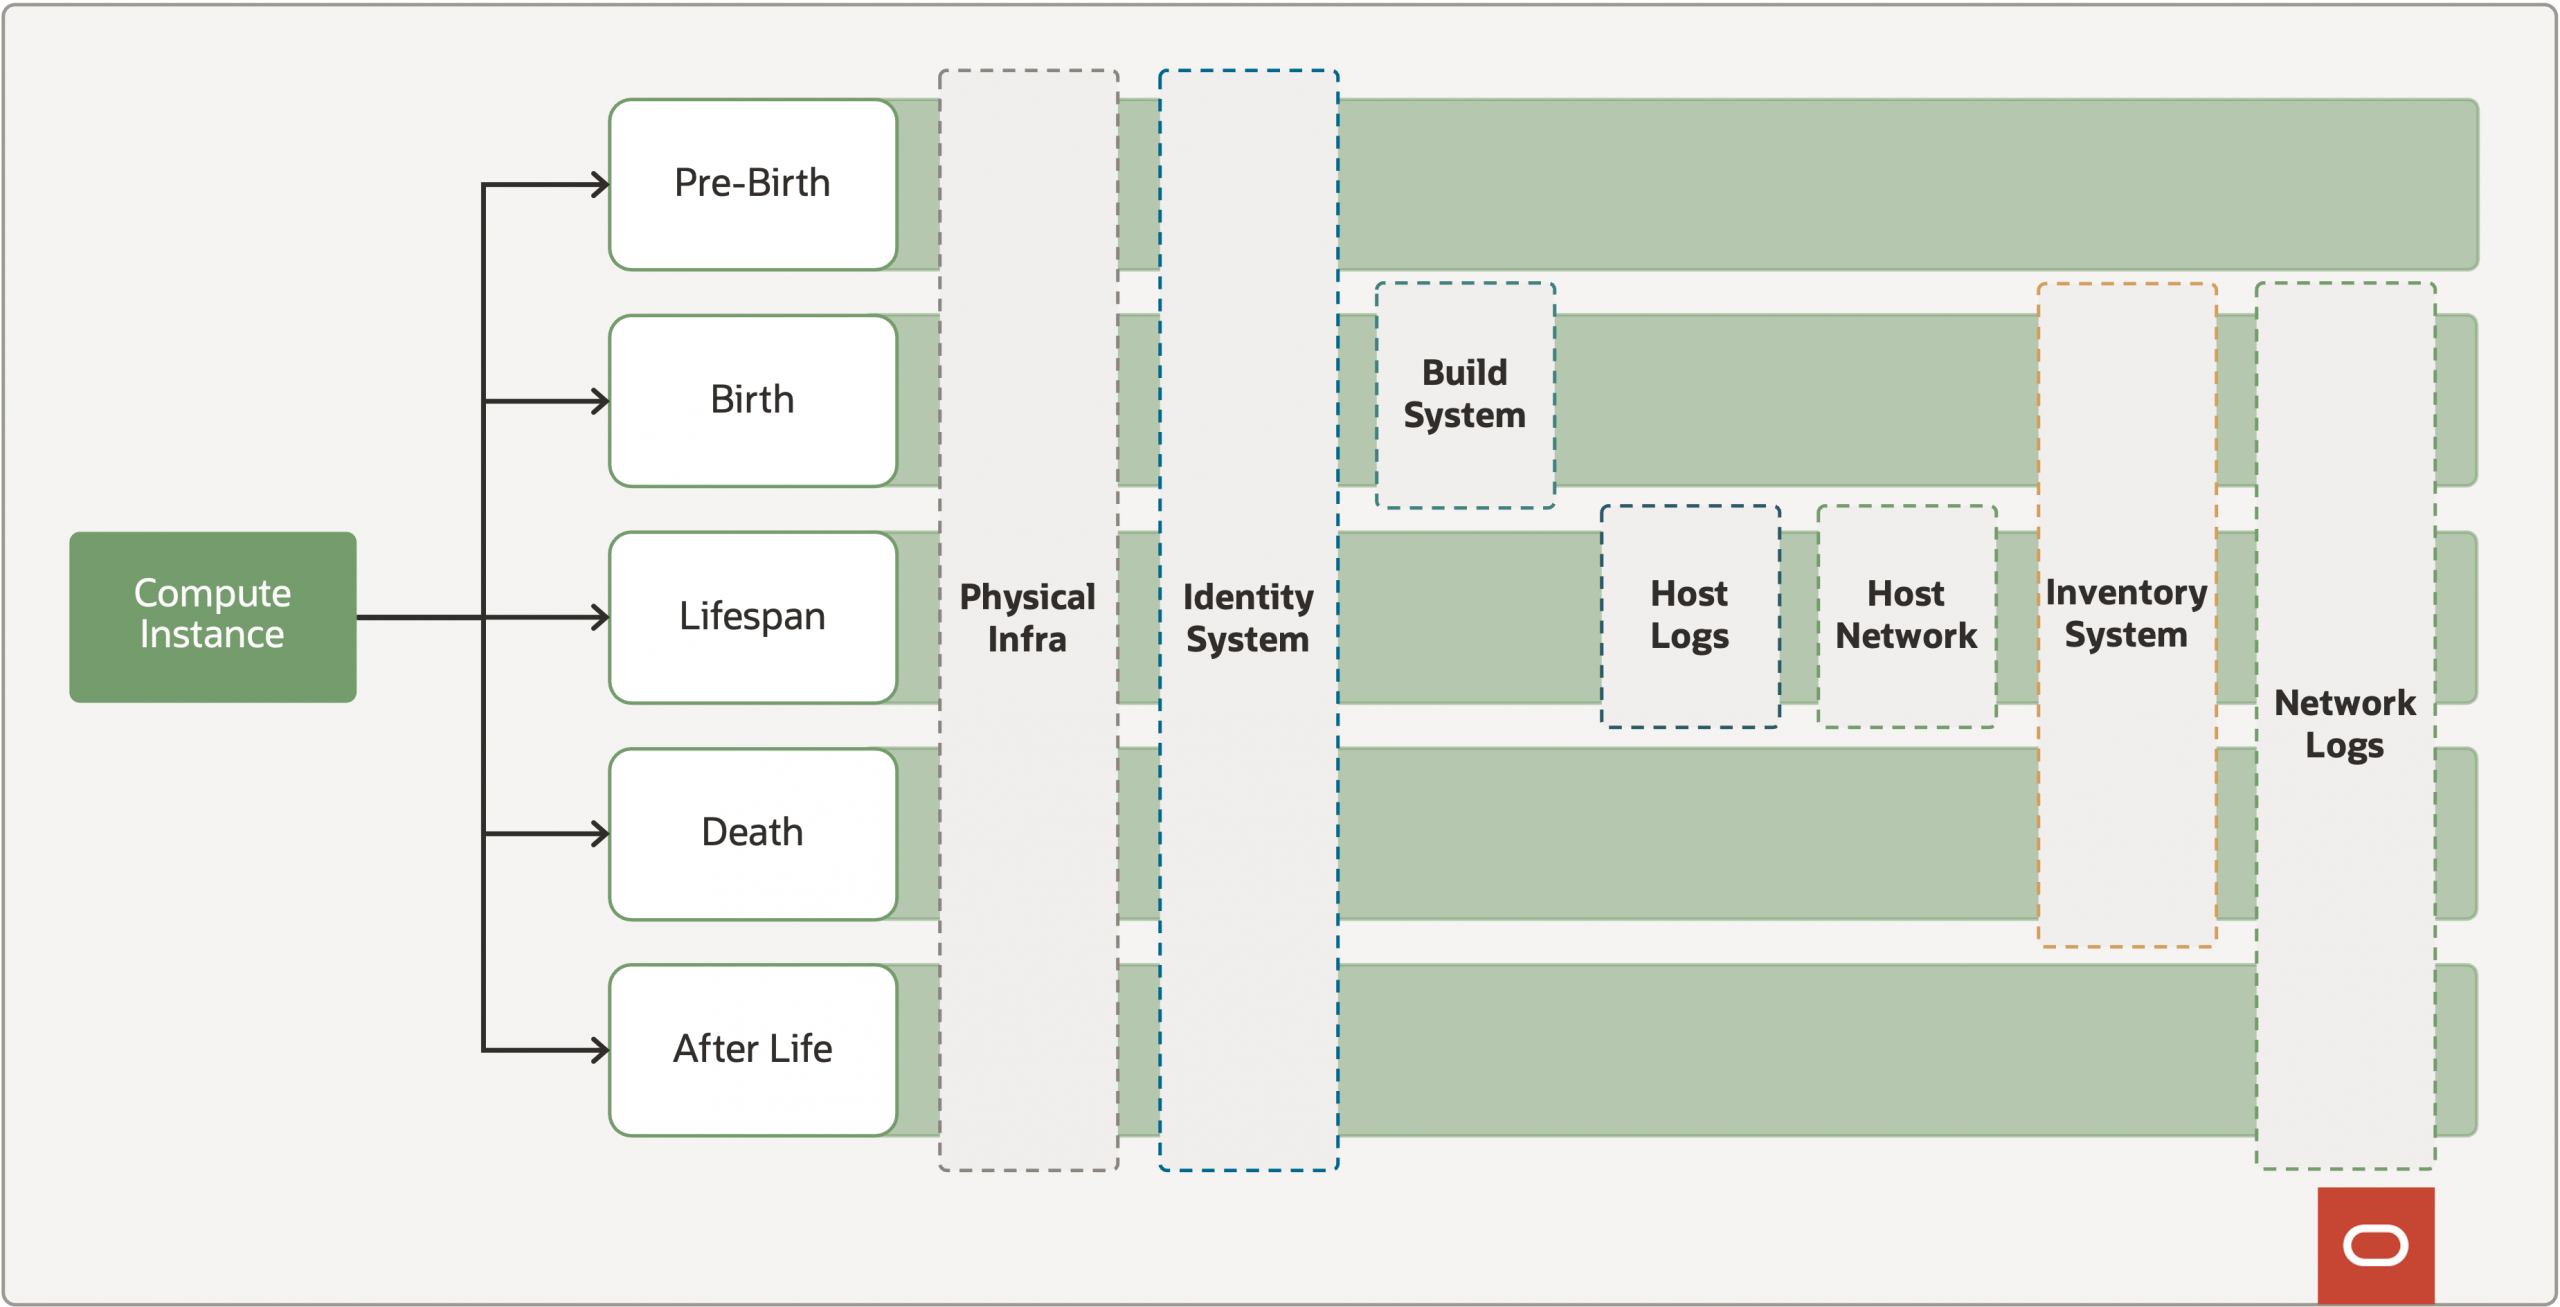
Faced with this realization, as an internal exercise, we took a step back and examined what are the entities we usually find ourselves investigating and how these connect. For example, an OCI Tenancy can contain multiple Virtual Cloud Networks, containing a multitude of compute instances. Effectively, these are the units we wanted to measure.
We found that no matter the entity you encounter they all share a common lifecycle:
| Pre-Birth | This is the time before the entity exists; its ingredients may already exist but haven’t been brought together just yet. | Compute instance’s physical properties like cores, memory, the shape, and its compute image all exist before it does |
| Birth | The event that brings the base ingredients together and creates the new entity. | When you request the launch of a compute instance, it brings together the base image, the compute infrastructure, and the tenancy where it will reside. |
| Lifespan | The period in which the entity exists after the birth phase and before it eventually terminates. | The compute instance is launched, it’s active, and can even be stopped/restarted numerous times. Everything that happens prior to termination is its lifespan. |
| Death | The event that causes the end of the entity to the point where it no longer exists. | When you request the termination of a compute instance, it releases the resources back to the cloud. |
| After-life | The traces the entity leaves on the world post termination and others’ attempts to interact within it. | Someone trying to send traffic to an instance after it’s been terminated or resolve the hostname of the instance. This is akin to trying to talk to ghosts—a machine seance. |
Taking into account an individual entity, for example, a compute instance that is under investigation. We can map the log sources which are needed to provide visibility for different phases of the lifecycle. This allows us to map out which sources provide the most bang for buck.
My advice if you want to do this yourself, take the time to itemize each entity you routinely investigate. This can vary depending on your environment, in an OCI specific context for example this would be:
- OCI Organization
- OCI Tenancy
- Virtual Cloud Network
- Compute Instance
- User accounts
- etc.
Generate a “unit of measure” diagram for each entity. Next map out the pivot points between entities, for example when investigating an OCI tenancy, you want to zoom in on a specific user account. After you complete this exercise, you should see the benefits manifest in a few different ways:
- Existing coverage understanding: Gives you an understanding of which log sources allow the best coverage across an individual entity or all entities in totality.
- Spot the gaps: Allows you to identify where you have visibility gaps and need to cultivate new sources to provide coverage.
- Spot redundancy: Allows you to identify where you have too many log sources covering specific areas and need to cut down.
- A practical tool for analysts: Provides your security investigators and detection engineers with a clear map of what log sources they have at their disposal to investigate an entity at each phase of its lifespan.
- Common Information Model (CIM): Within each dataset there will be common fields. You can use the outputs of this exercise to bolster your CIM or bootstrap a new one.
Green Field Datasets
After performing the units of measure of exercise, you may find that there are gaps for specific entities at certain points in their lifecycle. Certain gaps may mean you cannot detect whole classes of security events or that you will only detect the secondary effects of an event but not the cause. An example of secondary effects due to limited visibility would be you’re seeing a lot of traffic to crypto mining pools in your network logs, but don’t see that several new instances were launched in your tenancy by an account you don’t recognize.
Remember, we’re trying to increase our win rate for unicorn log entries, so your task is to get out there and work with stakeholders to identify the most optimal sources of coverage. This new log source is usually going to come from one of the three categories of logs:
| Operational exhaust | Generated from general business operations, not specifically for security, mainly used for service troubleshooting or metrics. |
| Generic security logs | Common security logging not specific to your company, usually vendor or open sources |
| Custom security logs | Custom security logging you’ve created internally to address gaps or enhance effectiveness. |
Don’t forget though that logs are not all you’ll need; they’ll need to be complemented by appropriate metadata sources. For example, network logs like those generated by Zeek are great but if in addition you had the metadata from your IP Address Management solution, suddenly you can contextualize traffic more effectively, increasing your odds at a detection. So, approach this task as though you’re looking for datasets, which can include, but aren’t always limited to logs.
When you find a new dataset, relish this opportunity. Your initial discoveries of this dataset will set its tone going forward. Specifically, it materially affects how important it will be perceived as and what resources will be put into operationalizing it. Do not squander this advantage, so once you find this new dataset try everything you can to exhaust its potential uses. Incorporate it into your larger units-of-measure-based understanding. Otherwise, you could be throwing an uncut gem onto the slag heap where it will remain “undiscovered.”
Vertical Integration Strategy—A Layered Approach
Performing the units of measure exercise, while effective, can sometimes take you too close to the problem and not allow you to see the forest for the trees. In business this approach would be akin to focus solely on horizontal integration as with the units of measure approach you are seeking to increase visibility and efficiency for specific entities.
Considering that let’s consider the counter strategy of vertical integration and how that would look in a logonomics context. What we came up with was the following model.

This model exposes some truths and harkens back to the concept of the unicorn log entry mentioned earlier. The higher breadth logs are always going to be better value for money, as a single source provides you with more coverage, so you’d think initially those are the ones you need. However, if you go all in on breadth but find yourself in a spot of bother on a specific host or application, those higher depth log sources are going to start looking very appealing! This is effectively a manifestation of the simplest economic principle we are taught as children but instead applied to cyber security “you can’t have your cake and eat it.”
Taking Stock
So, wait, I’ve read this far, and you’re telling me there’s no silver bullet to solve all my security logging problems, sadly yes. Like any of the great engineers throughout history, you’re always going to have to keep pushing for perfection. However, by becoming a student of, and then mastering logonomics, you can greatly increase the overall efficiency of your security log collection program and, just like money, put it to work for you, earning interest!”
At Oracle, we’re seeing log volume rise as a byproduct of hyperscaling. OCI has expanded across all dimensions, such as realms, regions, and services offered but, even within existing regions, more capacity is always being added. We have used the methods outlined above as a mechanism to direct spending to where it will achieve the greatest outcome. We hope you can achieve success and logonomic prosperity.
Acknowledgements
This blog describes the collaborative efforts of several of the Oracle Threat Intelligence Center (OTIC) and OCI Detection Engineering staff members. Thanks, in particular to Christopher Baker, Jonathan Taimanglo, Ryan Schilcher, and Athul Raju, for their contributions to these approaches and their practical implementation.