


Caching is easy when the dataset is small. Put frequently accessed data in memory, assign a time to live (TTL), and avoid repeated trips to a database or service. For many applications, that is enough. The engineering problem changes as the cache grows into hundreds of gigabytes or terabytes and becomes a shared data layer for multiple applications. At that scale, simply adding memory does not guarantee predictable performance. A single hot key can saturate a shard. Large values can consume network bandwidth and make rebalancing expensive. An inefficient command that was harmless on a small dataset can block work on a busy node. And cluster-wide averages can hide a shard that is approaching its limits.
OCI Cache provides a managed Valkey and Redis-compatible service for low-latency, in-memory workloads. In an earlier blog, Scaling OCI Cache, we discussed scale-out architectures, TTLs, and eviction policies. This article goes further and looks at what we have learned from operating substantially larger workloads. It assumes familiarity with Valkey fundamentals, including core data types, common commands, and basic cache design. It focuses on advanced workload-design and operational considerations for applications running at scale.
Design the cache around access patterns
The first scaling decision is often not the number of nodes or the amount of memory. It is how the application represents and accesses its data.
Avoid hot keys and hot shards
In a Valkey sharded cluster, a key belongs to a particular hash slot, which maps to one shard. If one key receives a disproportionate percentage of traffic, the shard serving it can become constrained by CPU or network bandwidth even while the rest of the cluster remains lightly utilized. This is the classic hot-key problem. A related problem is a hot shard. A shard does not need one extremely popular key to become overloaded. Many frequently accessed keys can happen to map to the same shard and collectively consume more resources than keys on neighboring shards.
Adding more aggregate cluster capacity does not necessarily solve either problem. Instead, look at the distribution of traffic.
- Partition very high-traffic data across multiple keys.
- Avoid designs in which large portions of application traffic converge on one global key.
- Consider a short-lived application-local cache for extremely popular, read-only data.
- Monitor resource utilization per shard rather than only at the cluster level.
Valkey hash tags can intentionally place related keys in the same hash slot. That is useful when an application requires atomic multi-key operations. However, use hash tags carefully: placing too many high-traffic keys in one slot can create a hot shard and leave the rest of the cluster underused.
Use small, purpose-built values
Large cached objects are convenient, but convenience can become expensive at scale. Consider a product object containing price, availability, summary, images, reviews, recommendations, metadata, rating. If the application request path only needs summary, rating, price and availability, retrieving and deserializing the full object increases memory consumption, network transfer, and application work. A more scalable approach is often to cache only what each access path needs. This also allows for different expiration policies. Availability might need to expire after a few seconds, while relatively stable product metadata may remain useful for hours.
Smaller objects provide another benefit that becomes increasingly important with large clusters: they make replication, recovery, and rebalancing less disruptive because less data needs to move at once. The goal is not to make every value as small as possible. It is to avoid paying repeatedly for data that a request does not need.
Choose strings, hashes or JSON deliberately
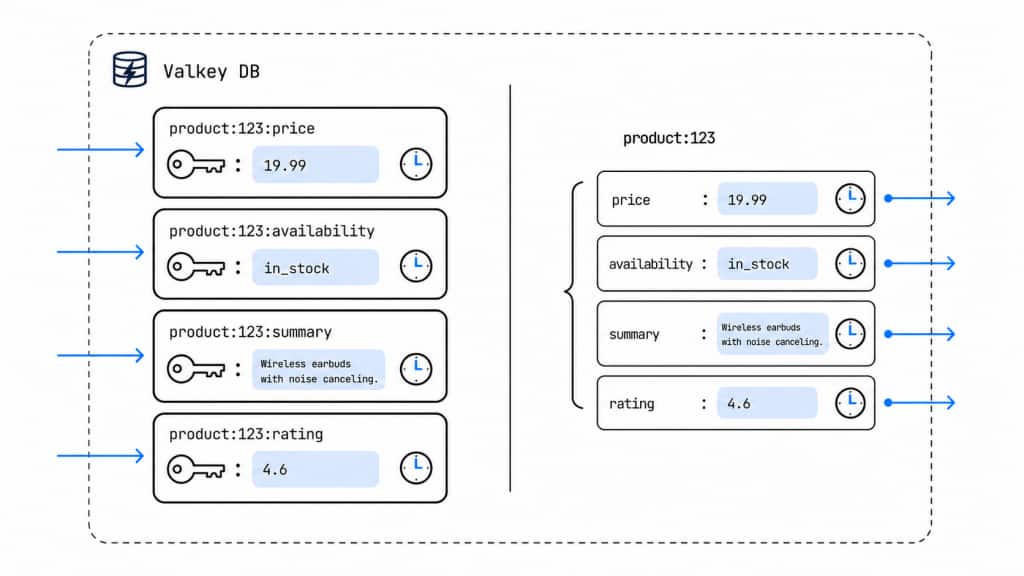
Choose the data structure based on how the application reads data, updates it, and expires it. Use separate string keys when attributes are accessed independently or need different TTLs:
  product:123:price
  product:123:availability
  product:123:summary
This keeps expiration simple, but increases key metadata and can require multiple reads to assemble one product record.
Use a hash when related attributes are usually read together and share a lifecycle. A single product:123 hash reduces key overhead, and HGET retrieves only the required field. By default, expiration applies to the entire hash. Valkey 9 adds hash-field expiration, which keeps related fields together while allowing different TTLs:
HSET product:123 name "Camera" price "299" availability "in_stock"
HEXPIRE product:123 3600 FIELDS 2 name price
HEXPIRE product:123 30 FIELDS 1 availability
Here, name and price expire after one hour, while availability expires after 30 seconds.
Use the Valkey JSON module when cached data is naturally hierarchical and the application benefits from document-style reads or targeted updates:
JSON.SET product:123 $ '{"name":"Camera","price":299,"availability":true}'
JSON.GET product:123 $.price $.availability
JSON can reduce application-side serialization and avoid transferring fields the request does not need. Keep documents compact, use direct JSON paths, and avoid broad recursive or filtered queries on hot request paths. If fields have very different TTLs, separate strings or hash-field expiration are usually a better fit.
Make command cost predictable
Data size is only one dimension of cache scale. Command behavior matters just as much. At high request volumes, expensive commands can consume disproportionate server time and increase latency for unrelated requests handled by the same shard.
Use pipelining to reduce round trips
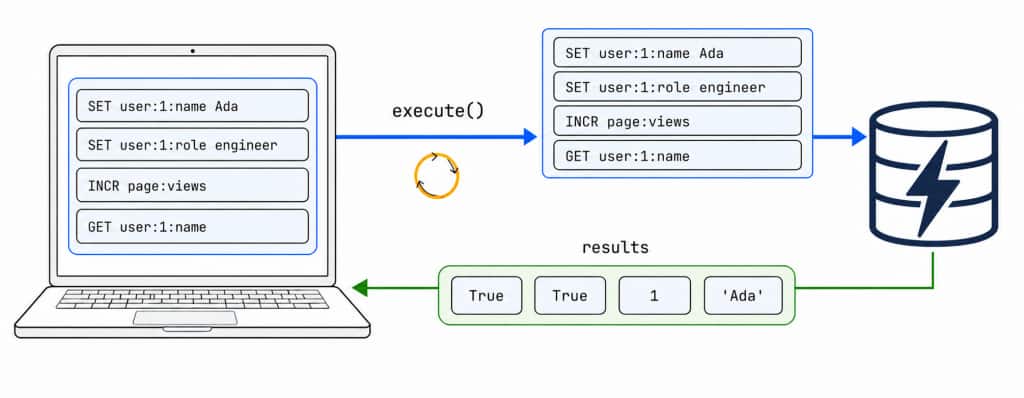
Applications frequently need to perform several independent cache operations at once. Without pipelining, the client typically sends a command, waits for the response, sends the next command, and repeats the process. Pipelining lets the application send multiple commands before waiting for their responses, reducing network round trips and increasing throughput. It is particularly useful for bulk reads and writes.
Be cautious with commands whose cost grows with data
A command that appears inexpensive during development may behave very differently once a cache contains hundreds of gigabytes of data. One familiar example is KEYS, it scans the keyspace for matching keys before returning, making it unsuitable for production request paths on large datasets. Use incremental iteration with SCAN instead.
The same principle applies inside data structures:
- Prefer
HGETwhen the fields are known instead of retrieving an entire large hash with HGETALL. - Use
HSCANwhen iterating through large hashes. - Bound range operations on large lists and sorted sets.
- Be careful with commands such as
SMEMBERSwhen sets can become large. - Consider
UNLINKinstead of synchronousDELwhen removing large keys and asynchronous deletion is acceptable.
This does not mean O(N) commands should never be used. It means their input size should be understood and bounded. At scale, unbounded work is the real risk.
Understand multi-key operations in a cluster
In a Valkey Cluster, multi-key operations work only when all referenced keys are in the same hash slot and therefore on the same shard. This applies to commands such as MGET, MSET, set and sorted-set operations, transactions (MULTI / EXEC), and Lua scripts. If the keys map to different slots, Valkey cannot execute the operation atomically and returns a CROSSSLOT error.
When an operation must be atomic, use a hash tag: Valkey hashes the value inside braces to select the slot. For example, these keys are deliberately colocated:
  user:{123}:profile
  user:{123}:sessions
  user:{123}:settings
Because they share the {123} tag, an application can perform an atomic operation over one user’s related data while data for other users remains distributed across the cluster.
Use hash tags selectively. Choose a naturally high-cardinality value, such as a user, account, or tenant ID. Generic tags such as {users} or {global} place unrelated data on one shard, concentrating memory, CPU, and request traffic. That can create a hot shard and limit overall throughput.
Monitor every shard, not just the cluster
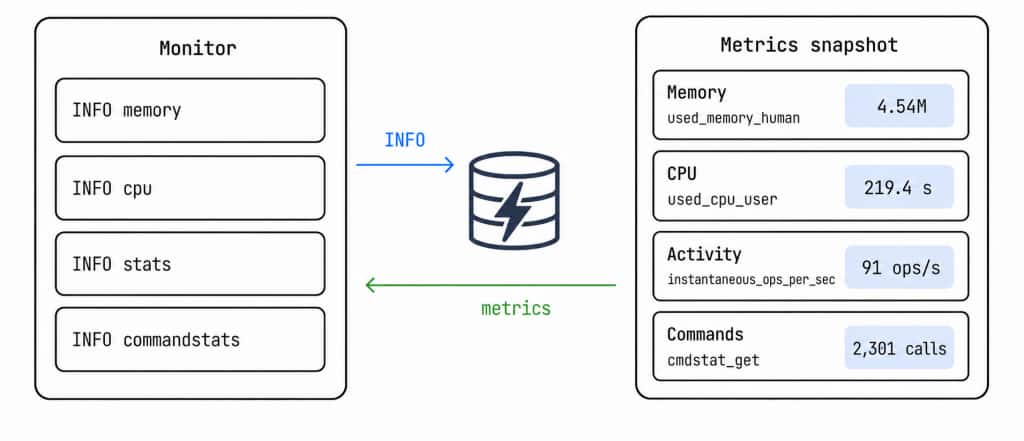
OCI Cache service and infrastructure metrics provide a cluster-level view of health, including latency, CPU, memory, connections, and shard distribution. Additionally, Valkey INFO and CLUSTER INFO commands add details such as command rates, memory fragmentation, evictions, replication status, keyspace statistics, and client activity. Together, these signals help identify inefficient commands, hot or unevenly utilized shards, and unexpected application behavior before they affect users. You can run these commands and build your own monitoring dashboards.
Memory
Track memory usage, evictions and expired keys. Set alarms for sustained high memory utilization so the cache can be resized before it reaches its configured memory limit and starts evicting data unexpectedly. Evictions are not always failures: an eviction policy is often intentional for a cache. However, a sudden or sustained increase may indicate overly long TTLs or insufficient capacity. Review memory use per shard – not just cluster-wide – because one shard can be under pressure even when total cluster capacity appears sufficient.
Useful INFO sections include:
  INFO memory
  INFO stats
  INFO keyspace
CPU
Monitor CPU per shard, not just the cluster average. Averages can hide an overloaded node when traffic or data is unevenly distributed. Sustained high CPU, or frequent short spikes, can indicate hot keys/shards, expensive commands or inefficient application access patterns.
When CPU rises, compare it with command throughput, network traffic, client connections, and latency. Higher CPU alongside higher throughput may reflect normal demand. High CPU without a similar increase in throughput often points to inefficient work, such as repeated KEYS, unbounded HGETALL or SMEMBERS, large range queries, or expensive JSON searches. Compare these signals across shards. If one shard consistently uses more CPU than its peers, inspect its key distribution, hash-tag usage, and the commands targeting it.
Useful commands include:
  INFO cpu
  INFO commandstats
Use SLOWLOG to find expensive commands
SLOWLOG records commands that exceed Valkey’s configured execution-time threshold. Use it to identify commands that consume excessive server time and can delay other requests on the same shard.
  SLOWLOG GET 10
  SLOWLOG LEN
Each entry includes the command, its execution duration, timestamp, and client information. The threshold and retained-entry limit can be reviewed with:
  CONFIG GET slowlog-log-slower-than
  CONFIG GET slowlog-max-len
The threshold is measured in microseconds. Choose a value that highlights meaningful latency for the workload without generating excessive noise.
How OCI Cloud Guard team uses OCI Cache
OCI Cloud Guard is OCI’s cloud-native security service for continuously monitoring customer environments and identifying risky configurations, suspicious activity, and potential threats. In its largest OCI region, Cloud Guard monitors more than 35K tenancies and over 1 million compartments. OCI Cloud Guard processes millions of events each hour and needs many internal services to access the same changing operational context. Retrieving that context directly from databases and service APIs increased latency and backend load. Separate in-process caches avoided some reads, but duplicated large datasets across application instances and made synchronization and invalidation difficult.
OCI Cache with Valkey provides a shared, low-latency data layer for this context. Applications read from and write to the same distributed cache rather than maintaining independent copies. Most data is stored as compact strings or hashes, with sets and bitmaps used for membership checks and compact state representation. This lets applications retrieve only the data they need while keeping memory use and network transfer predictable. The cache receives an average of approximately 400 reads per minute, with spikes of up to 15,000 reads per minute. Given that Valkey can support up to 100K operations per second per node, the workload remains well within the cluster’s measured capacity, leaving headroom for traffic growth and operational events.
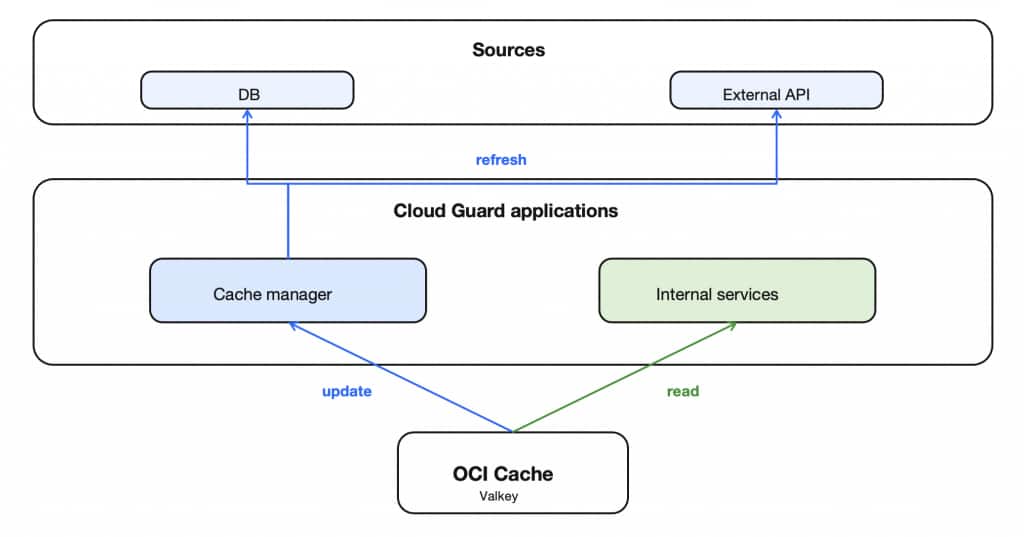
Cloud Guard’s deployment uses five shards, each with a 200 GB primary and one replica. The primaries provide 1 TB of logical cache capacity and currently store more than 600 GB of data. Writes are directed to the primary for the appropriate shard and replicated for high availability. Read traffic is served from replicas, preserving primary capacity for writes; workloads that require strict read-after-write consistency are directed to the primary. This access pattern distributes read load while maintaining a consistent shared view of operational context.
TTLs align with the lifecycle of cached data. Short-lived state and lookup results expire automatically, while deletion markers are retained longer to prevent stale information from being reintroduced. Longer-lived shared context does not use a blanket TTL; instead, a dedicated service periodically refreshes and reconciles the data, applies incremental updates, and removes stale entries for all consuming applications.
Cloud Guard monitors memory, utilization, cache hits and misses, evictions, expirations, connections, read and write activity, and replication lag for every primary and replica. Per-shard monitoring is especially important: a cluster-wide average can hide a shard with uneven memory growth or traffic. These signals are published with application metrics so the team can identify imbalance early and add capacity before cache pressure affects event processing.
How OCI Security Central team uses OCI Cache
OCI Security Central provides vulnerability-management services to OCI engineering groups and processes more than 70 million events per day. To make each security finding actionable, Security Central maps affected assets to the teams responsible for remediation.
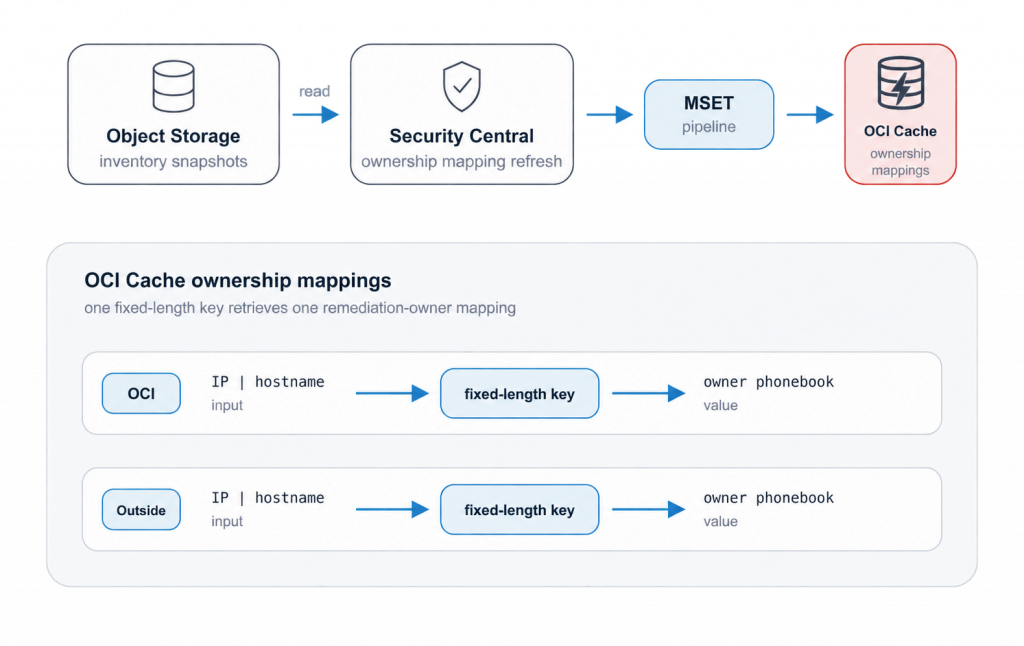
Security Central uses OCI Cache to maintain asset-to-owner mappings in memory. Each finding performs a direct key-value lookup to retrieve the ownership information needed for remediation. This provides expected O(1) lookup work as the mapping set grows. To keep cache-key overhead predictable, Security Central converts variable-length asset identifiers into fixed-length keys. This keeps the memory and network cost of the key stable even when source identifiers differ in length, while preserving direct key-value lookup for each ownership mapping.
Security Central populates and refreshes these mappings with MSET operations. For larger updates, it pipelines MSET commands to reduce network round trips and support efficient bulk ingestion. This design separates the two scaling concerns: pipelined batch writes efficiently load large mapping sets, while direct key-value lookups keep ownership matching fast for each finding.
The deployment uses three non-sharded Valkey 7.2 nodes: one primary and two replicas, each with 200 GB of capacity. Cache lookups average 20K per second and peak at 30K per second, while primary ingest averages about 100 MB/s and peaks near 200 MB/s. Security Central monitors cache health alongside application health, including hit ratio, blocked clients, replica lag, and host and engine CPU utilization. The cache maintains an approximately 80% hit ratio, no blocked clients, and low replica lag, with substantial CPU headroom for growth.
Conclusion
Scaling a cache to terabytes is an operating discipline, not simply a capacity decision. Success depends on keeping data compact, distributing work evenly across shards, choosing data structures and TTLs that match access patterns, and avoiding commands that create unbounded work on a busy node.
The practical goal is predictable behavior under load: no hot shard, no oversized payloads, no surprise evictions, and no blind spots in memory or replication health. When those fundamentals are designed from the start, Valkey can remain a reliable, low-latency shared data layer as both the dataset and request volumes grow.
References
- https://www.oracle.com/cloud/cache/
- https://docs.oracle.com/en-us/iaas/Content/cloud-guard/home.htm
- https://blogs.oracle.com/cloud-infrastructure/scaling-oci-cache
- https://valkey.io/topics/hashes/
- https://valkey.io/blog/hash-fields-expiration/
- https://valkey.io/topics/valkey-json/
- https://valkey.io/blog/secret-life-of-data/