For organizations operating large fleets of GPUs—especially those exceeding 200 units—the traditional approach of manual diagnostics via SSH becomes unsustainable. Standard cloud monitoring are not designed to capture the subtle, performance-degrading issues unique to GPUs. A GPU may appear “operational” but suffer from underlying problems like ECC errors, interconnect faults, or thermal throttling. These issues often degrade the performance of critical AI/ML workloads without triggering conventional alerts, leading to wasted compute time and frustrating troubleshooting cycles. This realization led us to develop a specialized, integrated monitoring solution designed specifically to address the unique challenges of massive-scale GPU operations.
We have developed and released an open-source-based monitoring solution that provides the comprehensive fleet visibility, historical analysis, and specialized GPU-specific alerting required by high-performance compute (HPC) and AI/ML customers.
Deployment is designed for minimal friction, ensuring your teams spend less time on setup and more time on compute. Customers deploying on common orchestration platforms like Slurm or OKE (Oracle Kubernetes Engine) can enable the monitoring stack with a single checkbox during cluster provisioning.
These validated stacks are primarily managed via Terraform, providing an Infrastructure-as-Code approach to deployment. Specifically, the Slurm stack automates the stand-up of the RDMA network and compute instances, while the OKE stack provisions a high-performance Kubernetes environment with RDMA capabilities, ensuring optimal performance for large-scale AI/ML workloads.
The setup process is fully automated, installing all necessary exporters—including the common node exporters and specialized GPU metric exporters for both NVIDIA and AMD hardware—alongside the pre-provisioned Grafana and Prometheus. The result is a secure dashboard URL for immediate access, complete with predefined alert rules and a robust alert delivery system deployed automatically. The only customer-side configuration required is setting up an incoming webhook for Slack or configuring an email address to receive alerts.
Once provisioned, the system provides a deep, actionable view into the health of your entire cluster, transforming raw data into operational intelligence.
A Single Pane of Glass
To streamline operations, our dashboard acts as a single-stop view, consolidating all vital information. This comprehensive dashboard brings together core cluster health metrics, detailed GPU performance data, and relevant integration insights from external OCI services, allowing your team to assess and diagnose issues without navigating away from a single, unified interface.
Command Center
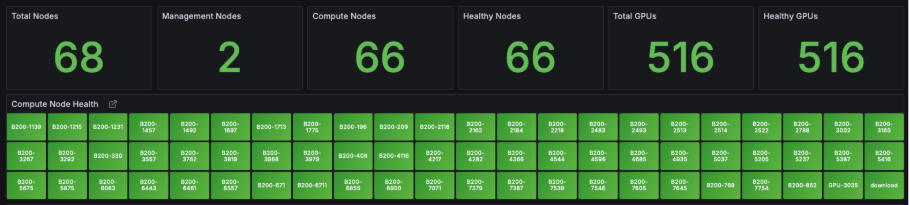
The Command Center is the first place to start, providing a high-level summary of your cluster. You can immediately assess the health of your compute nodes: a node in green is healthy, while a node in red indicates an immediate issue.
Deep-Dive Node Health and GPU Metrics
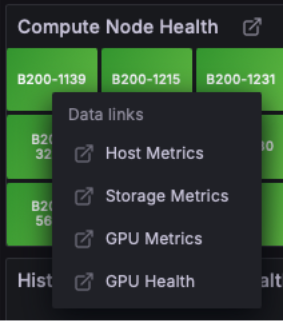
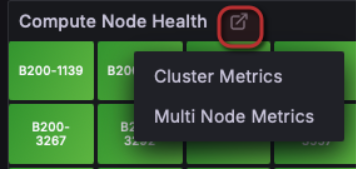
The health status of each node is derived from a list of active and passive health checks that cover all components impacting a workload—from the operating system to the networking fabric and the GPUs themselves. For granular troubleshooting, a context-sensitive menu is available by clicking on any specific node. This menu allows you to drill down into node-specific metrics, organized into sub-dashboards.
Advanced Time-Series Metric Analysis
Simple average metrics often mask performance issues inherent in bursty or highly variable system workloads. By tracking the 99th, 95th, and 90th percentiles of a time-series metric, we gain a clear view of peak demands and the experience of the worst-performing operations. This percentile-based approach is crucial for accurate capacity planning, troubleshooting resource contention, and preventing the silent degradation of overall system stability.
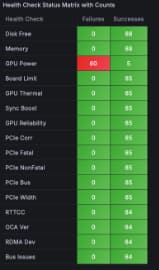
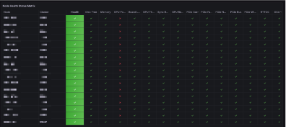
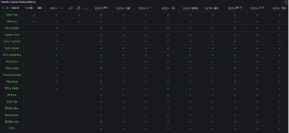
Advanced Diagnostics: Pinpointing Clustered Errors
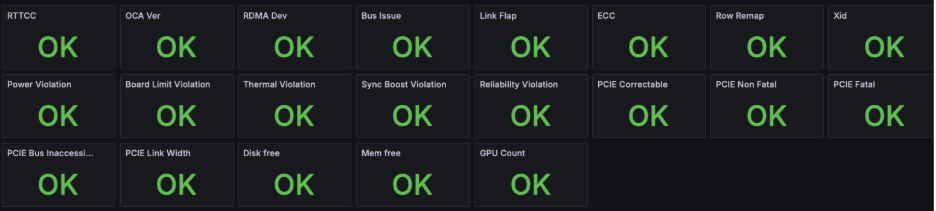
When dealing with large fleets, errors can often be clustered, occurring across multiple nodes simultaneously. To quickly diagnose these complex scenarios, we provide a Health Check Matrix feature. This is invaluable for identifying systemic issues that might not be obvious when looking at individual nodes. For example, a cluster-wide power management issue that leads to throttling can be immediately identified:
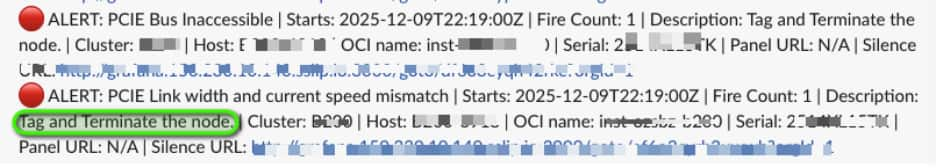
Real-Time, Actionable Alerting
While the dashboards provide comprehensive visibility, the alert system ensures you are notified instantly of critical events. Our robust integration supports real-time alert delivery to the platforms your team already uses: Slack, Email, Pager Duty, and custom systems via Webhooks. Each alert is designed to be actionable, providing the immediate context needed to identify the required next step.
This monitoring stack leverages the power and flexibility of the open-source community. Our dashboards are built and pre-provisioned using a Dashboard-as-Code paradigm (Grafonnet), ensuring reusability, consistency, and alignment with current best practices for monitoring large-scale GPU clusters. We are continuously improving the stack, incorporating the latest trends and architectural insights to ensure your AI/ML workloads always run on reliable infrastructure.
Conclusion and Call to Action
The unique demands of massive-scale GPU operations necessitate a specialized monitoring approach. Our integrated, open-source solution is engineered to address this gap.
It provides the necessary operational intelligence through a Single Pane of Glass, utilizes Advanced Time-Series Metric Analysis (percentiles) to unmask hidden performance issues, and deploys the Health Check Matrix for rapid diagnosis of clustered, systemic errors. This system transforms how you manage your infrastructure.
The solution is designed for minimal friction, enabling deployment on platforms like Slurm or OKE with a single checkbox during cluster provisioning.
Take control of your infrastructure’s reliability and performance today. Enable the monitoring stack to secure immediate access to deep-dive diagnostics and real-time, actionable alerting.