In 2021, Oracle Cloud Infrastructure (OCI) created a new program to fully automate the building of new regions. In a previous Behind the Scenes post, we explained how this process—Touchless Region Build (ToRB)—works. As with many software development challenges, there are typically two major stages in creating a solution: Enhancing accuracy and speed. In our case, the first objective was achieved fairly soon after the project began, but the second is ongoing. While improving performance is usually achievable, the effort required for each subsequent step increases exponentially.
ToRB is a global OCI project involving many teams, but building regions is just one aspect of their work. These teams are also responsible for cloud security, fixing issues, developing new features, operating existing clouds, and more. As a result, the region build team cannot simply request changes from an organization of over 10,000 employees. Each request must be supported by data analysis demonstrating the potential time savings associated with the implemention of the requested feature or fix. The less effort or development time required for this activity, the better. Unfortunately, for this second part, we can’t provide an estimate—only the service teams know it. However, the first part (time saved) is fully within the scope of region build.
In this post, we focus on the data analysis aspect and how it is done for the ToRB project. It’s important to always keep in mind the main business goal: making end-to-end region build faster and more consistent, with efficient use of developers’ time. Implementing a feature that could decrease region build time by 20% is very different from a feature that saves just 0.1%—the latter is likely not worth it.
The Problem of Scale
As described in the previous post, region build activities create a Directed Acyclic Graph (DAG) consisting of deployments. Each deployment depends on some cloud feature and publishes some of them. The graph is a well-known data structure with many libraries available for analysis, so the main challenge is to collect the data and represent it as a graph. We won’t go into details about data collection, even though it’s non-trivial—data is stored in different systems, accessible only via APIs. A single data-gathering cycle results in over 10,000 API calls (with substantial optimizations to limit the number of calls).
The obvious approach is to use deployments as nodes and feature publications/dependencies as edges. Problems start almost immediately, however: there are no good, ready-to-use libraries for time-based graph analysis. Many libraries exist for visualization, but with this number of nodes and edges, visualization is almost useless.
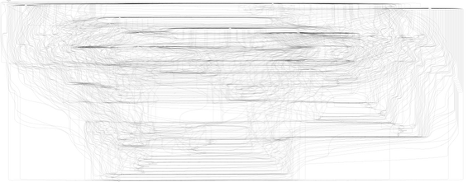
Figure 1: An example of an almost imperceptible Region Build DAG
As you can see by the vivid illustration above, we don’t have to worry too much about NDAs—Give your best Rorschach guess at what it might be. At the start of the ToRB project, we didn’t know the exact size of the DAG because it uses a federated model: each service team is responsible for their own automation, which may be implemented differently. The number of deployments varies widely (1 to 1,000), and the total number of nodes and edges was only known once all teams completed their automation. The UI initially included a graph visualization, but this was removed because, at this scale, it was useless for manual inspection.
Any timeline chart solution (usually used for project management) won’t work for us due to the scale. Fortunately, graph algorithms are well-researched (even if not fast), so we could implement what we needed ourselves. Various metrics can be computed on top of a DAG; the first step was to determine which ones to collect and optimize. Usually, the goal in graph analysis is to find the shortest path, but that was not our case—there are many short paths. We needed to calculate the longest path in the DAG and work toward its optimization (i.e., finding places where time could be saved). This longest path is called the Critical Path (a term that will be used below).
Business Requirements
We must always remember the business goal of this data analysis: to provide leadership with data to aid in project prioritization (asking a team to work for a year to potentially save a couple of minutes on a region build is not reasonable). Calculating standard metrics (sums, averages, etc.) on this dataset won’t help meet this objective. For example, summing deployment times for each service team or counting deployments are weak signals—different services perform different actions during region builds. If the analysis doesn’t provide a clear way to determine who should do what to improve region build time, it is not useful. Relying on weak signals can waste significant effort (and money) without improving anything.
Scope
The first issue we discovered on our journey was determining the end of the region build. This is not as straightforward as it might seem. Some services, like Fusion Middleware, are built on top of OCI but are technically not part of it. They can still use the region build orchestrator (creating their own would be inefficient). From a project management perspective, these should be tracked as separate activities and not included in the OCI region build time calculation (since they involve different contracts and timelines). Therefore, after the “end” of the OCI region build, other activities may still be ongoing, and some features remain unpublished. Additionally, core teams perform certain post-region build activities (deeper tests). From a data analysis viewpoint, we only know the date when the region is deemed “ready,” not the exact point in the graph.
Let’s take a closer look at the graph, considering this context.
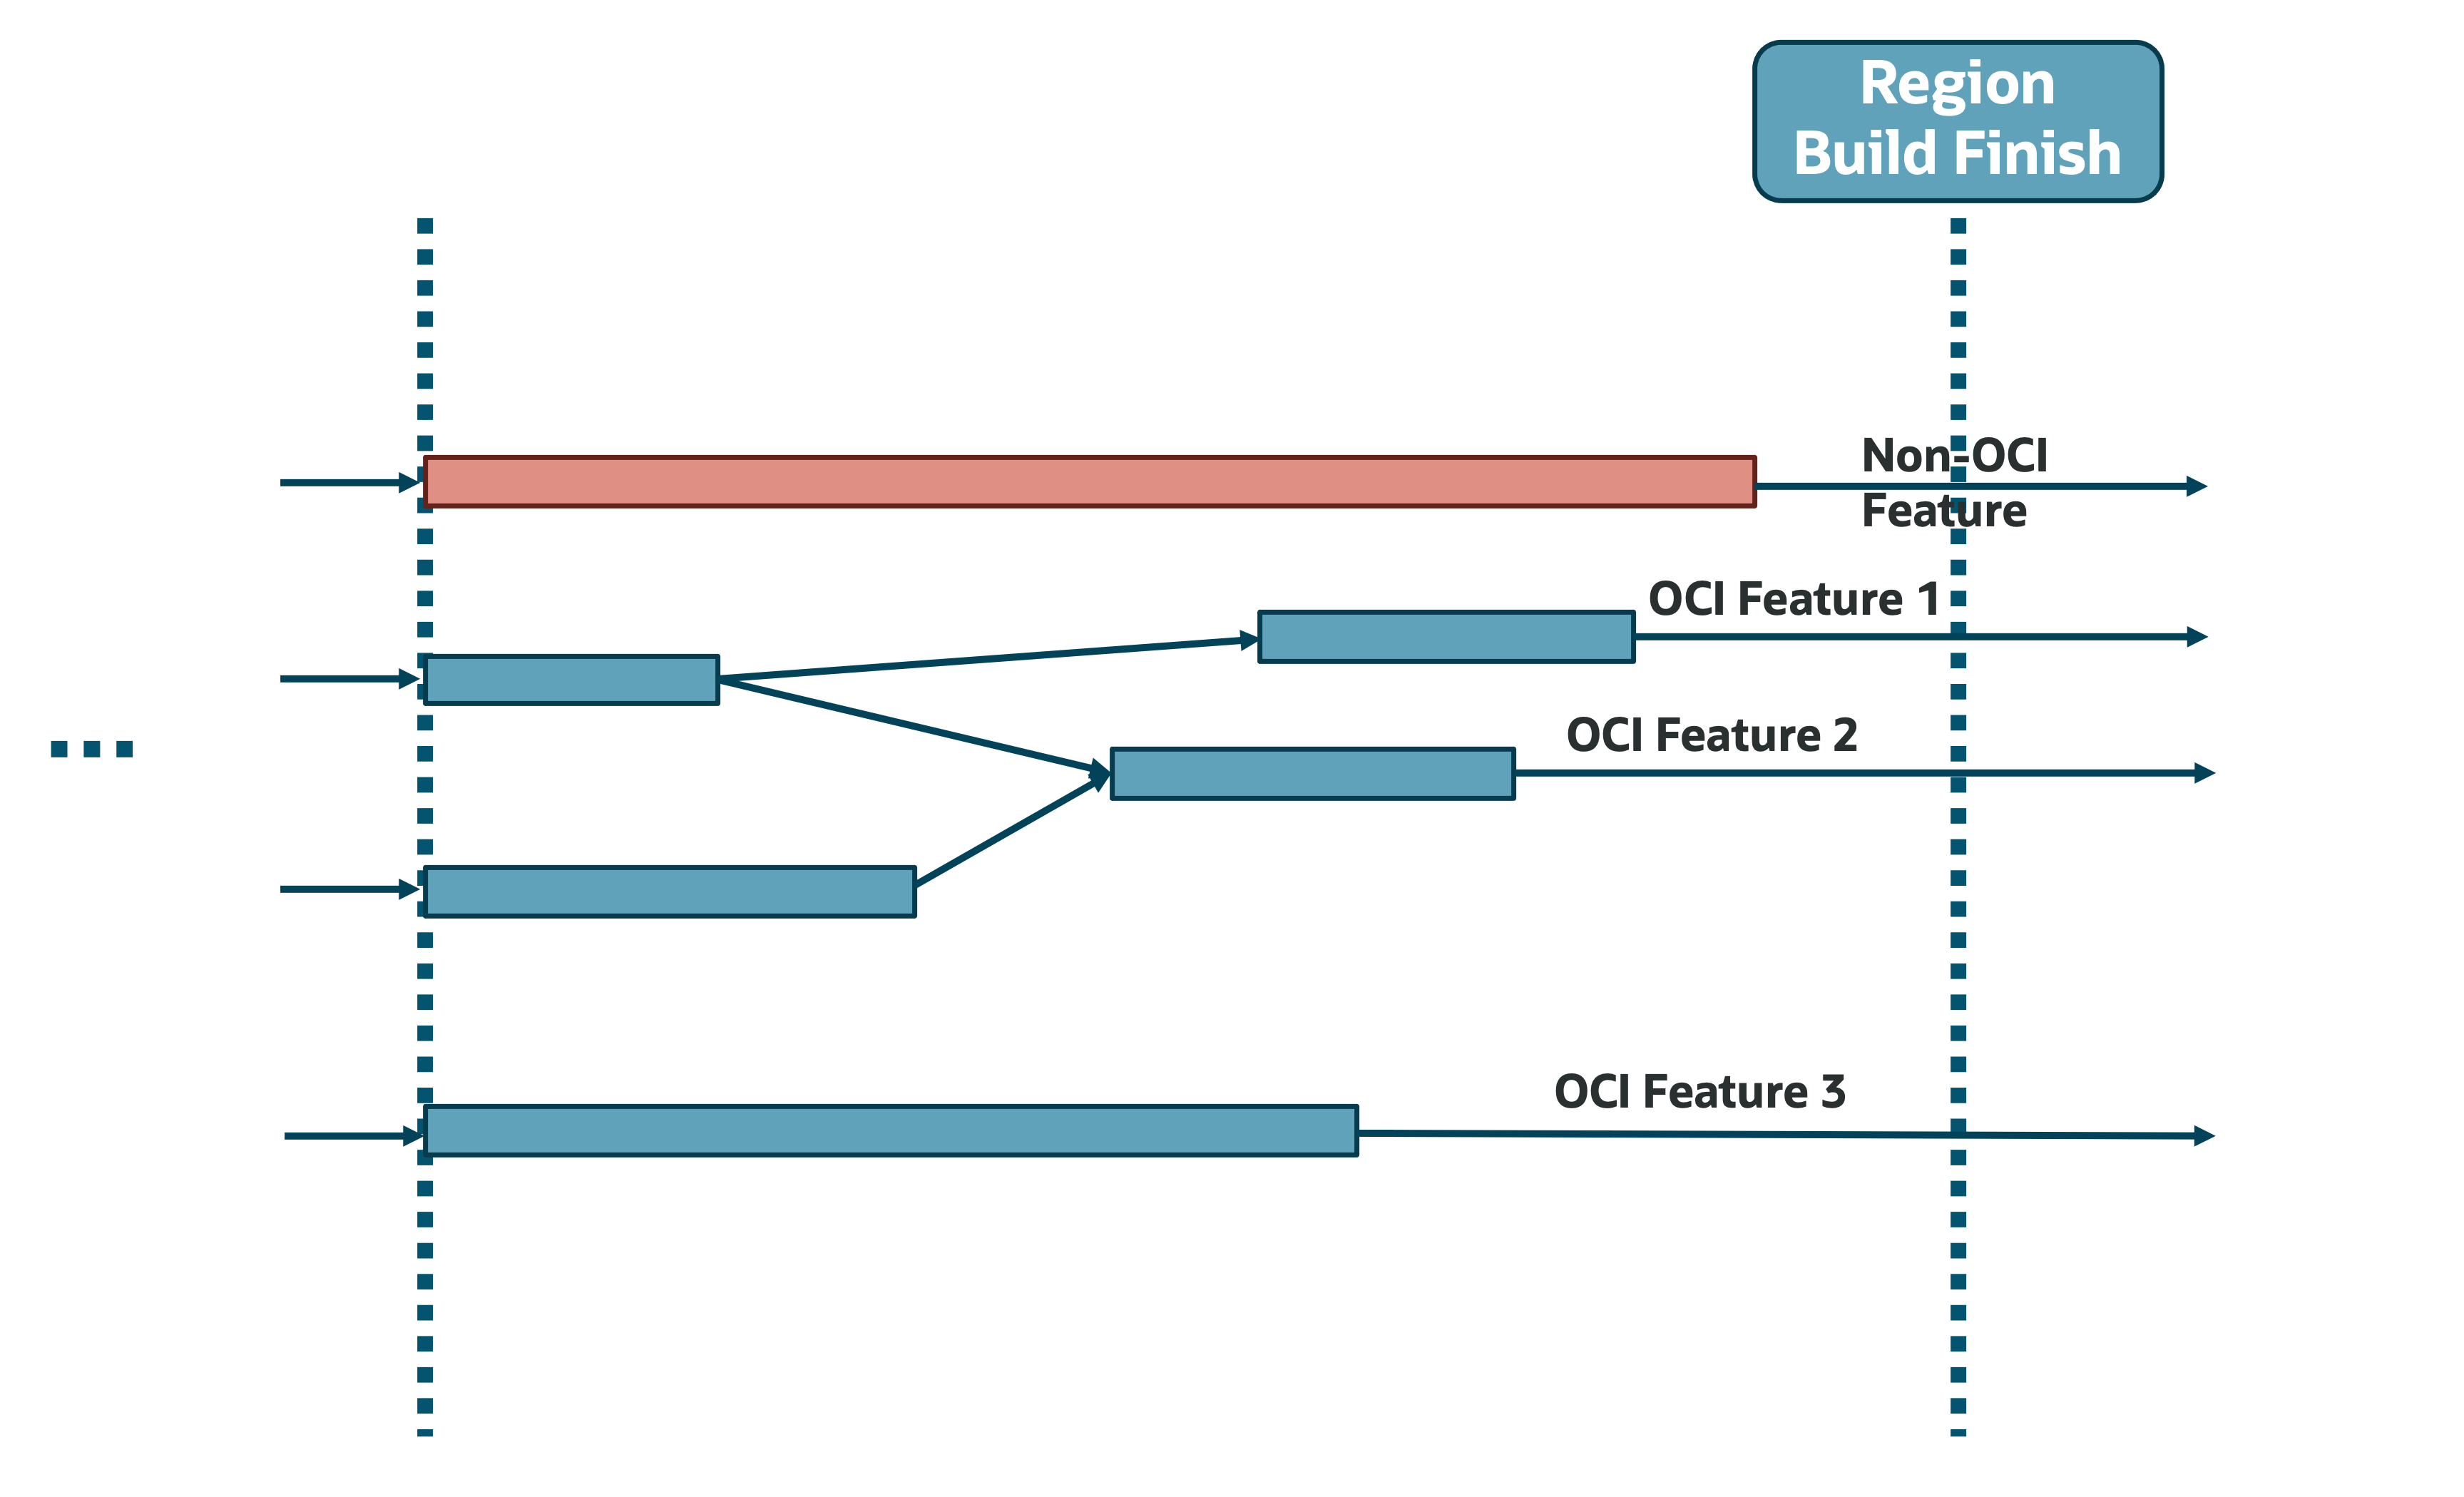
Figure 2: Snapshot of Non-OCI features unnecessarily extending the DAG Region Build timeline
As seen in the illustration, the last activity before the region is considered ready was for a built-on-OCI service (not OCI itself). The latest activity does not belong to our business domain, even though it’s in the DAG. This can obscure a significant part of the actual region build activities, especially if something goes wrong with deployment or if a deployment takes a long time. In some cases, non-relevant parts contributed to around 50% of the overall critical path when calculated naively. The good news is that such data cleansing issues are standard in data engineering and can be readily addressed. The downside is we don’t have a static list of features to remove, as OCI continually adds new services and updates existing ones, so the list keeps changing.
Feasibility
After the initial data was presented, some teams noted that although their time on the critical path was significant, there wasn’t much they could do about it. These teams work with real hardware, and each region includes many components (switches, servers). Every server must go through procedures to help ensure that all firmware and the operating system have the required security patches and pass additional testing. We cannot reduce the time for these activities. Thus, while we could identify teams taking significant time in the region build, we often couldn’t reduce that time. The lesson: we need to find critical path segments that both contribute time and have potential for improvement.
Even so, there was room for improvement. By analyzing different regions, we discovered that in some cases, these teams took 4x longer than others. Upon investigation, we found this was due to hardware problems—often cabling issues (which, from a service perspective, are classified as hardware problems). If we increase the likelihood that these teams have a “happy path,” we can significantly reduce build time. Service teams should create small scripts to perform basic hardware validation before starting the region build. Such scripts could be run to detect basic issues beforehand and provide grouped output to Data Centre Operations, who can then address issues rack-by-rack, instead of resolving them during hardware ingestion at random times (possibly in the middle of the night with a reduced staff). However, as is often the case with cloud infrastructure, this creates a chicken-and-egg problem—we need a service to test hardware before any services are built, making implementation reasonably complex.
Determining the right actor
After cleaning the data, removing unrelated services, and marking those for which optimization is not feasible, we discovered that a significant portion of the critical path was due to issues or waiting for their resolution. We could infer this from our DAG knowledge—if a deployment should publish a feature required by other services, any deployment issue and the elapsed time until a successful retry is considered “waiting for a fix,” as it blocks progress. I wish I could say we never have deployment issues, but that’s not true. Most deployments succeed, but when issues arise, human intervention is needed, increasing the likelihood that the issue appears on the critical path (automation works 24/7, while people may need time to diagnose and resolve problems).
When an OCI region is fully built, it can tolerate many failures and still serve customers without interruption (while root cause analysis and fixes are underway). During the region build, however, services are not fully deployed or only partially functional to avoid circular dependencies. A failure at runtime (such as a compute node going down) won’t interrupt service, but if this happens during deployment (e.g., failed to provision a resource or deploy one of three instances), the deployment sequence stops and the feature won’t be published. Although the service might continue with reduced capacity, the failed deployment blocks further progress. This is by design—the deployment system doesn’t know whether the service can function with only two out of three instances. Some of these issues are not related to OCI at all.
For example, in one region, our connection to the Data Centre was lost due to a fiber cable cut on the ISP’s side. Most OCI regions have a backup ISP in production, but during region construction, the network is not fully set up, and our ability to tolerate failures is limited. The only option was to wait for the ISP to fix the issue, with that waiting time adding to the region build. This reminded me of a similar experience working for an ISP networking team: an excavator once severed the fiber optic cable between two cities (populations 5M+ and 10M+). When I asked about a backup channel, I was told it existed—unfortunately, the backup fiber was in the same cable (each cable contains multiple fibers). Who knew this could happen? In cloud-scale services, seemingly impossible things happen twice a year—so always be prepared. Excavators are as dangerous to networks as they were 20 years ago.
Aside from excavators, there’s another problem: how do we know which team is responsible for a failure, so we can collaborate on long-term solutions? The first thought was to assign responsibility to the team with the failed deployment. But that’s often not correct. If a team needs to provision new infrastructure and another service prevents that, the team isn’t at fault. Should we track failures for each infrastructure component during provisioning and consider the requesting service responsible? Even with this approach, we can’t reliably determine root causes. Here are a few real-life conversations with service teams:
Example 1: Service one tried to provision a resource managed by Service two. We asked Service two for a root cause analysis (RCA) and a fix, but Service two found the issue stemmed from an issue in their dependent Service three. So, the root cause laid with Service three, even though there was no direct dependency with Service one.
Example 2: Another Service one tried to provision a resource in Service two, which had an issue. Service two fixed it by deploying a new version, but on further inquiry, they said the real cause was Service one not providing required capacity data, which led to unexpected requests that the previous version couldn’t handle. So, although it looked like Service two’s fault, the real issue was with Service one.
As these examples show, it’s extremely difficult—if not impossible—for the region build team to determine all root causes. Yet, this information is crucial for avoiding repeat failures in new regions. Since we cannot determine this ourselves, we now request service teams to provide RCA for each issue during the region build. This RCA is already a part of standard issue mitigation (since the issue can’t be fixed without understanding the root cause); we only needed to document these findings in a format consumable by automation.
Conclusion
Data analysis is a very complex topic. Although there are standard stages (ingestion, cleansing, curation), each use case is unique. To get the most from your data, you must understand it deeply and focus on the high-level goal of the analysis. As shown above, we applied domain knowledge at nearly every step to improve our data analysis. Don’t be afraid to get creative—even in well-known areas like graph analysis, you’ll find functionality not covered by existing libraries.
This analysis has helped region build to constantly improve. Based on Pareto principle each additional improvement requires more effort…At some point the ROI would not worth it. Alternatively, we would eventually hit a threshold where further optimization using current design would be almost impossible (there are some physical limitations like speed of light or CPU frequency which we can’t change). We are very close to this threshold but there are still some small improvements to be made (without a significant redesign of the way we build regions). There is also additional work to be done on the Region Build Platform side—we recently switched to the second version of the Orchestration Engine, and we’re working on improving different aspects of automation, observability, and testing region build activities (this topic deserves a separate post).
Lastly, our release of Dedicated Region 25, which offers customers the full power of OCI cloud in just 3 racks, brought many structural changes internally. This project triggered the biggest OCI redesign in the history, starting from the hardware layer and Data Centre physical design and went up to the very top of the stack. This is an example of a large restructuring of the region build DAG, which reminds us that it’s constantly changing and we should adapt to those changes. There are lots of new interesting things going on in OCI so stay tuned!
This blog series highlights the new projects, challenges, and problem-solving OCI engineers are facing in the journey to deliver superior cloud products. You can find similar OCI engineering deep dives as part of Behind the Scenes with OCI Engineering series, featuring talented engineers working across Oracle Cloud Infrastructure.