
Overview
Many database users finish their analysis in a spreadsheet. Peak Gear store-sales data is most useful when transactions, products, and store locations are considered together. The Oracle Autonomous Database add-on brings that work directly into Google Sheets: you can connect to an Autonomous AI Database, run SQL joins, place the results in a worksheet, and continue with familiar Google Sheets features such as pivot tables, formulas, charts, and conditional formatting.
The add-on is available from Google Workspace Marketplace. You install the add-on once from the Marketplace, then download a connection file from your Autonomous Database instance and import it into the add-on. No Oracle client software or database wallet installation is required for this workflow.
In this post, we will:
- Install the add-on from Google Workspace Marketplace.
- Download a Google Sheets connection file from Database Actions.
- Import the file and connect to Autonomous Database.
- Join Peak Gear store-sales, product, and store-location data with the Direct SQL panel.
- Use the Data Analysis panel to create a revenue pivot and a location-filtered chart.
The queries in this example only read data. Their results are copied into the Google Sheet, where you can analyze and format them without changing the source tables.
Before you begin
You need:
- A Google account that can install apps from Google Workspace Marketplace.
- Access to Google Sheets in a desktop web browser.
- Access to an Oracle Autonomous AI Database instance and its Database Actions interface.
- Database Web Access enabled for the instance.
- A database user that can access the deployed Peak Gear tables and download a spreadsheet connection file.
Your organization’s Google Workspace administrator might restrict Marketplace installations. If the installation option is unavailable, ask the administrator to allow or install the Oracle Autonomous Database add-on.
Install the add-on from Google Workspace Marketplace
- Open a new or existing Google Sheet.
- Select Extensions, then Add-ons, and then Get add-ons.
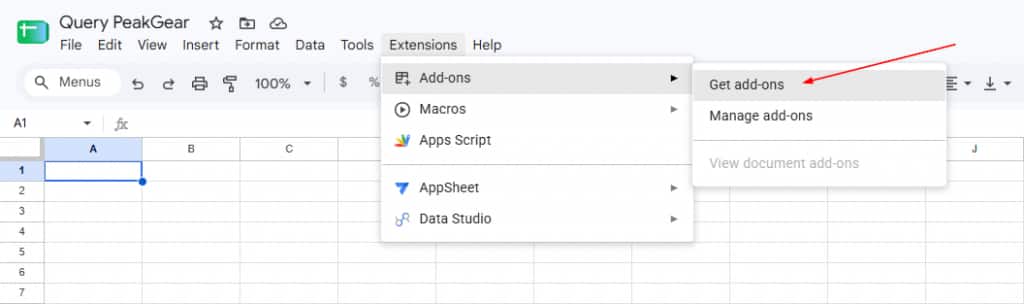
- In Google Workspace Marketplace, search for Oracle Autonomous Database.
- Select the add-on published by Oracle, and click Install.
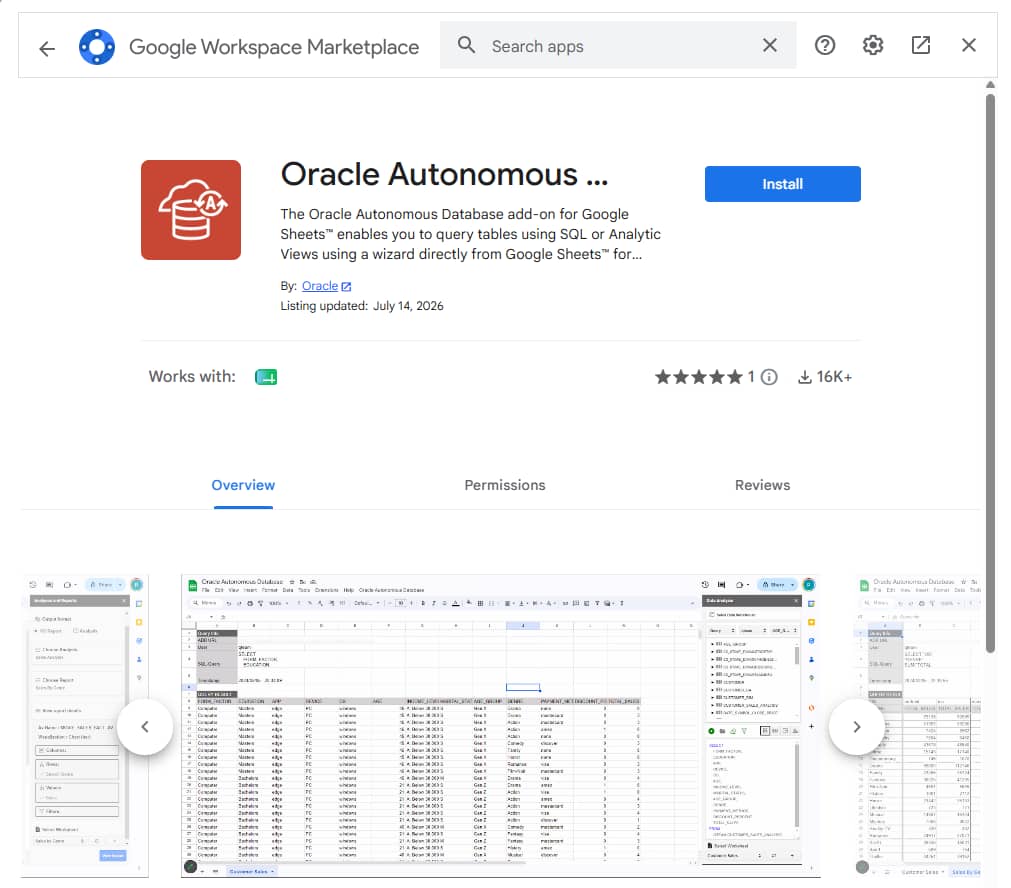
- Review the terms, privacy information, and permissions requested by the add-on. Click Continue if you accept them.
- Return to Google Sheets after the installation-complete message appears. If the new menu is not visible immediately, reload the sheet.
- Open Extensions and confirm that Oracle Autonomous Database is present.
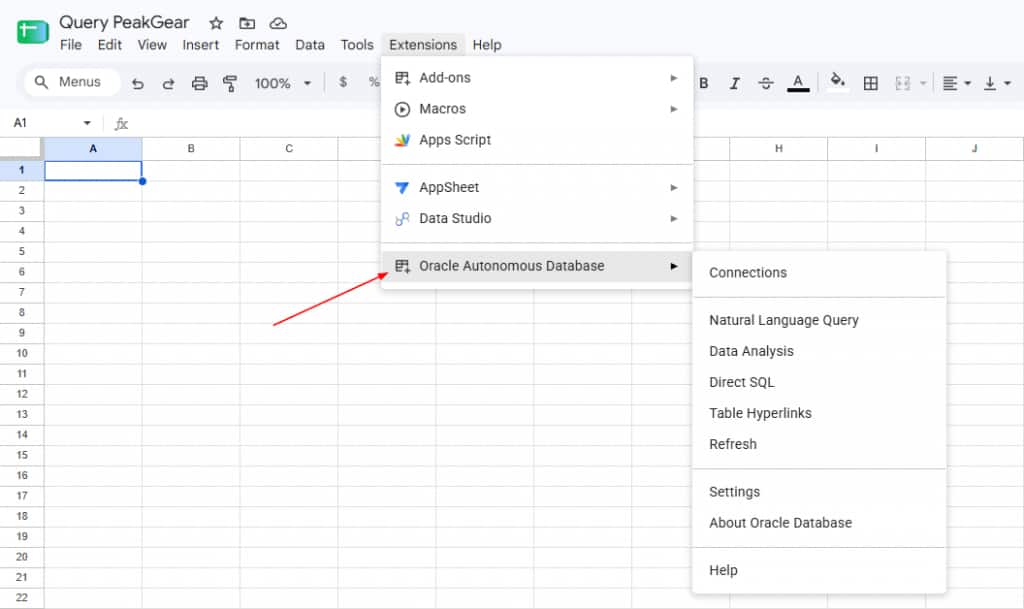
For the latest installation details, see Install the add-on from Google Workspace Marketplace.
Download a connection file from Autonomous Database
The Marketplace package supplies the add-on itself. The connection information comes from the Autonomous Database instance that you want to query.
- Sign in to Database Actions as the database user who will run the queries.
- From the Database Actions launchpad, open the Downloads tab.
- Under Download Microsoft Excel/Google Sheets add-in, click Download.
- Select the Google Sheets tab.
- Click Download Connection File.
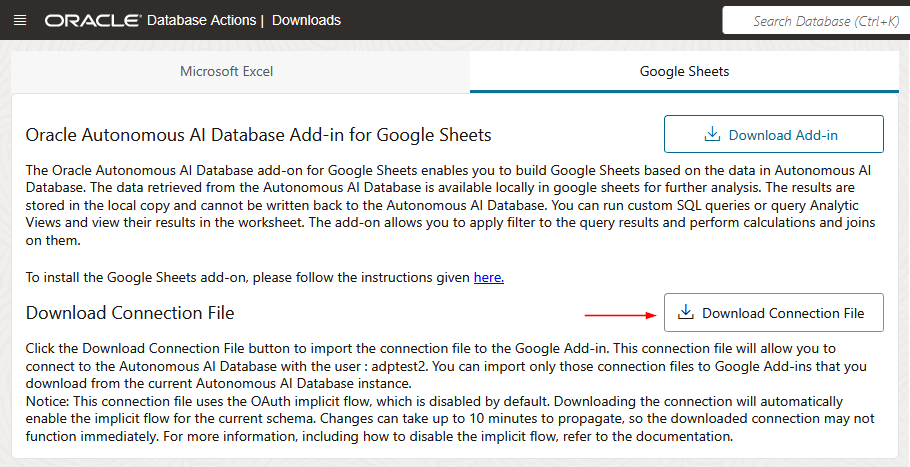
The browser downloads a JSON connection file, usually to the local Downloads folder. Treat this file as sensitive configuration: do not edit it, paste its contents into a sheet, or share it publicly. The connection file is generated for the database instance and database user. If an older connection file no longer works, download a new one instead of trying to repair the JSON manually.
Notice
When downloading a connection file for the first time, it might take up to 10 minutes until it can be used.
Import the connection and sign in
- Return to Google Sheets.
- Select Extensions, Oracle Autonomous Database, and then Connections.
- If this is the first time you have opened the panel, complete the welcome screen by clicking Get Started.
- In the Connections panel, click Manage Connections, then select Import Connection.
- Drag and drop the connection file to the drop zone. You can also click the drop zone and select the connection file with the file explorer or Finder.
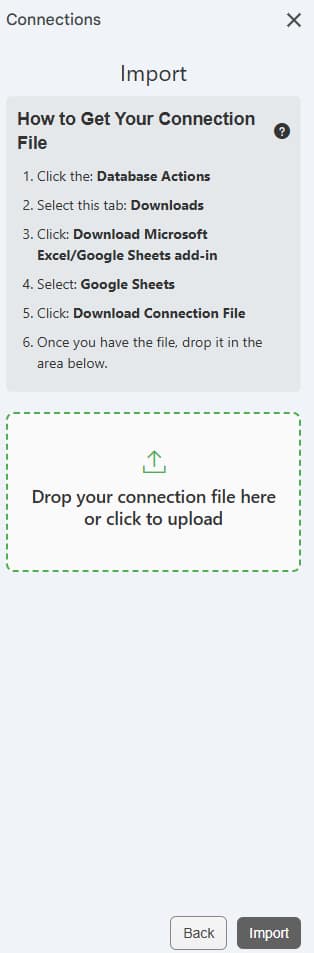
- Select the connection displayed in the import list and click Import.
- On the connection card, open the three-dot menu and select Connect.
- Complete the Oracle sign-in window with your database credentials.
After authentication succeeds, the connection card shows a green connected indicator and is marked as the active connection. The add-on can keep multiple saved or connected databases, but only one connection is active for a feature at a time.
Tip
Before connecting, you can edit the connection name. In this example, the connection is named PeakGear.
Connections expire after an hour. If a feature reports that you are disconnected, reopen Connections and reconnect. See Manage Connections for details about importing, connecting, activating, and exporting connections.
Query Peak Gear store sales with Direct SQL
The Direct SQL panel lets you write and run SQL without leaving Google Sheets. In this example, we run a simple query to get the content of the PRODUCTS table.
Example 1: Retrieve table content
- Select Extensions, Oracle Autonomous Database, and then Direct SQL.
- Drag the
PRODUCTStable to the query editor. The add-on fills the editor with aSELECTquery; for this example, use the following SQL:
SQLSELECT
    PRODUCT_ID,
    PRODUCT_NAME,
    CATEGORY,
    COST_PRICE,
    RETAIL_PRICE,
    SKU
FROM
PRODUCTS;- Under Select worksheet, click the plus (+) button.
- Enter
PeakGear_Productsas the worksheet name and confirm it with the check-mark button. - Click Execute.
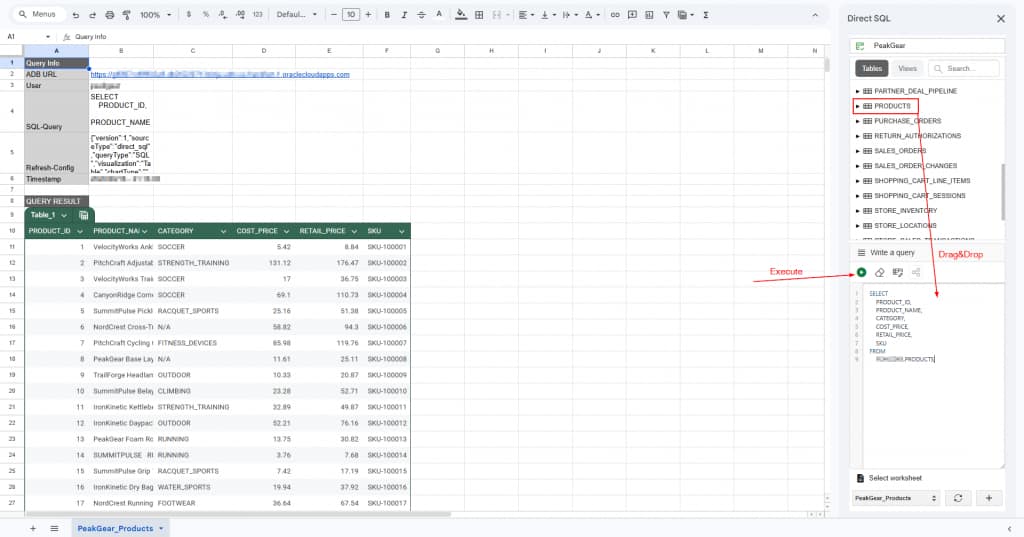
PRODUCTS table populates the query editor and writes the results to PeakGear_Products.The add-on retrieves query results in pages of up to 10,000 rows. If more data is available, it displays a message explaining that the first 10,000 rows are shown and asks whether you want to retrieve the entire result set. Select Yes when you need all rows. The add-on fetches and appends the remaining data in additional 10,000-row pages, and the progress message includes an option to stop fetching (at the top area of the panel).
For a complete export or an analysis that must represent the entire table, allow pagination to finish before using the worksheet. For exploratory work, a filtered query is usually faster and transfers less data.
The add-on writes query information near the top of the selected worksheet and places the column headers and result rows below it.
Example 2: Summarize revenue by location and category
In this example, STORE_SALES_TRANSACTIONS supplies the sales facts, PRODUCTS supplies product details, and STORE_LOCATIONS supplies location attributes. The joins use the verified PRODUCT_ID and STORE_ID relationships.
Replace the SQL in the editor with this grouped query:
SQLSELECT
    sl.location,
    p.category,
    COUNT(*) AS transaction_count,
    SUM(st.qty_sold) AS units_sold,
    ROUND(SUM(st.total_sale_amount), 2) AS sales_revenue
FROM
    store_sales_transactions st
    JOIN products p
        ON p.product_id = st.product_id
    JOIN store_locations sl
        ON sl.store_id = st.store_id
GROUP BY
    sl.location,
    p.category
ORDER BY
    sales_revenue DESC;
Create or select a worksheet named PeakGear_Revenue_By_Category, then click Execute.
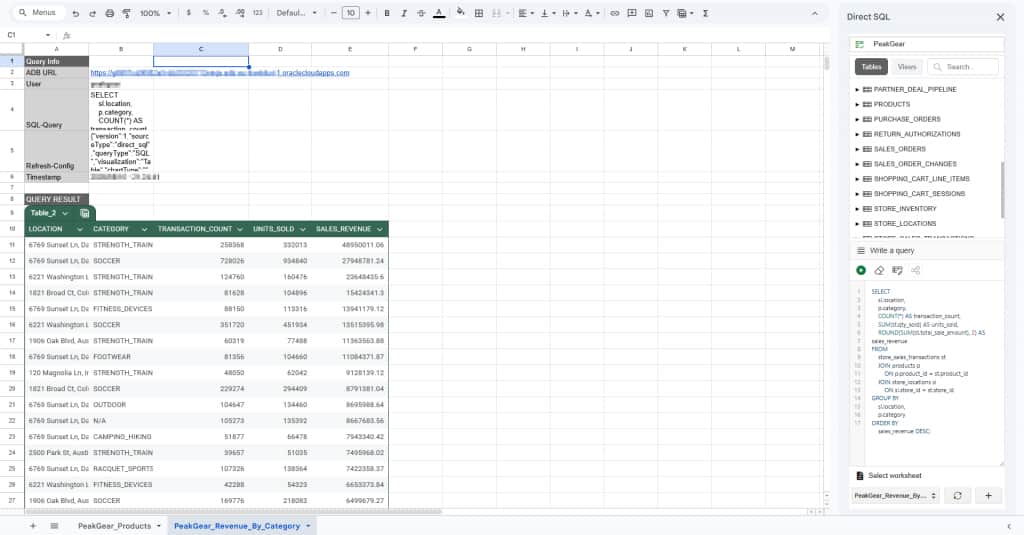
The database performs the joins and aggregation before the result is sent to Google Sheets. The worksheet therefore contains one row per location and category combination rather than every underlying transaction.
For more information about the query editor, object browser, output worksheets, and large-result handling, see Run Direct SQL Queries.
Analyze Peak Gear store sales with the Data Analysis panel
The Data Analysis panel provides a drag-and-drop interface for building table, pivot, and chart results. Use the joined detail query as the base query so that the visualizations can use product categories and store locations together.
For both examples below:
- Select Extensions, Oracle Autonomous Database, and then Data Analysis.
- Expand Base Query and keep Table selected as the analysis type.
- Enter this base query in the SQL editor:
SQLSELECT
    sl.location,
    sl.store_type,
    p.category,
    st.qty_sold,
    st.total_sale_amount
FROM
    store_sales_transactions st
    JOIN products p
        ON p.product_id = st.product_id
    JOIN store_locations sl
        ON sl.store_id = st.store_id;
Example 1: Compare revenue with a pivot
- Expand Visualization and select Pivot.
- Drag the fields into these areas:
- Columns:
LOCATION - Rows:
CATEGORY - Values:
TOTAL_SALE_AMOUNT
- Columns:
- Click
TOTAL_SALE_AMOUNTunder Values and select the Sum aggregation. - Select or create an output worksheet named
PeakGear_Revenue_Pivot. - Click Run in the Visualization section.
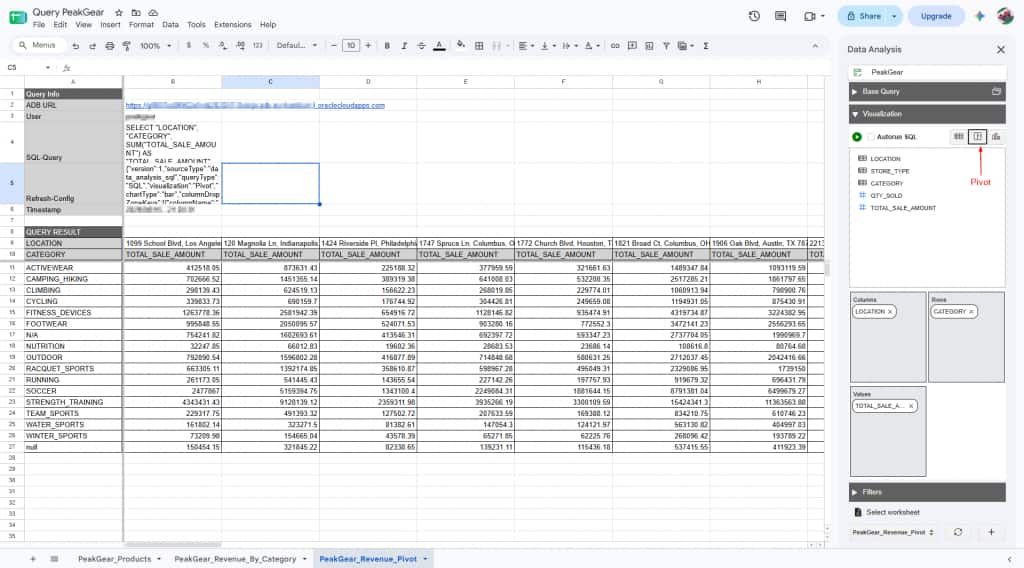
LOCATION in Columns, CATEGORY in Rows, and total sales amount in Values.The pivot shows product categories as rows and locations as columns. Each cell contains the total sales revenue for that location and category combination.
Example 2: Create a location-filtered chart
Next, create a chart that compares product-category revenue for one store location.
- In Visualization, select Chart.
- Select Bar Chart and keep the Vertical orientation.
- Drag the fields into these areas:
- X-Axis:
CATEGORY - Values (Y-Axis):
TOTAL_SALE_AMOUNT
- X-Axis:
- Click
TOTAL_SALE_AMOUNTunder Values (Y-Axis) and select the Sum aggregation. - Expand Filters. Locate the
LOCATIONfacet and select one location available in your deployed Peak Gear data. - Select or create an output worksheet named
PeakGear_Location_Revenue. - Click Run. If Autorun SQL is enabled, the chart updates automatically when you select the filter or drag fields to areas.
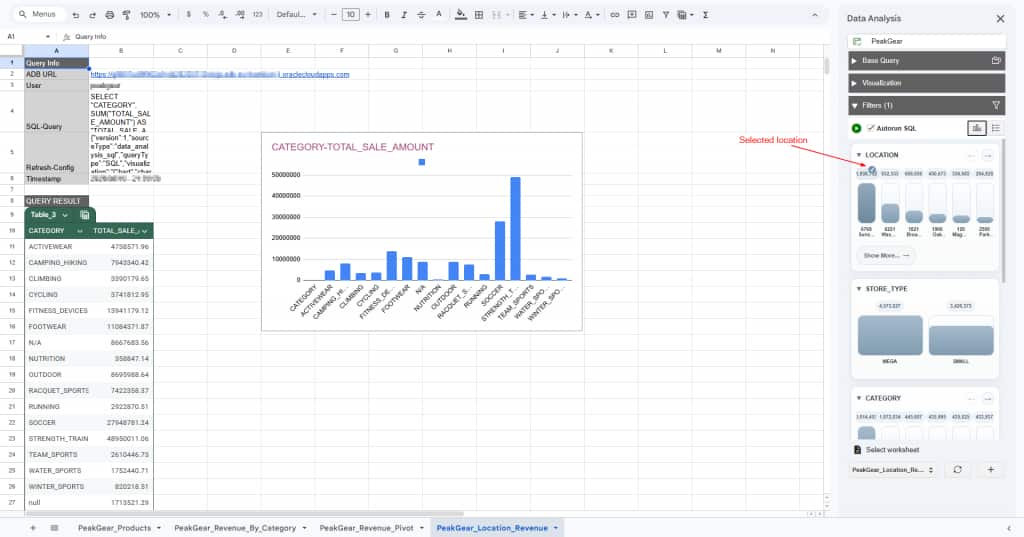
LOCATION filter selected.The filter count shown in the panel confirms that a filter is active. You can select additional locations to broaden the result or clear the selection to return to all locations.
For more information about base queries, visualizations, aggregations, and faceted filters, see Perform Data Analysis using Spreadsheet Add-ins.
Conclusion
The Oracle Autonomous Database add-on makes Google Sheets a convenient analysis surface for Peak Gear store-sales data. Installation is handled through Google Workspace Marketplace, while a connection file downloaded from the database instance supplies the information needed to authenticate securely.
In this walkthrough, we used Direct SQL to join store sales to product and location data, then summarized revenue by location and category. We used the same joined data in the Data Analysis panel to create a revenue pivot and a location-filtered chart. These workflows let you move from related database tables to focused analysis without leaving Google Sheets.