Introduction
Welcome to Part 5 of the blog series – Unlocking Custom Visualizations in Oracle Analytics. This series is designed to help you develop your own custom extensions. Each article covers a specific stage of the development process, enabling you to create an interactive bar chart custom extension. The knowledge you gain from this series can help you to build other visualizations like table, line chart, and more.
Before moving forward, here’s a quick recap of the topics covered so far in the blog series:
Part 1: Setting up the foundational extension structure and understanding its directory and files
Part 2: Rendering a basic bar chart visualization using hard-coded values
Part 3: Configuring the grammar panel
Part 4: Implementing data models and mapping layers
This article focuses on integrating external data sources with your custom extension. Building upon the Part 2 implementation, where a bar chart was rendered using hard-coded values, in this article, you’ll replace that data with dynamic data sources, ensuring the visualization updates based on live data.
Expected Outcome
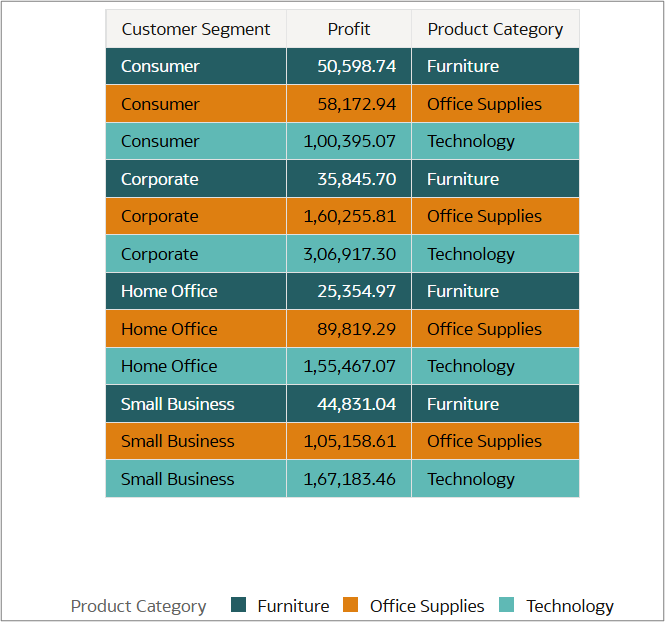
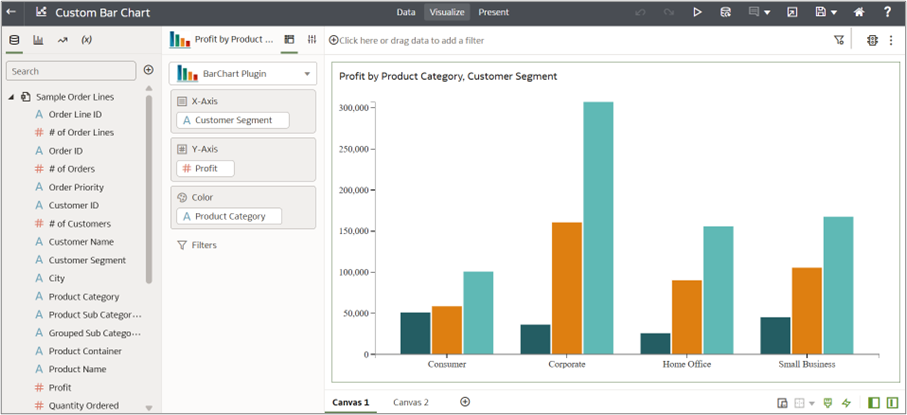
By the end of this article, you’ll have a dynamic bar chart integrated to a Sample Order Lines dataset. The chart will display Customer Segment on the x-axis, Profit on the y-axis, and colors representing different Product Categories.

About the Sample Order Lines Dataset
The Sample Order Lines dataset contains order line details, including order IDs, customer information, product categories, sales figures, and shipping details. It tracks customer segments, cities, order priorities, and product types, along with financial metrics such as profit, discounts, and shipping costs. The dataset also includes order and ship dates, allowing for analysis of logistics and sales trends. It’s useful for evaluating customer purchasing behavior, product performance, and overall business profitability.
Selected Data in Tabular Form
Understanding the _generateData Function
You can use the _generateData function to integrate external data sources. This function is responsible for extracting data from input data sources and structuring it to meet a visualization’s data requirements. It processes row-based data, assigns colors, and formats the data into an output map, which is later utilized in the render function to replace hard-coded values.
What does _generateData() do?
- Extracts key data properties such as measures, rows, color, data models, and layer information
- Processes data using loops and logical conditions to categorize different components (e.g., x-axis values, colors, and measure values)
- Structures the data in an array (dataMap), which is then used to render the visualization
Breaking Down the _generateData Function
1. Initial Setup – Fetching Data Models of the Visualization
var oDataModel = this.getRootDataModel();

if(!oDataModel || !oDataLayout){

    return;

}
This function retrieves the necessary data model from the visualization to ensure the selected dataset is available for processing.
2. Retrieving Key Data Properties
var aAllMeasures = oDataModel.getColumnIDsIn(datamodelshapes.Physical.DATA);

var nRows = oDataLayout.getEdgeExtent(datamodelshapes.Physical.ROW);

var nRowLayerCount = oDataLayout.getLayerCount(datamodelshapes.Physical.ROW);

var oDataLayoutHelper = oTransientRenderingContext.get(dataviz.DataContextProperty.DATA_LAYOUT_HELPER);

var oColorContext = this.getColorContext(oTransientRenderingContext);

var oColorInterpolator = this.getCachedColorInterpolator(oTransientRenderingContext, datamodelshapes.Logical.COLOR);
- aAllmeasures àRetrieves the selected measure column name (e.g., Profit)
- nRows àFetches the total number of rows in the selected dataset
- nRowLayerCount àRetrieves the number of layers
- oDataLayoutHelper àManages layout properties and mapping relationships, extracting transient rendering context properties
- oColorContext & oColorInterpolator àUsed to retrieve color-related details
3. Extracting Row-Level Data
for(var nRow = 0; nRow < nRowLayerCount-1; nRow++){

    var rowKey = oDataLayoutHelper.getLogicalEdgeName(datamodelshapes.Physical.ROW, nRow);

    var displayName = oDataLayout.getLayerMetadata(datamodelshapes.Physical.ROW, nRow, data.LayerMetadata.LAYER_DISPLAY_NAME);

}
A loop iterates through row layers to extract:
- rowKey àIdentifies the logical name of each row layer (e.g., row or color)
- displayName àRetrieves the display column names such as Customer Segment when rowKey is row and Product Category when rowKey is color
4. Initializing Output Variables & Iterating Through Rows
var dataMap = [];

var xAxis, color_hash, color_series;

for(var nRow = 0; nRow < Math.max(nRows, 1); nRow++) {

    var colorObj, color = "", tooltip, row="";

    var value = parseFloat(oDataLayout.getValue(datamodelshapes.Physical.DATA, nRow, 0));
- dataMap = [ ] àStores the final structured data
- value àExtracts row-wise numeric values from the dataset
5. Processing Each Row & Handling Data Assignment
for (var nRowLayer = 0; nRowLayer < Math.max(nRowLayerCount, 1); nRowLayer++) {

    var rowType = oDataLayoutHelper.getLogicalEdgeName(datamodelshapes.Physical.ROW, nRowLayer);

    switch (rowType) {

        case "row":

            xAxis = row !== ""

                ? row + ", " + oDataLayout.getValue(datamodelshapes.Physical.ROW, nRowLayer, nRow, false)

                : oDataLayout.getValue(datamodelshapes.Physical.ROW, nRowLayer, nRow, false);

            break;

        case "color":

            colorObj = this.getDataItemColorInfo(oDataLayoutHelper, oColorContext, oColorInterpolator, nRow, 0);

            color_hash = colorObj.sColor;

            color_series = colorObj.sSeriesColorLabel;

            break;

    }

}
As the loop iterates through row layers:
- If the rowType represents an x-axis category (row), the value is assigned to xAxis (e.g., Consumer).
- If the row represents a color dimension (color), color properties are retrieved:
-
Color_hash — Extracts the hex color code from the visualization’s color palette
-
Color_series — Stores labels for Product Categories (e.g., Furniture)
-
6. Constructing & Storing the Output Data
Var generatedData = [];

generatedData = { year: xAxis, sale: value, color_series: color_series, color: color_hash, row: nRow };

dataMap.push(generatedData);
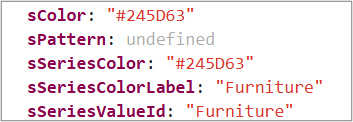
An object (generateData) is created with structured data, mapping values as follows:
![]()
- Year àCustomer Segment assigned to the x-axis
- Sale àProfit for the respective segment and category
- Color_series àProduct Category labels
- Color àHex color code for each product category
- Row àRow index
Note: The variables year, scale, color_series, color, and row are user defined. You can change them if needed.
The object is pushed to dataMap, which accumulates all formatted data.
7. Returning the Final Output
return dataMap;
dataMap result:
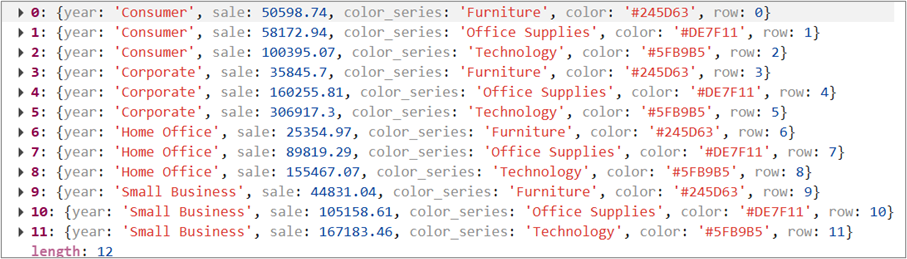
The function returns dataMap, making the processed data available for use in the render function. This ensures that the visualization dynamically updates based on the connected dataset.
Enhancing the Render Function: Replacing Hard-coded Data with _generateData()
Previously, in Part 2, the bar chart was created using a manually defined dataset:
function bar(data) {

      var chartConfig = {

        barWidth: 20,

        data: [

          { "sale": "202", "year": "2000" },

          { "sale": "215", "year": "2001" },

        …  { "sale": "176", "year": "2010" }

        ]

      };

}
This static approach limits flexibility and real-time updates.
The Dynamic Approach: Fetching Data via _generateData()
Now, instead of manually defining data, _generateData() dynamically extracts it from the visualization’s data model. The render function is updated as follows:
BarChart.prototype.render = function(oTransientRenderingContext) {

    try {

        var oDataLayout = oTransientRenderingContext.get(dataviz.DataContextProperty.DATA_LAYOUT);

        var oData = this._generateData(oDataLayout, oTransientRenderingContext);

        if (!oData) {

            return;

        }

        var elContainer = this.getContainerElem();

        bar(oData);

        function bar(data) {

            var chartConfig = {

                barWidth: 20,

                data: oData

            };

            var htmlContent = "<div class='barcharttest' id='barcharttest'></div>";

            $(elContainer).html(htmlContent);

        }

    }

};
Breaking It Down Step-by-Step
1. Fetching the Transient Rendering Context
var oDataLayout = oTransientRenderingContext.get(dataviz.DataContextProperty.DATA_LAYOUT);
It retrieves the data layout containing attributes, measures, and layers.
2. Generating Data Dynamically
var oData = this._generateData(oDataLayout, oTransientRenderingContext);
It calls the _generateData function to extract actual data from the visualization.
3. Rendering the Chart Dynamically
bar(oData);
It passes the generated data to the bar function, ensuring real-time updates.
This approach makes the extension flexible and scalable, as it dynamically updates whenever new data is provided.
Final Output
Summary
Integrating data sources into custom visualizations allows seamless interaction with real-time data. The _generateData function is crucial in dynamically retrieving, structuring, and preparing data for visualization. Instead of relying on hard-coded values, it extracts live data from Oracle Analytics and formats it into a structured output, making custom extensions more powerful and adaptable.
By following these steps, your custom bar chart extension now works with real-time data, bringing you closer to creating highly interactive visualizations.
Call to Action
Discover the Custom Extensions Library to enhance your visualization capabilities — download, explore, and implement ready-to-use extensions to elevate your dashboards.
Join the Oracle Analytics Community today to connect with peers, share your ideas, and stay ahead in the world of data visualization.