Oracle Analytics provides a variety of dynamic custom plug-ins available for download from the extensions library. Once you select a plug-in, you can import it into Oracle Analytics with ease. If you’re unfamiliar with the import process, read this article to learn more. You can also create custom plug-ins for personal use or share them with the broader Oracle Analytics Community.
This blog series provides a step-by-step guide for creating custom plug-ins, designed to empower you to design your own from the ground up. Each article in the series is structured to bring you closer to developing a feature-rich, innovative plug-in.
This introductory article covers the essentials including exploring core visualization types, creating a foundational plug-in structure, and familiarizing yourself with the plug-in directory and files.
As the series progresses, you’ll delve into rendering charts, connecting plug-ins to data sources, setting up the grammar panels, and configuring plug-in properties. You’ll also explore interactive features such as brushing, marking, tooltips, and legends that unlock the full potential of custom plug-ins.
Before you explore plug-in development, review or gather these prerequisite resources:
- About the Oracle Analytics Extension Development Environment
- Create Oracle Analytics Cloud Custom Plug-ins For Your Dashboard
- A source-code editor, such as Visual Studio Code, for editing plug-in code
As a hands-on example, this series guides you through creating a custom Dataviz Bar Chart plug-in with D3js. D3 is an open-source JavaScript library that enables data-driven, interactive visualizations, which is ideal for building custom visualizations.
Although Oracle Analytics includes a bar chart as a prebuilt visualization, it’s used as an example only for simplicity and clarity.
Dataviz and Embeddable Visualizations
Before you begin, install Oracle Analytics Desktop (OAD), and configure your development environment. Next, decide on the type of visualization plug-in you want to build. There are two main types: Dataviz and Embeddable Dataviz.
1. Dataviz: This type doesn’t support trellis rows and columns. To create a Dataviz plug-in, use these commands:
cd $PLUGIN_DEV_DIR
bicreateplugin viz -id <YourVizName> -subType dataviz
.\gradlew run
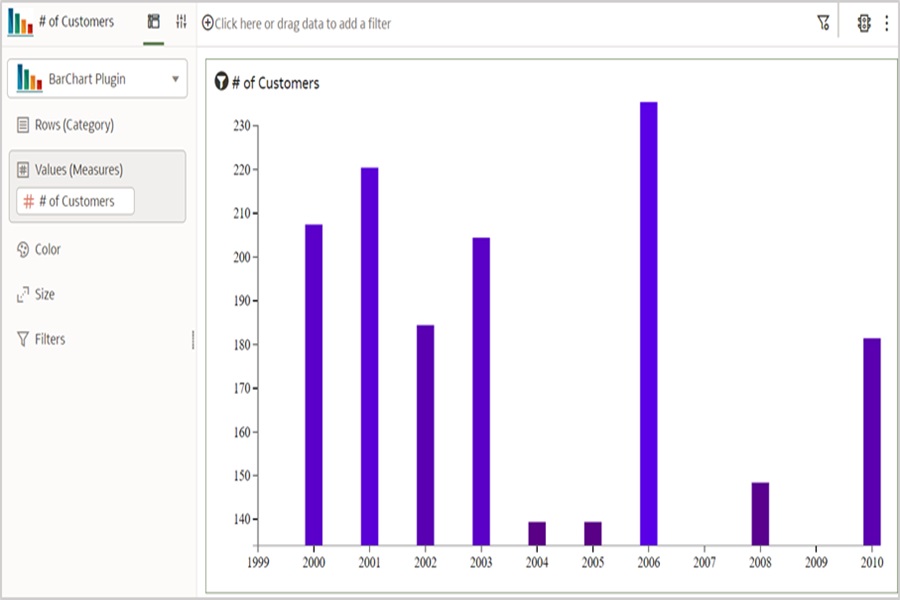
Fig 1: Dataviz plug-in
2. Embeddable Dataviz: This type includes trellis rows and columns. A trellis is a grid of charts displaying a matrix of measures across multiple dimensions. Each cell in the matrix contains a micro chart, showing various visualizations on a single canvas. To create an embeddable (or trellisable) plug-in, use these commands:
cd $PLUGIN_DEV_DIR
bicreateplugin viz -id <yourVizName> -subType embeddableDataviz
.\gradlew run
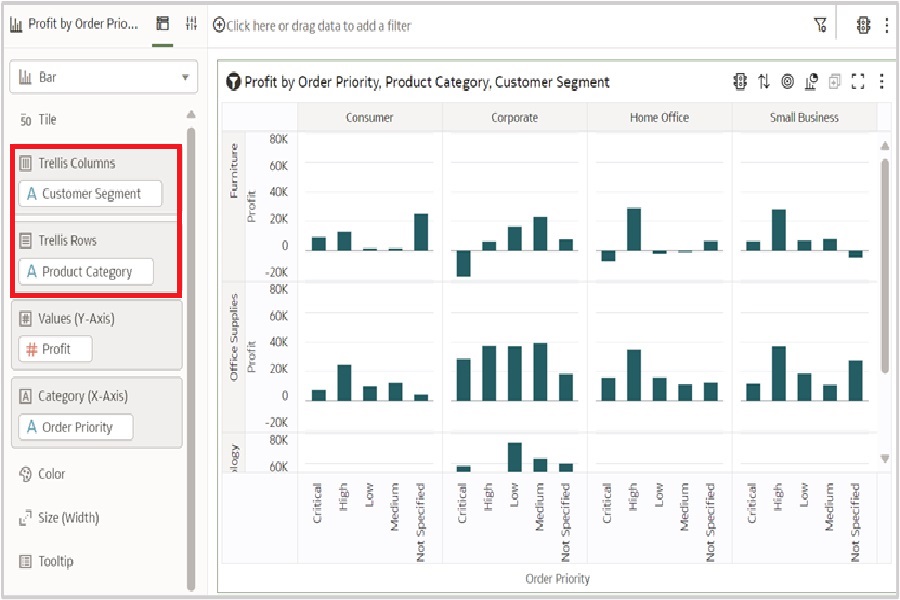
Fig 2: Embeddable Dataviz plug-in
The Gradle run command invokes OAD in SDK mode. After running these commands, the following files are displayed in your plug-in directory. Here’s an example:
C:\custom-plugins\src\customviz\com-company-barchart
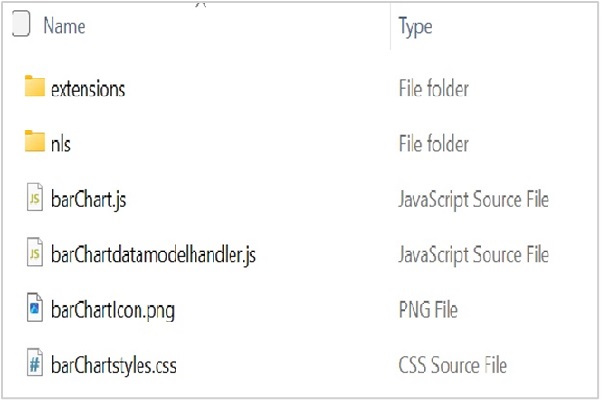
Fig 3: Custom Plug-in Files
Key Files in the Custom Plug-in
-
barChart.js contains the default visualization implementation code. You can modify this to customize the plug-in.
-
barChartstyles.css is a stylesheet for defining the plug-in’s visual styles.
-
barChartdatamodelhandler.js manages the mapping between the chart’s logical and physical layers.
-
Extensions folder contains
com.company.barChart.visualizationDatamodelHandlerdefining the plug-in’s grammar properties. -
nls folder supports National Language Support (NLS). Modify messages.js in the root folder to adjust the UI display names and grammar terms for different languages.
Expected Output
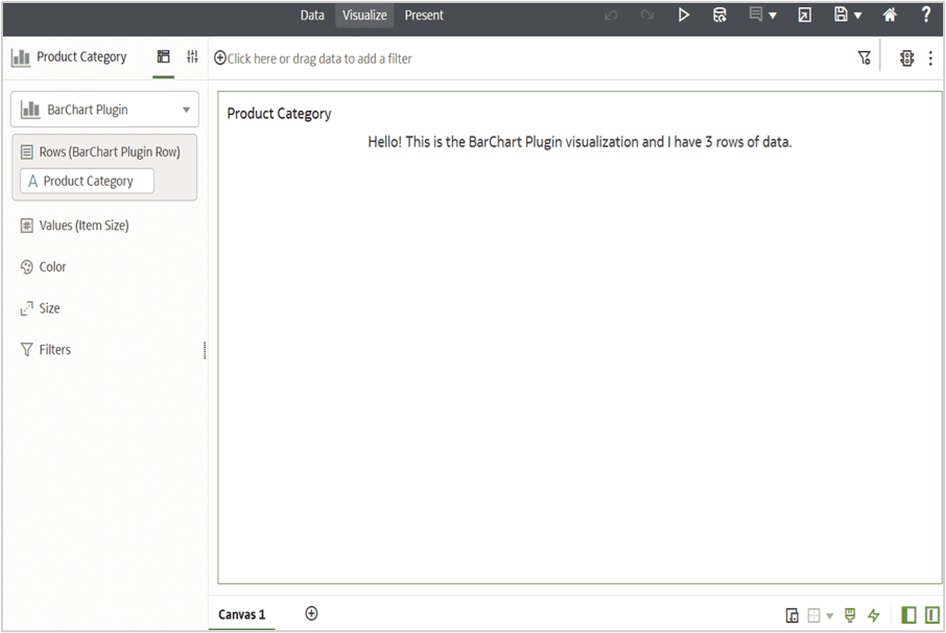
Fig 4: Expected Output
Becasue there isn’t data available to visualize, by default, the plug-in displays a simple message as shown earlier.
Call Out
If you develop an Embeddable Dataviz plug-in, add the “obitech-viz/embeddableDataModelHandler” module to the barChartdatamodelhandler.js file as follows:
define(['obitech-framework/jsx',
        'obitech-reportservices/datamodelshapes',
        'obitech-viz/embeddableDataModelHandler',
        'obitech-report/vizdatamodelsmanager'],
        function(jsx,
                 datamodelshapes,
                 genericDataModelHandler,
                 vdm) {
   "use strict";
   var barChartDataModelHandler = {};
... .
)
Call to Action
With the groundwork laid for developing a custom bar chart plug-in in Oracle Analytics, you’re now equipped to begin experimenting with D3.js to create interactive visualizations. By understanding the foundational set up, file structure, and initial commands, you’re well on your way to mastering custom plug-in development.
In the next article, you focus on enhancing the bar chart plug-in by exploring more detailed customization techniques, implementing data binding, and refining the visualization’s interactivity. This series aims to empower you with the skills you need to extend OAC’s capabilities and bring data insights to life.
Watch for Part 2 in this series, where you can continue following this dynamic data-driven journey.