The Oracle Analytics Cloud (OAC) September 2025 update delivers a new wave of enhancements designed to help users visualize, personalize, and analyze data with greater intelligence and ease. From advanced charting options and seamless Microsoft Teams integration to smarter AI-driven insights and expanded customization, this update empowers users to collaborate efficiently, uncover deeper trends, and take action faster. OAC’s latest update brings fresh features for every step of the data journey.
Featured highlights:
Data Visualization and Experience
- Microsoft Teams Integration
- Add Buttons to your Canvas
- Create Mekko Charts
- Multistate Workbook Personalization
- Set Default Landing Pages for Users
- Align Field Values on Tables and Pivots
- Conditional Formatting for Totals and Subtotals in Tables and Pivots
- Table Cell Selection and Copying
- Subject Area Derived Date Columns
- Convert Lat-Long Data into Geometries
- Prophet Forecasting Algorithm
AI and Generative AI
- Contextual Insights On by Default
- Select Data Sources for Consumer AI-Assistant
- LLM-Based Column Name Simplification
Modeling, Preparation, and Connectivity
- Dataset Column Descriptions
- Dataset Filters in the Dataset Editor
Data Visualization and Experience
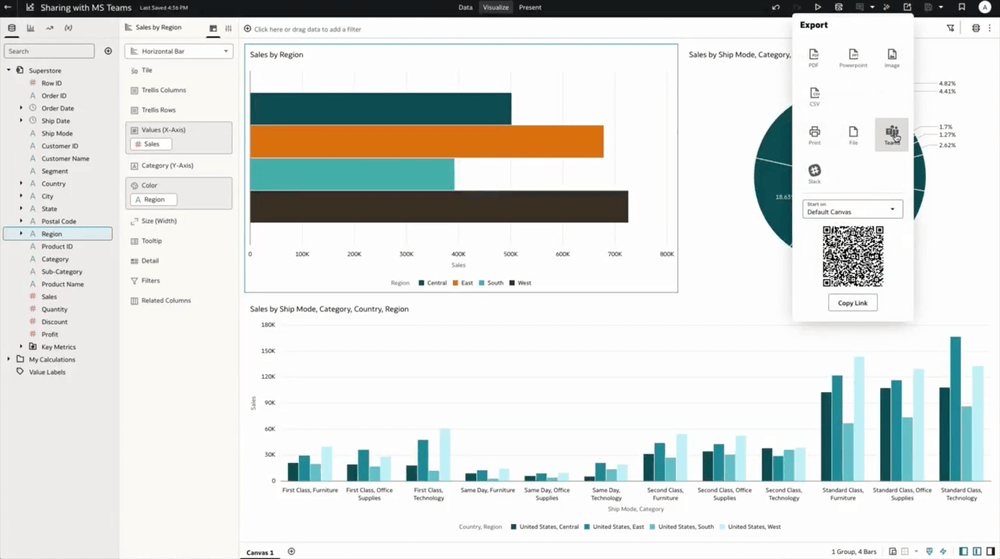
Microsoft Teams Integration
Microsoft Teams integration makes it easy to share Oracle Analytics Cloud content directly with colleagues in Teams channels. Users can export dashboards as PDF files or share interactive links, add custom messages and set password protection for added security. This feature streamlines collaboration, allowing teams to access the latest analytics, interact with visualizations, and drive informed decisions together within their existing Microsoft Teams workflows.
Add Buttons to Your Canvas
Customizable buttons bring app-like interactivity to dashboards by handling navigation, featuring icons or images, offering multiple styles, and triggering actions such as URL launches or executing data-based actions for workflow integration. This feature empowers workbook authors to guide users intuitively, enhance navigation, and create visually engaging analytic applications tailored to user needs. For example, a button can be used to let users jump directly to an HR portal, launch approval workflows, or navigate between key business dashboards, all within the analytics workbook, streamlining daily tasks and improving productivity.
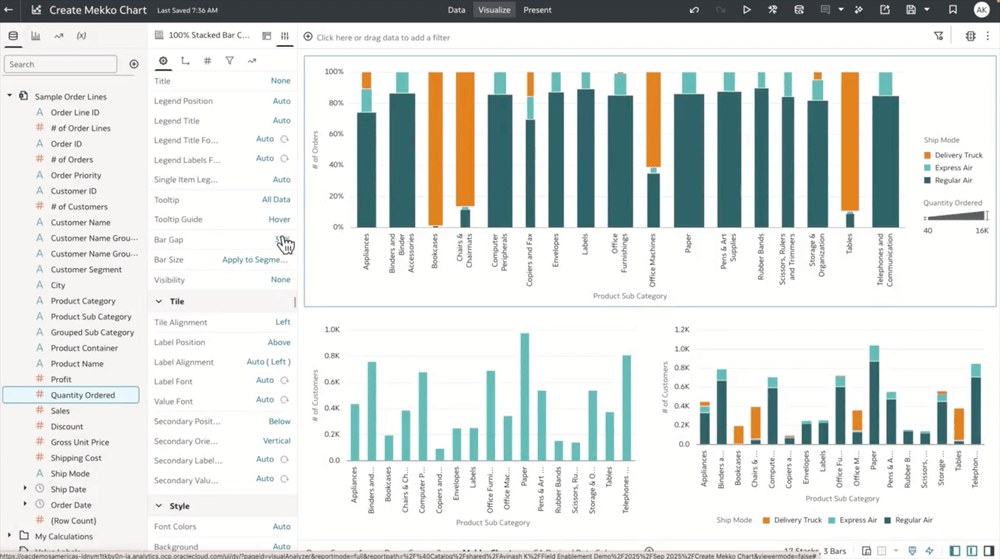
Mekko Charts
Mekko charts introduce a dynamic visualization method for categorical data using variable-width stacked bars, making it easy to compare both the size and internal makeup of different categories. New customization options like adjustable bar gaps and stack sizes help users create clear and insightful dashboards. This makes it simpler to reveal complex patterns and deliver smarter business insights.
Multistate Workbook Personalization
Personalization in Oracle Analytics Cloud now extends to workbook states, allowing end users to save, name, and quickly reapply their preferred filter selections and dashboard configurations. This feature allows users can pick up right where they left off or toggle between different saved views, streamlining repeat analysis and simplifying the comparison of various insights.
Set Default Landing Pages for Users
Administrators can set custom landing pages for specific users or groups when logging in, ensuring individuals start on a page that’s most relevant to them, such as a team dashboard. This leads to quicker access and improved productivity from the moment a user signs in.
Align Field Values on Tables and Pivots
Custom alignment options give users precise control over how cell values are displayed in tables and pivot tables, allowing alignment to be set as left, center, or right at both the table and individual column level within the property panel. Users can format data to suit their organizational style or reporting standards. This flexibility improves dashboard readability and ensures consistency.
Conditional Formatting of Totals and Subtotals in Tables and Pivots
Conditional formatting can now be applied at the total and subtotal level for both rows and columns, not just individual data cells. Highlighting key summary values becomes more effective, drawing attention to the most important trends or metrics. As a result, dashboards become more impactful and easier to interpret at a glance.
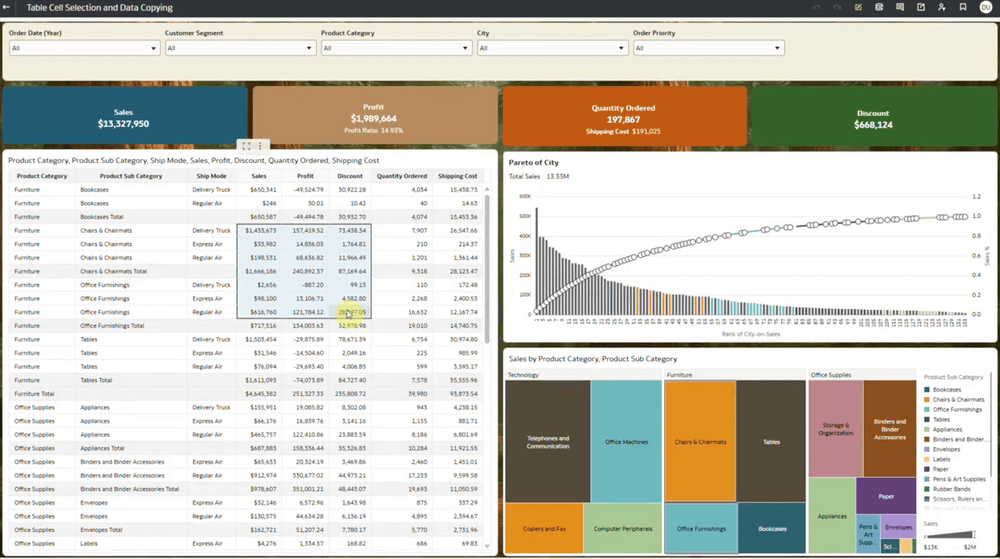
Table Cell Selection and Copying
Selecting and copying table data is now more flexible, allowing users to pick individual cells, drag to highlight groups, or use keyboard shortcuts to select blocks of data for copying. Extracting the exact insights you need becomes quick and straightforward. This streamlines sharing and working with data across other tools or documents.
Subject Area Derived Date Columns
Subject Area Derived Date Columns add automatic period granularities to date and datetime columns within subject areas. This feature makes it easy to break down metrics by year, month, day, or other time periods, and use these derived columns for chart axes, filters, or parameter binding. With this flexibility, users can create more dynamic, interactive dashboards and streamline time-based analysis directly from their subject area data.
Convert Lat-Long Data into Geometries
Latitude and longitude data can now be transformed into geometry points, enabling a range of spatial calculations such as distance measurement or assessing proximity to other features. This feature unlocks advanced spatial calculations, such as measuring distances between points or assessing relationships to geographic features and enables rich map-based visualizations.
Prophet Forecasting Algorithm
The Prophet Forecasting Algorithm introduces a powerful new time series forecasting model to, designed to handle data with complex patterns, trends, and special events. Prophet combines trend analysis, seasonality, and event impacts to produce robust, business-ready forecasts even when outliers or irregularities are present in the data. This feature helps users create more accurate and resilient projections for a wide range of use cases, from business planning to scientific analysis, all with just a few clicks in their visualization workflows.
AI and Generative AI
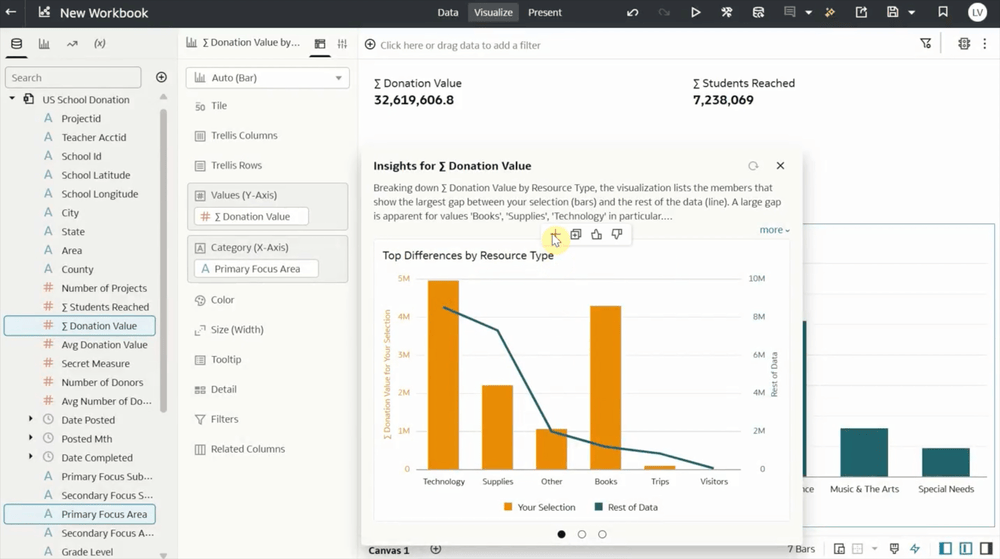
Contextual Insights On by Default
Contextual Insights are now automatically available for any data point or visualization, providing AI-powered explanations and deeper analysis with a simple right-click. Users receive instant suggestions, comparisons, and additional context such as trends or contributing factors, whether working with datasets or subject areas. This feature helps uncover hidden insights, saves time on analysis, and supports more informed decisions directly within dashboards.
Select Data Sources for Consumer Assistant
Authors can now control which datasets or subject areas are available to users engaging with the Consumer AI-Assistant. This feature lets creators tailor the natural language assistant’s responses to draw only from relevant data sources within each workbook. By making responses focused on the current workbook context, this selective approach enhances data governance and ensures users receive precise, meaningful insights.
LLM-Based Column Name Simplification
Column Name Simplification uses generative AI to automatically improve and clarify the dataset column names. Abbreviations are expanded, formatting issues like all caps or underscores are resolved, and plain language names are generated for easier understanding. This feature reduces cleanup time and helps users work more efficiently with business-friendly column names that they recognize and understand.
Modeling, Preparation, and Connectivity
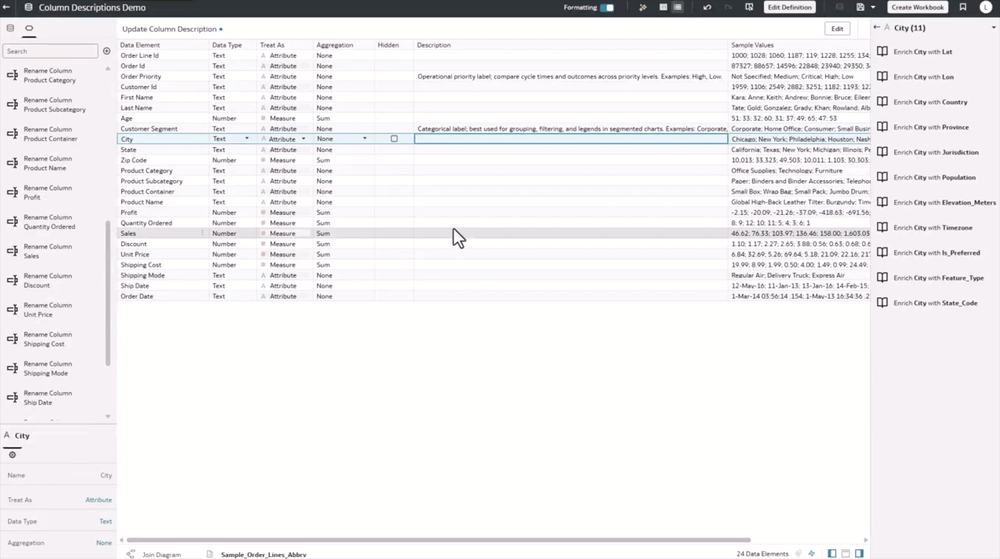
Dataset Column Descriptions
Dataset column descriptions let users add helpful, context-specific notes to any column directly within the dataset editor. These descriptions appear in tooltips when hovering over column names in workbooks, making it easier to understand the meaning and intended use of each data field. By keeping valuable context attached to your datasets, this feature supports smoother collaboration and stronger data literacy.
Dataset Filters in the Dataset Editor
Dataset filters can now be created and managed directly within the dataset editor. These filters are automatically applied to all downstream visualizations and analyses, helping maintain data consistency and relevance throughout the analytics process. This capability improves governance and ensures that users always work with focused, reliable data sets.
Key Takeaways
The September 2025 update to Oracle Analytics Cloud delivers new ways to visualize data, personalize dashboards, and gain instant AI-driven insights. With features like Mekko charts, Microsoft Teams integration, enhanced table and pivot controls, smart column naming, and contextual insights, users can explore trends, customize dashboards, and extract more value from their data. Expanded spatial analysis, robust data governance, and greater flexibility in navigation and collaboration make this update a significant step forward in empowering users to create, analyze, and share impactful analytics experiences.
For more information: