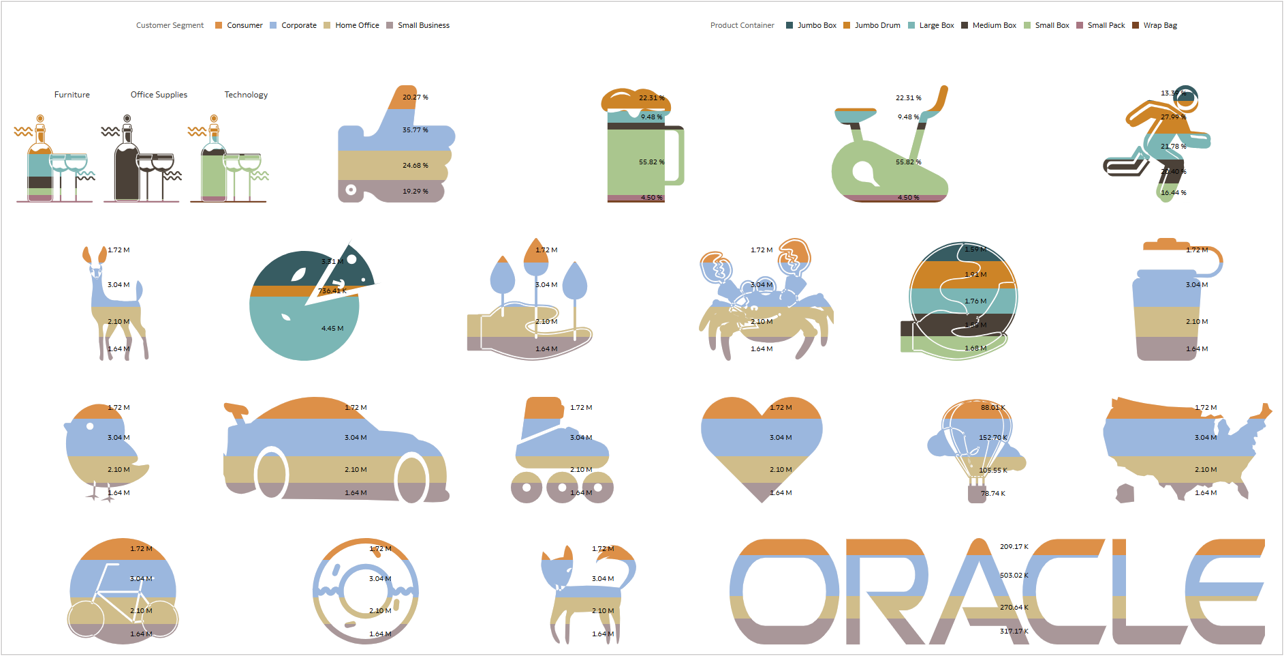
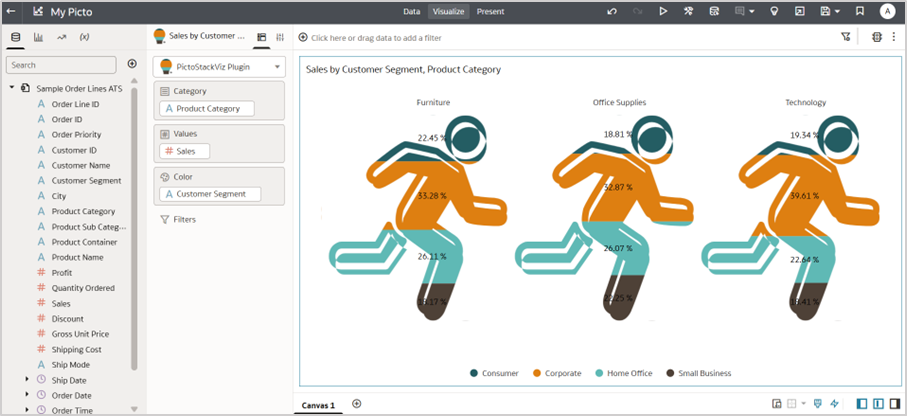
Turning raw numbers into visuals that truly connect with your audience isn’t always easy. That’s where Oracle Analytics custom visualizations can help a lot. The PictoStack custom visualization extension is a cool visualization that transforms any SVG image into a dynamic, data-driven infographic. Whether it’s cars, light bulbs, animals, or your brand’s own icons, your data now speaks in shapes that directly impact your audience.
Getting Started is Simple
- Watch the demo video for a quick walkthrough.
- Download the extension zip file + sample SVGs from the Oracle Analytics Community Post.
- Deploy it on your Oracle Analytics instance.
Just upload and drop the custom visualization to any of your canvases, load your SVGs, and let your data tell the story—visually, intuitively, and with impact.
Tip: Keep your own SVG files reasonably simple for the best results.
How to Use PictoStack in Oracle Analytics
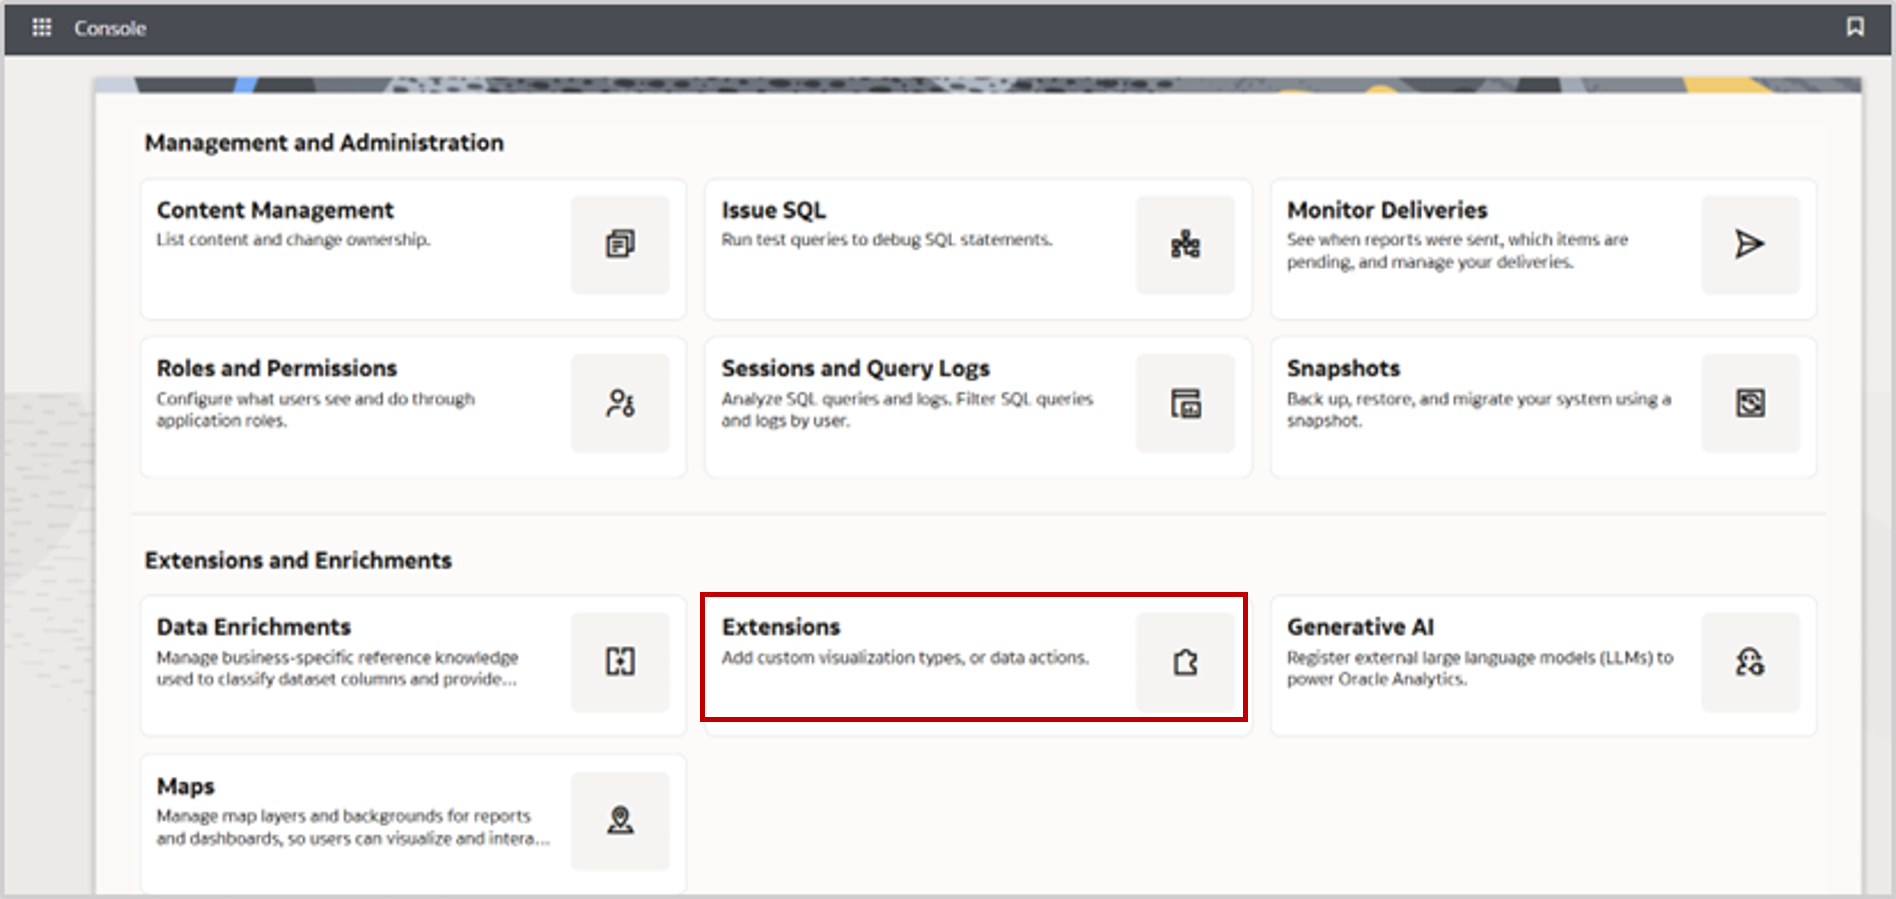
1. Upload the extension
From the Oracle Analytics Console, navigate to Console and then Extensions, and upload the PictoStack.zip file.
2. Create a workbook with the PictoStack extension
Drag the PictoStack extension to your canvas.
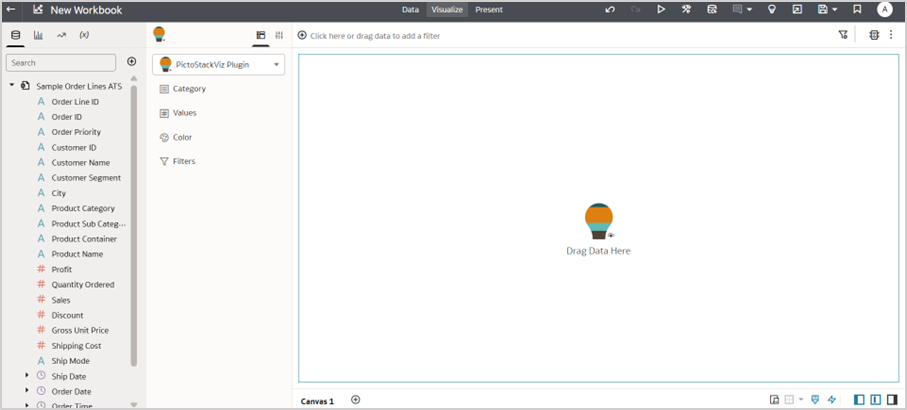
3. Bind your data
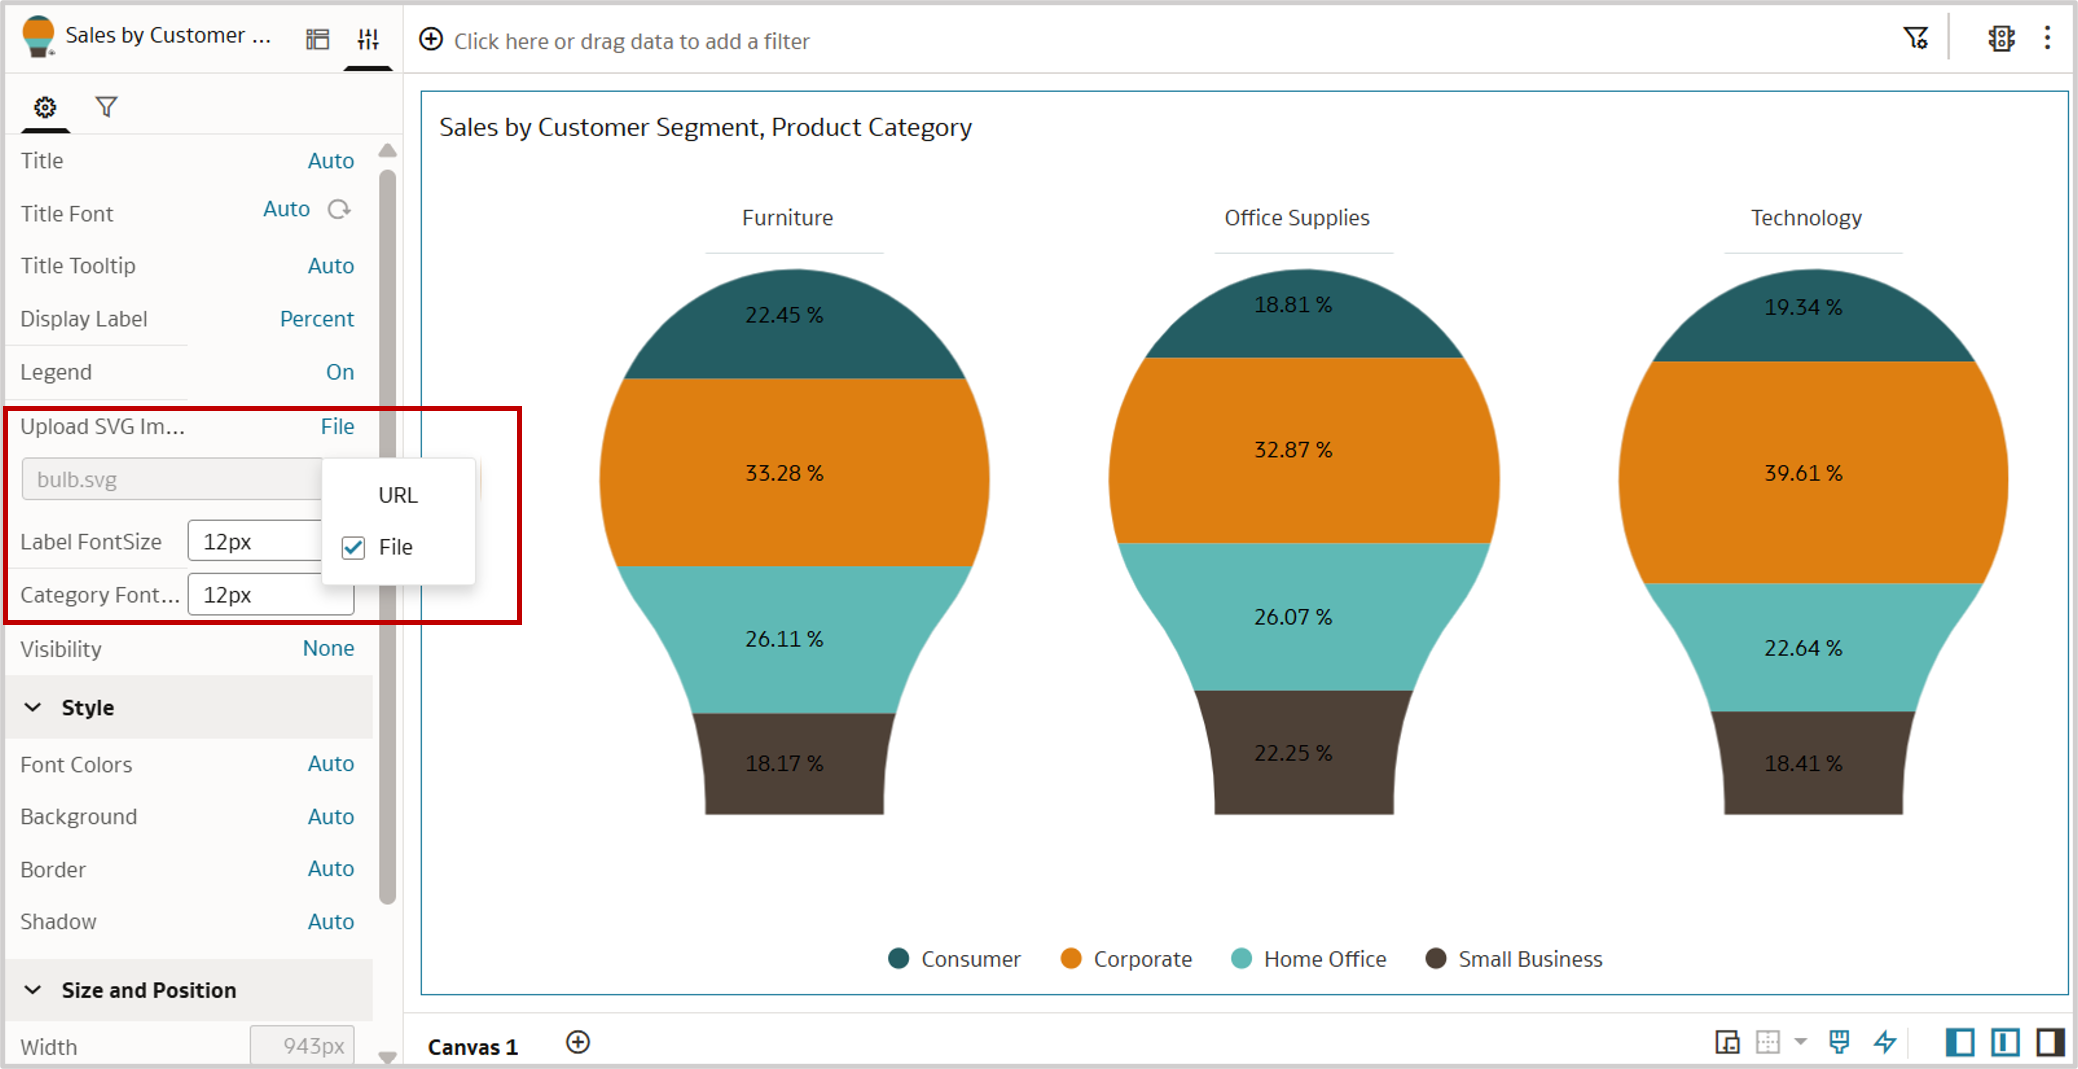
Drag and drop fields into the Grammar pane. By default, light bulbs are displayed.
4. Load your SVGs
Navigate to Extension Properties and select one of the following menu options:
- File: Use to upload local SVGs
- URL: Use to fetch SVGs from OCI object storage (remember to whitelist domains in Safe Domains)
For details, see the Safe Domains documentation and blog article on enabling CORS.
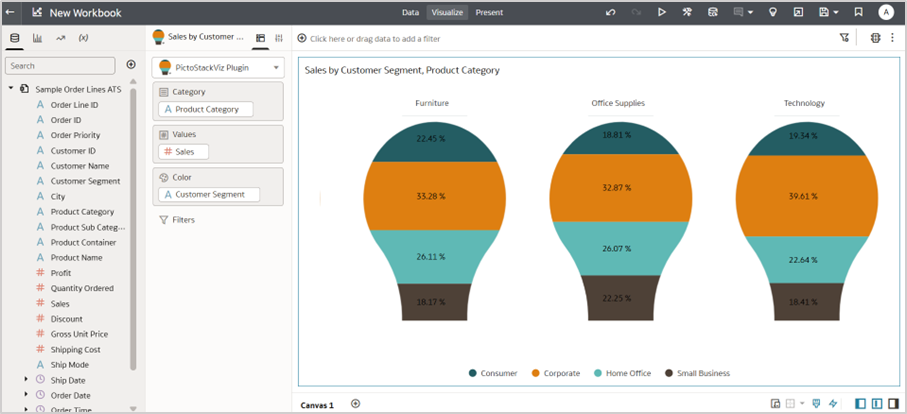
5. Customize and explore
Adjust colors, data-label fonts, and category header fonts to fine-tune your visuals.
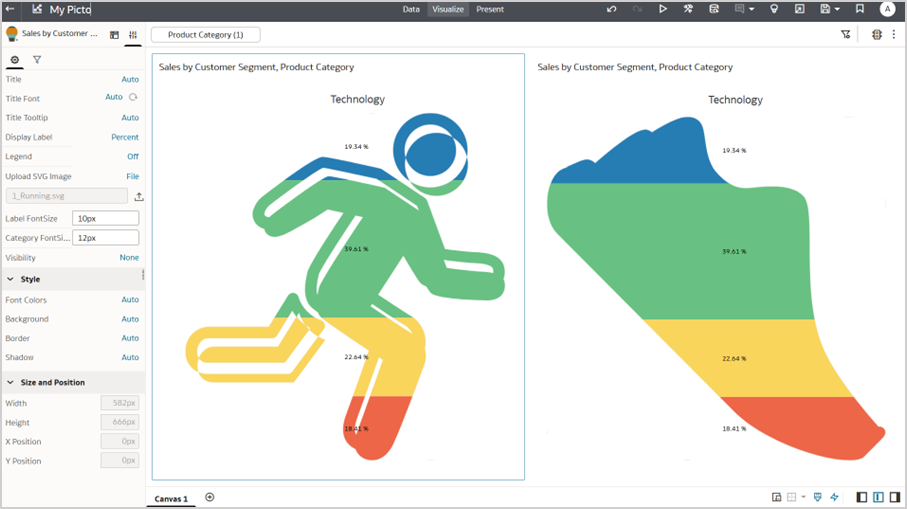
With just a few clicks, your data comes alive in visuals that go beyond traditonal charts.
Call to Action
Try PictoStack in your next dashboard and share your most creative infographic use cases with us in the Oracle Analytics Community.