Business Case
A heatmap is a vibrant visualization tool that showcases variations in values through a spectrum of colors making it easier to visualize and interpret data. This article provides you with the steps and framework to bulld autonomous data warehouse heatmaps of your own.
The Approach
1. Create a table
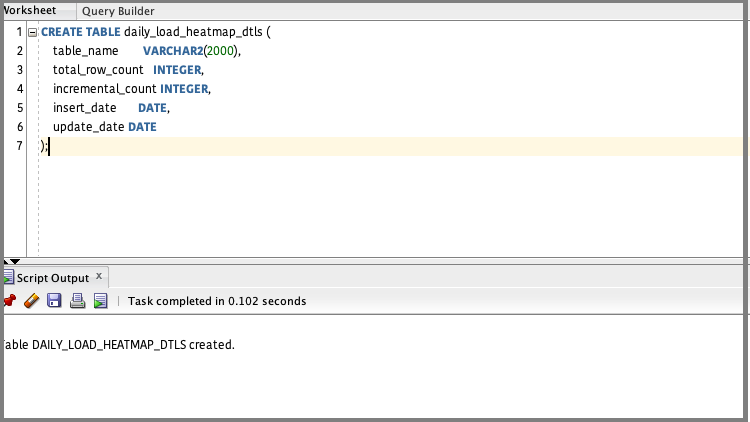
Create a table where the heatmap related data resides. The structure can be based on the script provided:
CREATE TABLE daily_load_heatmap_dtls (
    table_name        VARCHAR2(2000),
    total_row_count   INTEGER,
    incremental_count INTEGER,
    insert_date       DATE,
    update_date DATE
);
Execute the following in SQL Developer.
2. Create a record count function and a procedure to generate the heatmap
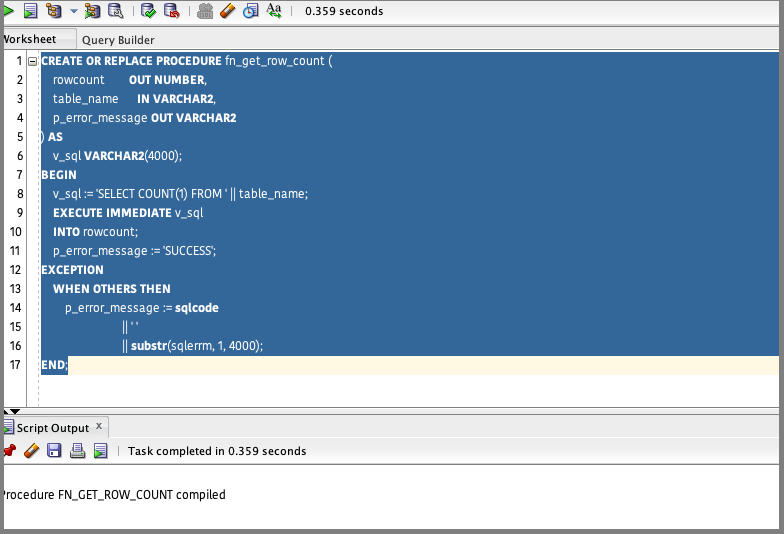
The following script takes table name as the input and provides record count as output. Since this procedure is automated, ensure that the basic exception handling is incorporated.
CREATE OR REPLACE PROCEDURE fn_get_row_count (
    rowcount        OUT NUMBER,
    table_name      IN VARCHAR2,
    p_error_message OUT VARCHAR2
) AS
    v_sql VARCHAR2(4000);
BEGIN
    v_sql := 'SELECT COUNT(1) FROM ' || table_name;
    EXECUTE IMMEDIATE v_sql
    INTO rowcount;
    p_error_message := 'SUCCESS';
EXCEPTION
    WHEN OTHERS THEN
        p_error_message := sqlcode
                           || ' '
                           || substr(sqlerrm, 1, 4000);
END;
Compile the procedure in OAX_USER or a database user with equivalent access.
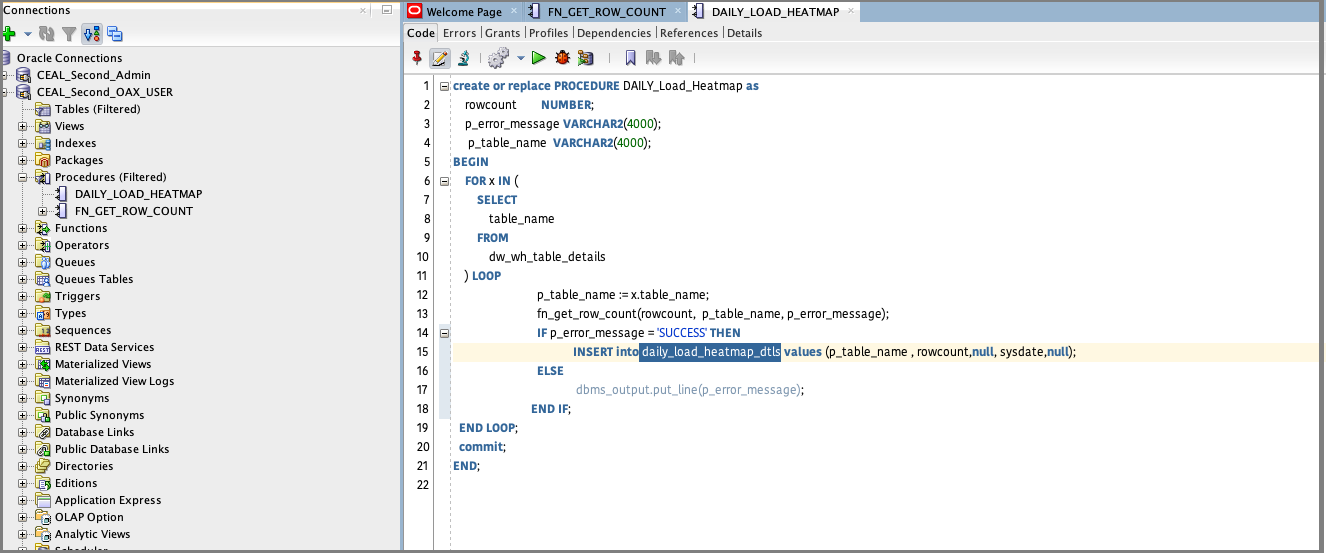
Create another procedure that populates the heatmap table with data from a procedure call for record counts per table. Use this sample code:
Create or replace PROCEDURE DAILY_Load_Heatmap as
    rowcount        NUMBER;
    p_error_message VARCHAR2(4000);
     p_table_name  VARCHAR2(4000);
BEGIN
    FOR x IN (
        SELECT
            table_name
        FROM
            dw_wh_table_details
    ) LOOP
                            p_table_name := x.table_name;
                            fn_get_row_count(rowcount,  p_table_name, p_error_message);
                            IF p_error_message = 'SUCCESS' THEN
                                        INSERT into daily_load_heatmap_dtls values (p_table_name , rowcount,null, sysdate,null);
                            ELSE
                                         dbms_output.put_line(p_table_name||' '||p_error_message);
                          END IF;
  END LOOP;
  commit;
END;
Compile the procedure in OAX_USER or database user with equivalent access.
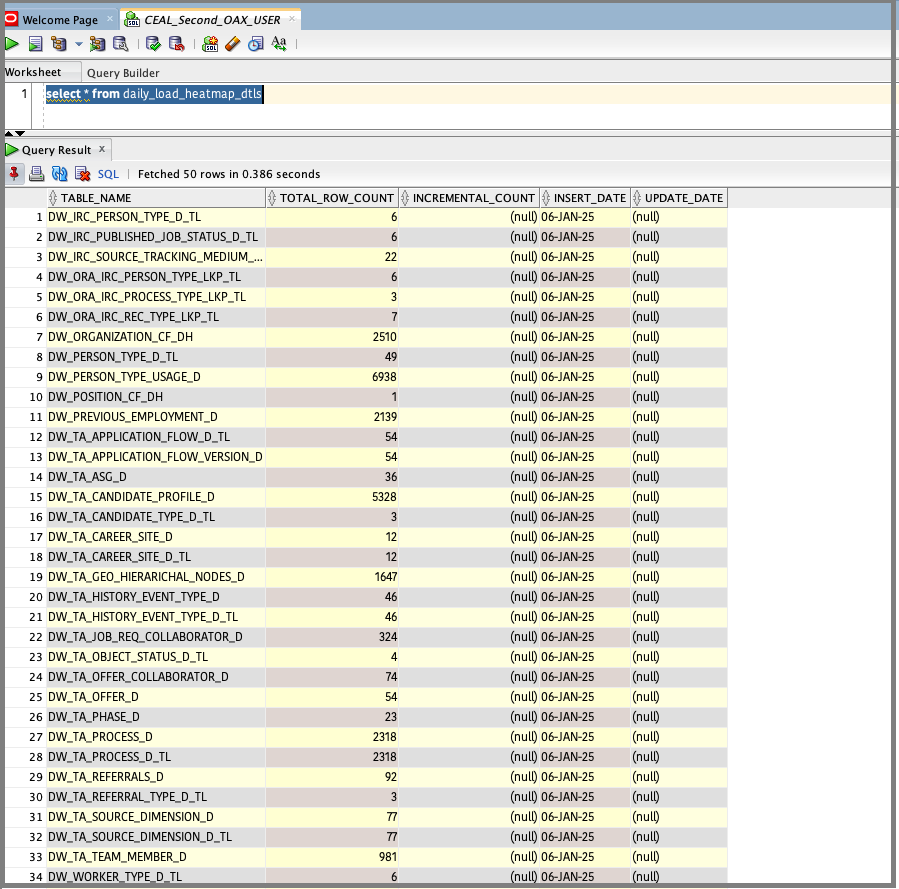
3. Populate the heatmap table
Execute the procedure that you created.
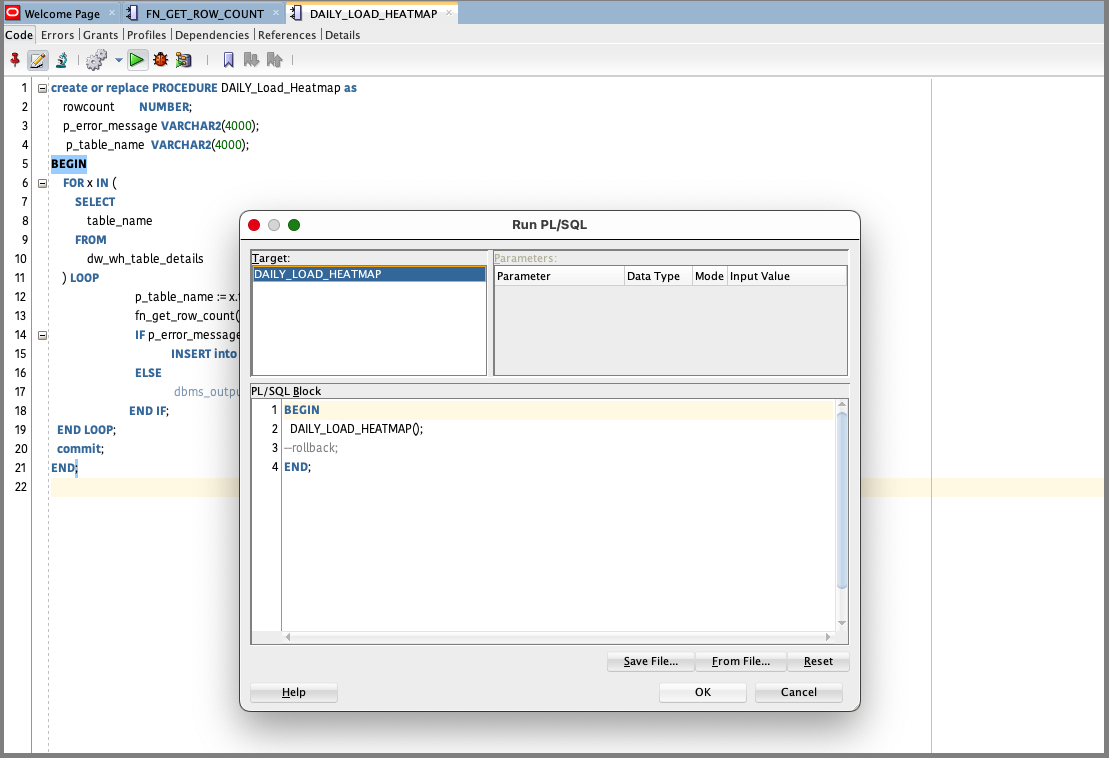
Validate the data loaded in the heatmap table.
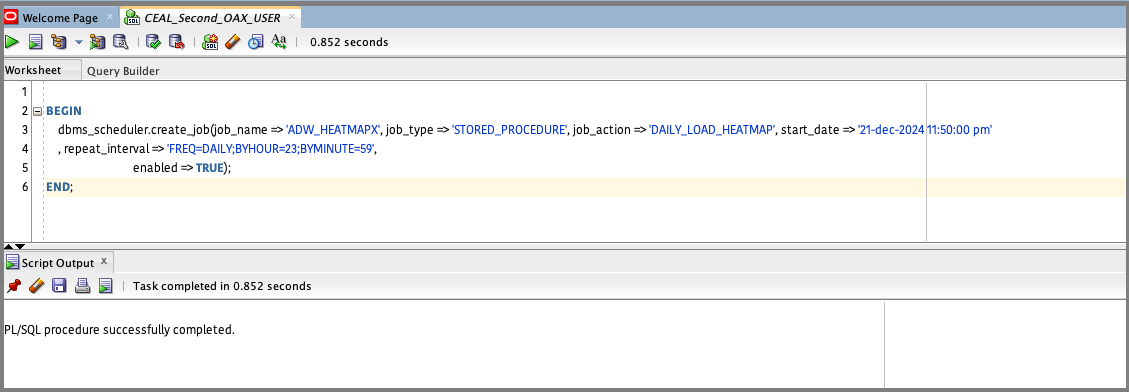
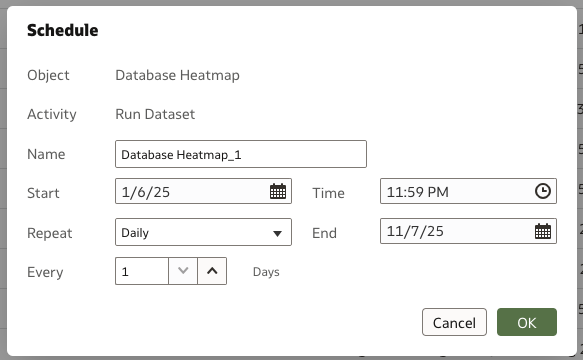
4. Schedule the job
You can schedule the stored procedure that was created using the following scipt. In this case, the job is named ADW_HEATMAP scheduled from 21-Dec-2024 to run daily at 23:59.
BEGIN
    dbms_scheduler.create_job(job_name => 'ADW_HEATMAP', job_type => 'STORED_PROCEDURE', job_action => 'DAILY_LOAD_HEATMAP', start_date => '21-dec-2024 11:50:00 pm'
    , repeat_interval => 'FREQ=DAILY;BYHOUR=23;BYMINUTE=59',
                             enabled => TRUE);
END;
Run the same stored procedure in SQL Developer.
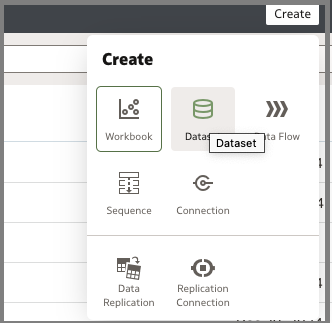
5. Create the dataset
Create an ADW OAC connection. Post setting up the connection details, click Create, and then click Dataset.
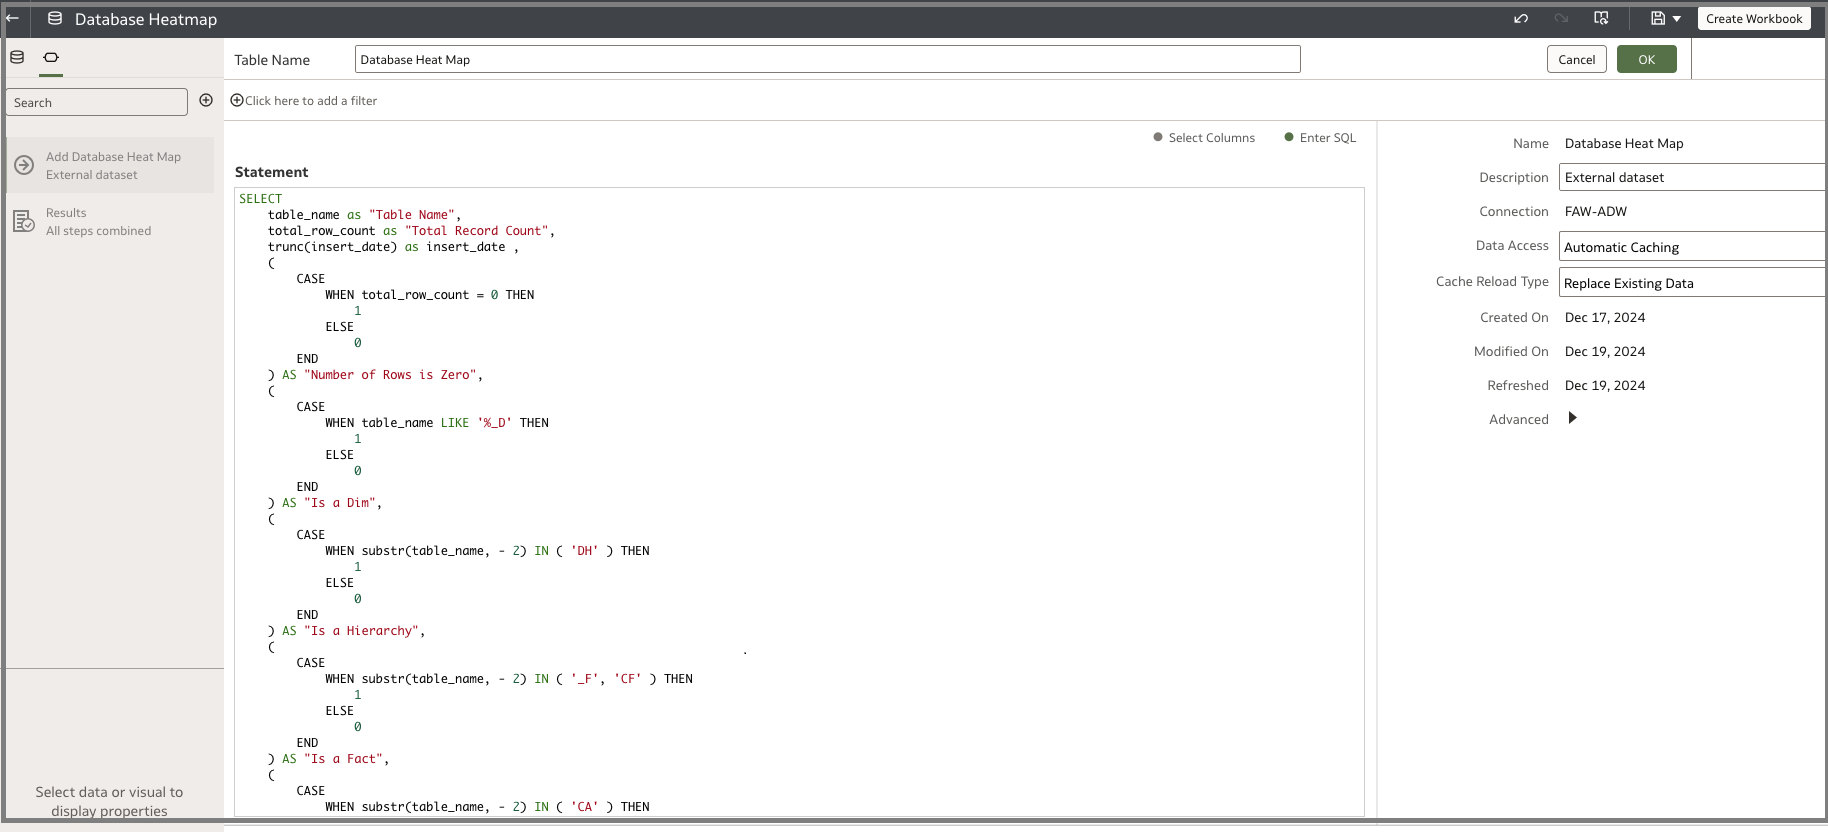
The following is an indicative query and you can customize it as needed:
SELECT
    table_name as "Table Name",
    total_row_count as "Total Record Count",
    trunc(insert_date) as insert_date ,
    (
        CASE
            WHEN total_row_count = 0 THEN
                1
            ELSE
                0
        END
    ) AS "Number of Rows is Zero",
    (
        CASE
            WHEN table_name LIKE '%_D' THEN
                1
            ELSE
                0
        END
    ) AS "Is a Dim",
    (
        CASE
            WHEN substr(table_name, - 2) IN ( 'DH' ) THEN
                1
            ELSE
                0
        END
    ) AS "Is a Hierarchy",
    (
        CASE
            WHEN substr(table_name, - 2) IN ( '_F', 'CF' ) THEN
                1
            ELSE
                0
        END
    ) AS "Is a Fact",
    (
        CASE
            WHEN substr(table_name, - 2) IN ( 'CA' ) THEN
                1
            ELSE
                0
        END
    ) AS "Is an Aggregate"
FROM
    daily_load_heatmap_dtls
 order by    total_row_count desc
Copy the following query to a new dataset:
6. Schedule the dataset
In this example, the dataset is scheduled to start at a specific time and you must create this per the FDI load cycle. Monitor your daily incremental load timings and identify a time which is safely outside the zone of the load window for the schedule.
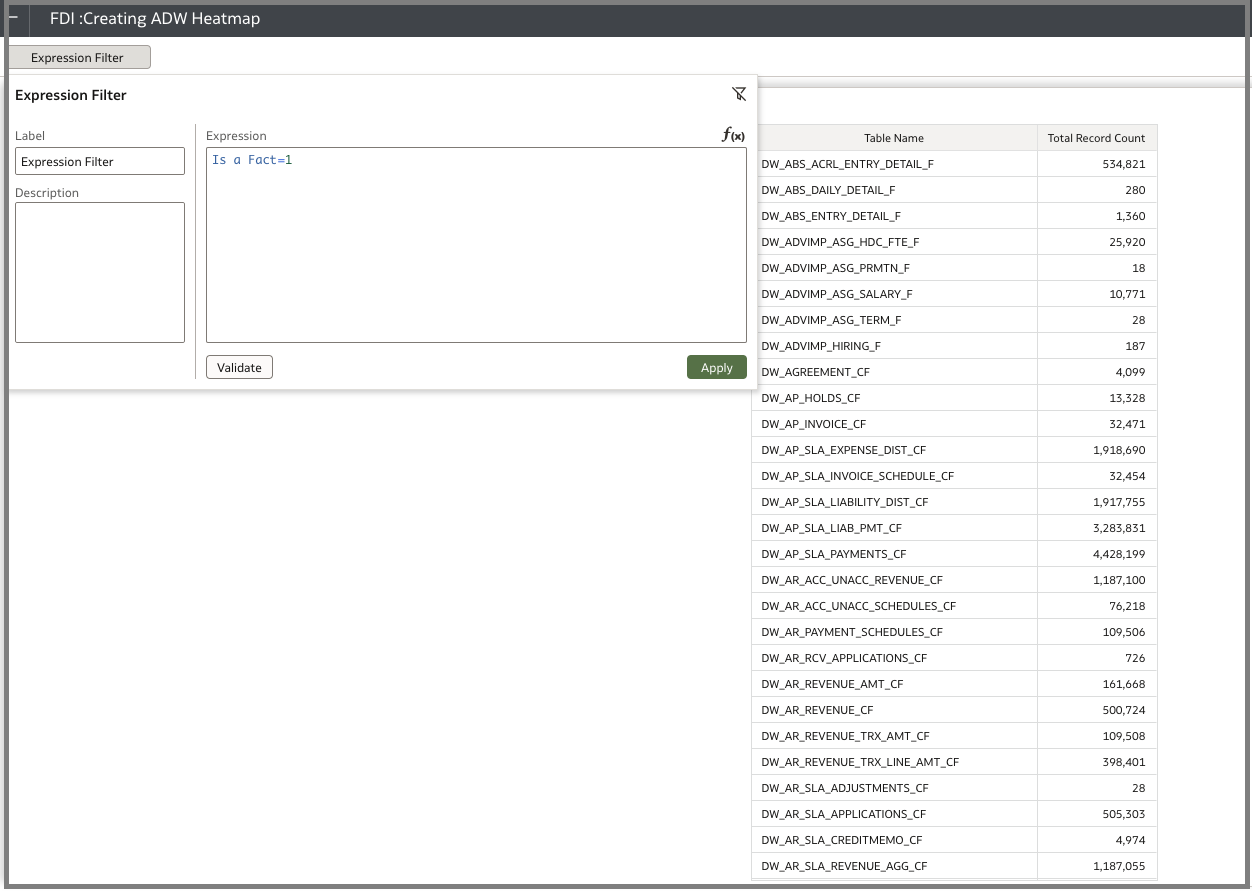
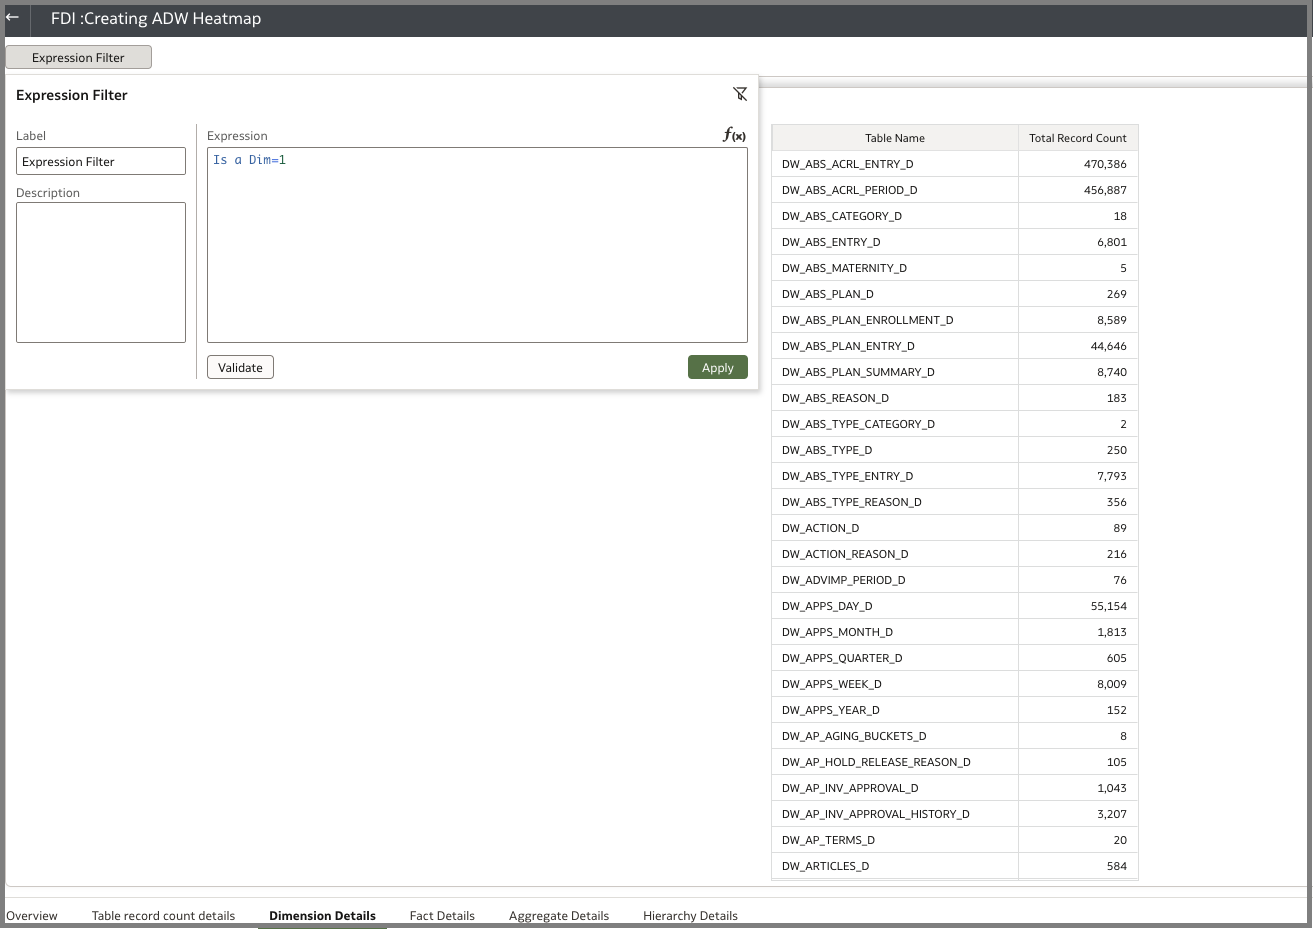
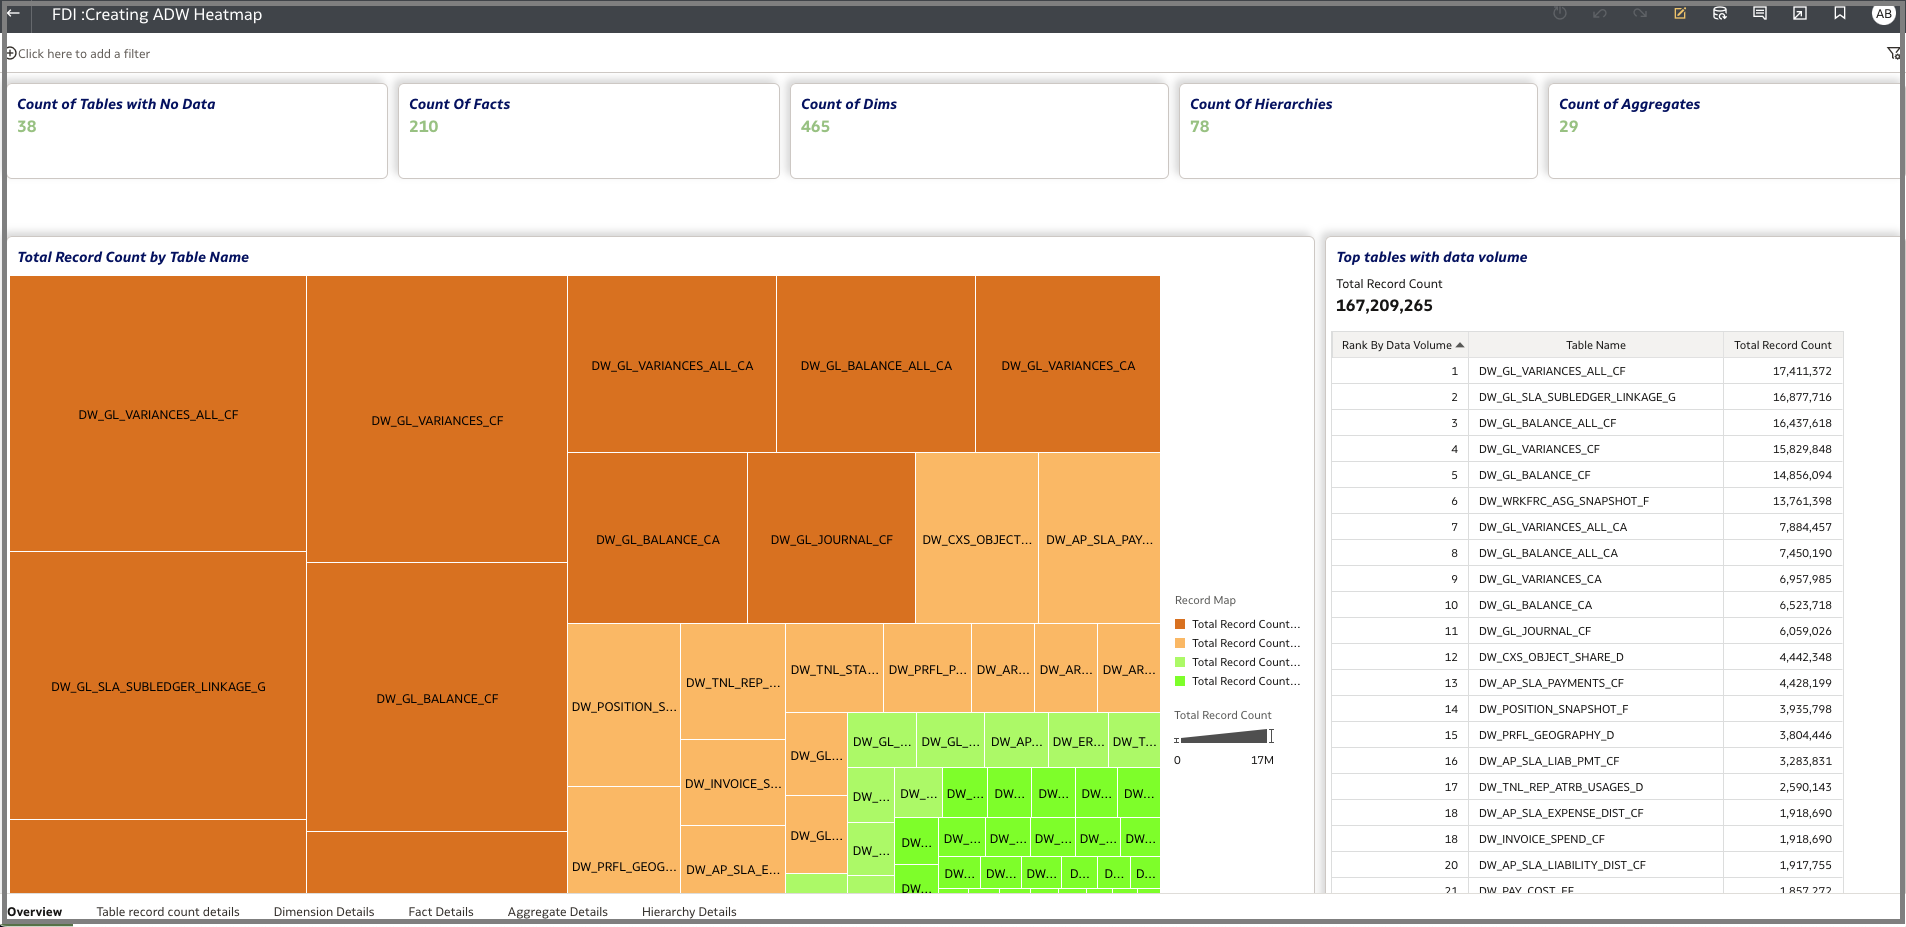
7. Create the canvas workbooks
You can create various workbooks as shown in these examples:
- Fact table with row count
- Dim table with row count
- Heatmap per record count
Call to Action
This article presents the steps to create heatmaps on ADW tables residing in FDI. To learn more, view the product documentation, view additional Oracle Analytics articles at blogs.oracle.com/analytics, and follow us on Twitter@OracleAnalytics.