Oracle Analytics offers developer options that enable you to review performance statistics for visualization components. Developer options are available only to users with administrator or content author privileges..
The Performance Tools Statistics Summary breaks down execution details into two key categories: Request Statistics and Query Statistics. Combined with visual insights like the Execution Time Breakdown graph, these metrics offer a comprehensive view of how queries interact with the server, database, and browser.
Request Statistics
Request statistics report how long it takes to process a query request from your browser. These statistics focus on the overall execution lifecycle from request initiation to data visualization, and only includes timings for fetched data.
Here’s a breakdown of the key metrics:
Key Metrics
- Overall Execution Time
- Length of time (in seconds) between the initial data request and the data being displayed in the visualization.
- Explanation: This is the total time taken across all stages, including query execution, data fetching, and rendering in the browser. High values indicate potential performance issues in the query, data transfer, or rendering phases.
- Cumulative Query Time
- Cumulative query time to execute all physical queries (in seconds). If there are multiple physical queries, this value may be higher than the overall execution time as it’s the sum of all the physical query times and queries might be executed in parallel. This value is zero for a session cache hit.
- Explanation: This metric provides insight into the total query load. High cumulative query times suggest complex queries or insufficient caching mechanisms.
- Maximum Query Time
- Longest time taken by any individual physical query in the workbook (in seconds). This value is zero for a session cache hit.
- Explanation: This metric highlights the query that takes the most time. Optimizing this query can lead to significant performance improvements.
- Query Compilation Time
- Length of time spent in the server to build the execution plan (in seconds). This may include any intermediate physical query execution required to build the execution plan.
- Explanation: This metric involves translating logical SQL into executable queries, optimizing joins, and defining query paths. Long compilation times suggest complex queries or inefficiencies in the metadata model.
- Line Processing Time
- Length of time the visualization takes to process the data after it’s ready (in seconds).
- Explanation: This measures the time required to transform or aggregate the data before displaying it. A high value suggests that server-side calculations or transformations could be optimized.
- Line Render Time:
- Length of time to display the data in the visualization (in seconds). This time includes wait times for other visualizations and page rendering.
- Explanation: This metric includes browser-side rendering of visualizations and handling dependencies. If the value is high, consider simplifying visualizations or reducing data complexity.
- Session Cache Hit
- Whether or not the request used this session’s query cache (Yes or No).
- Explanation: Yes indicates that data was retrieved from the cache, avoiding full query execution. This can significantly improve performance for repeated queries.
- Rows Sent to Browser:
- Number of rows sent to the browser. Visualization renderers use a cube data structure to render data that might not match what you visually see.
- Explanation: Sending too many rows can increase browser-side processing time and slow down rendering. Optimizing the data that’s sent to the browser can improve performance.
- Columns Sent to Browser:
- Number of columns sent to the browser. Visualization renderers use a cube data structure to render data that might not match what you visually see.
- Explanation: Sending unnecessary columns can inflate data payloads, and impact rendering speed. Ensure that you include only relevant columns.
Query Statistics
Query statistics provide information about the query executed. Statistics are provided even when the query isn’t executed for a particular request. These metrics help you understand query efficiency and how you can optimize database interactions.
Key Metrics
- Physical Query Count
- Number of queries sent to the underlying data source.
- Explanation: A high count may indicate complex joins or multi-step data retrieval. If you reduce query fragmentation, you can improve the overall performance.
- Physical Connect Time
- Length of time (in seconds) that the underlying data source took to connect.
- Explanation: This measures the latency when establishing a connection to the database. High values may indicate network or database connection pooling issues.
- Cumulative Query Time
- Cumulative time (in seconds) to execute all physical queries. If there are multiple physical queries, this value may be higher than the overall execution time as it’s the sum of all the physical query times and queries might be executed in parallel. This value is zero for a session cache hit.
- Explanation: This metric provides insight into the total query load. High cumulative query times suggest complex queries or insufficient caching mechanisms.
- Maximum Query Time
- Longest time taken by any individual physical query in the workbook (in seconds). This value is zero for a session cache hit.
- Explanation: This metric highlights the query that takes the most time. Optimizing this query can lead to significant performance improvements.
- Results Cache Hit
- Whether or not this request used a general query cache (Yes or No).
- Explanation: Yes indicates that the query result was retrieved from the cache, avoiding execution. Leveraging the cache can improve response times for recurring queries.
- Dataset Cache Hit
- Whether or not this request used a dataset query cache (Yes or No).
- Explanation: A dataset cache hit of Yes indicates the request has utilized a dataset query cache.The dataset’s records are cached in a temporary store to speed up query execution time. This is especially useful for large datasets
- Query Compilation Time
- Length of time spent in the server to build the execution plan (in seconds). This may include any intermediate physical query execution required to build the execution plan.
- Explanation: This metric overlaps with the Request Statistics and indicates the efficiency of the query plan generation process. High values should prompt a review of the query logic and metadata design.
- Rows from Database
- Number of rows fetched from the database. There may be more rows or fewer rows in the final visualization depending on its definition.
- Explanation: Large numbers of rows can lead to slower database responses and increased data transfer times. You can use filters or pre-aggregations to improve performance.
Execution Time Breakdown Graph
The Execution Time Breakdown graph visually represents the time distribution across the three main phases of query execution:
Key Components
- Query Compilation Time (dark brown bar):
- Length of time spent in the server to build the execution plan (in seconds). This may include any intermediate physical query execution required to build the execution plan.
- Explanation: High query compilation times suggest that you might need to optimize the query logic or metadata complexity.
- Processing Time (yellow/orange bar):
- Length of time the visualization takes to process the data after it’s ready (in seconds).
- Explanation: High processing times indicate resource-intensive data transformations or aggregations. Simplifying these tasks can reduce processing delays.
- Render Time (light teal bar):
- Length of time to display the data in the visualization (in seconds). This time includes wait times for other visualizations and page rendering.
- Explanation: Low render times reflect efficient browser-side processing. High values may point to complex visualizations or large datasets being rendered.
- Maximum Query Time:
- Longest time taken by any individual physical query in the workbook (in seconds). This value is zero for a session cache hit.
- Explanation: This metric highlights the query that takes the most time. Optimizing this query can lead to significant performance improvements
- Metrics like Cumulative Query Time and Maximum Query Time may not appear in performance statistics under specific conditions, such as when a Dataset Cache Hit occurs. In such cases, data is retrieved directly from the cache, bypassing query execution on the underlying data source.
-
Oracle Analytics logs reflect this behavior by recording query execution time as “0.000 seconds” when the dataset cache is used.
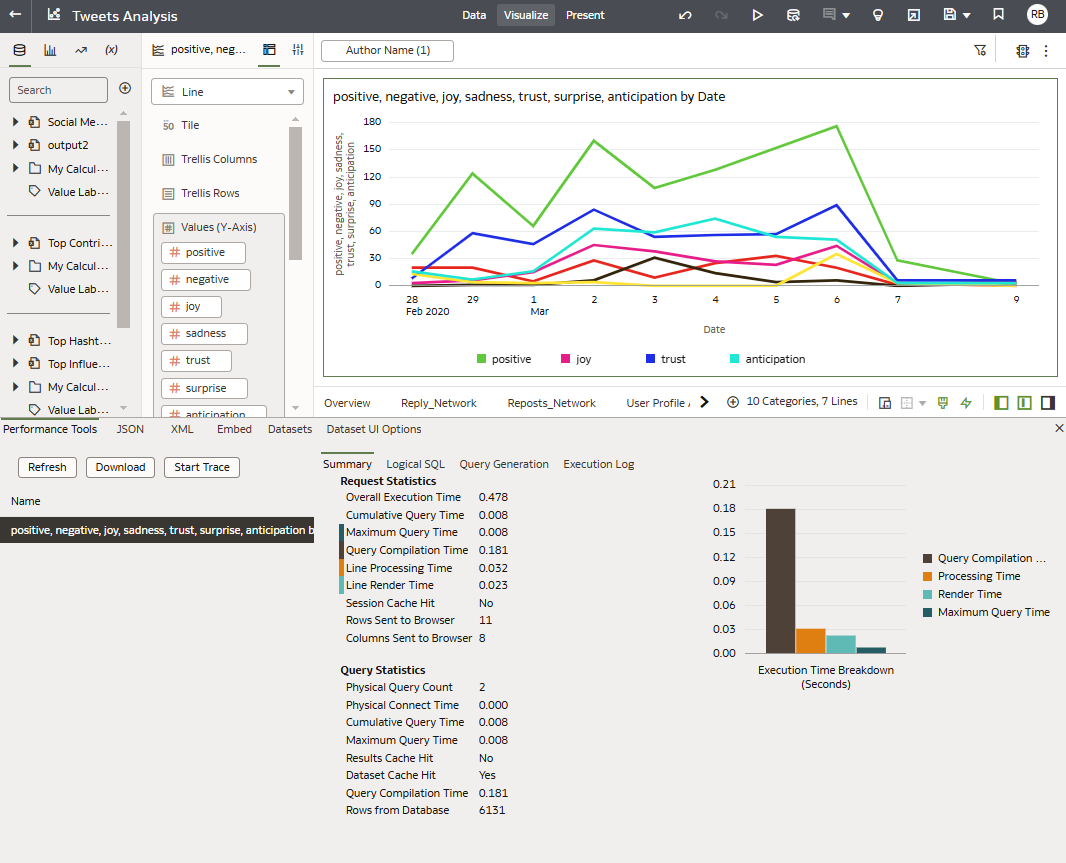
The visualization depicts the trends of sentiments and emotions (positive, negative, joy, sadness, trust, surprise, and anticipation) over time, plotted as a line graph.
- X-Axis: Represents dates ranging from February 28 to March 9, 2020.
- Y-Axis: Shows the magnitude or frequency of each emotion or sentiment.
Conclusion
The Performance Tools Statistics Summary in Oracle Analytics offers a powerful way to identify and address bottlenecks in data visualization query performance. By understanding the nuances of Request Statistics, Query Statistics, and the Execution Time Breakdown graph, you can implement targeted optimizations to enhance query efficiency, reduce execution times, and improve the overall user experience. With these insights, you can ensure your Oracle Analytics workbooks operate at peak performance.
Call To Action
Ready to optimize your Oracle Analytics performance? Start exploring the Developer Options today and unlock the full potential of your data visualizations. Whether you’re an administrator or a content author, these tools can help you streamline queries, reduce latency, and deliver faster insights to your users.