Oracle Analytics is introducing enhancements and a critical bug fix to the Limit Values By setting for filters in workbooks. These changes improve consistency but also introduce a change in behavior that could break existing workbooks depending on how they’re set up. This article explains the change, its impact, what actions you need to take, and how the change is being rolled out.
What is “Limit Values By”?
In Oracle Analytics workbooks, you can configure the Limit Values By setting for each filter.
Filters can exist in different locations and at different scopes:
- Filter bar (pinned / workbook filters at the workbook scope and unpinned / canvas filters at the canvas scope)
- Dashboard filters (canvas scope)
- Visualization filters (visualization scope)
You can use the setting to control the values that are available to select for one filter based on the selections made for other filters, whether they’re in the same location or not.
The options for the Limit Values By setting are:
- Default
- Auto
- None
- Custom
For more information about how the Limit Values By settings work and how to use them, refer to this documentation.
The Old Behavior Versus the New Behavior
The enhancements make the Limit Values By behavior more intuitive based on filter location.
Previously, if a filter’s Limit Values By setting was set to Auto, it wasn’t affected by other filters in the same location that were in a lower scope, even if the columns they were based on where higher up in a drill-path.
With the enhancements, the filter is now affected by other filters in the same location that are based on a column that’s higher up in a drill path (even if they are in a lower scope).
Previously, if a filter’s Limit Values By setting was set to None, it wasn’t affected by any other filters, no matter their scope or location.
With the new enhancements, no matter what a filter’s limit values by setting is set to, it will always be affected by all filters from different locations of the same scope or higher unless specifically prevented by the Filter This Viz By settings.
The Bug in the Old Behavior
Previously, when you used the Custom option for Limit Values By, the list that you could select from included filter columns from a higher filter scope. For example, you could limit a dashboard filter, like Product, by a filter in the filter bar, like Product Type.
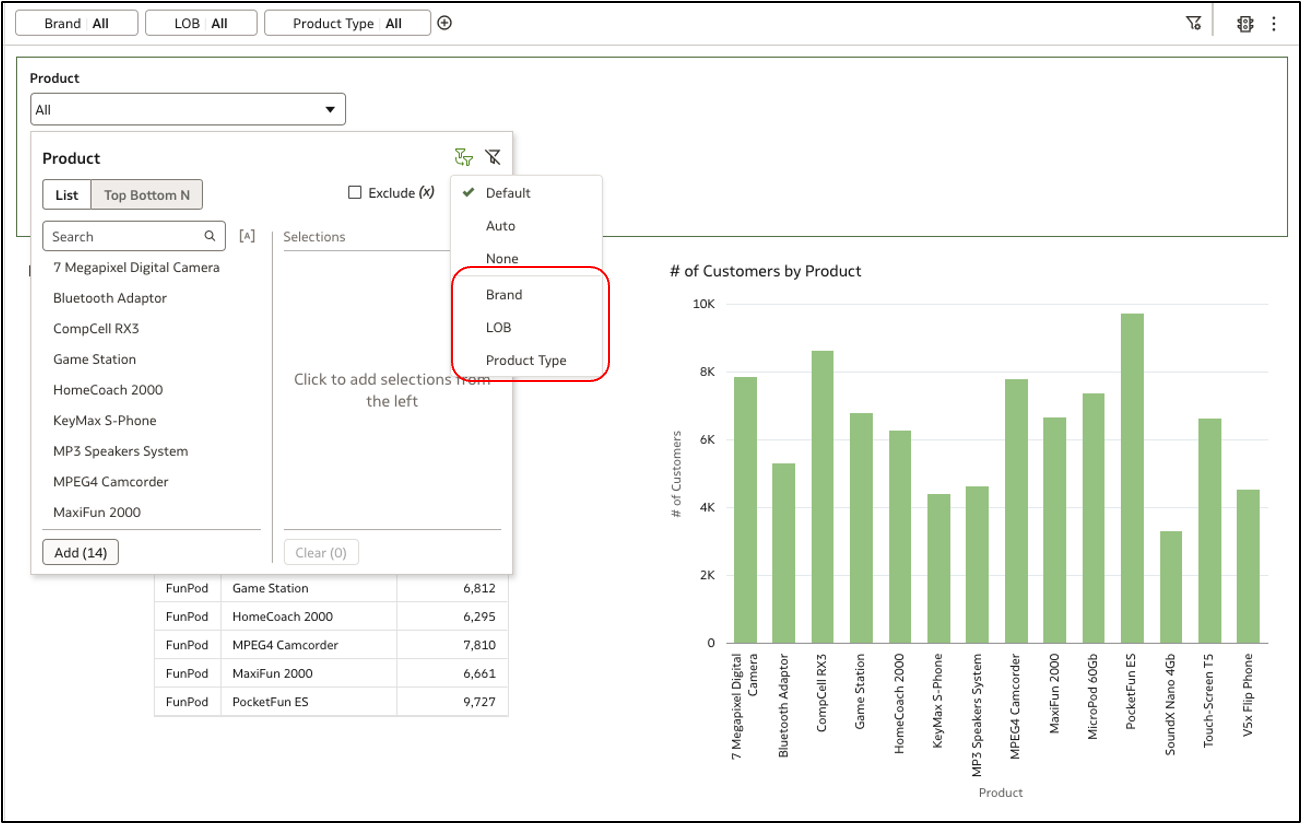
To specifically ensure that any selections made for the higher filter, Product Type, don’t impact the dashboard filter, you would use the Filter This Viz By property for the dashboard filter visualization and deselect Product Type there.
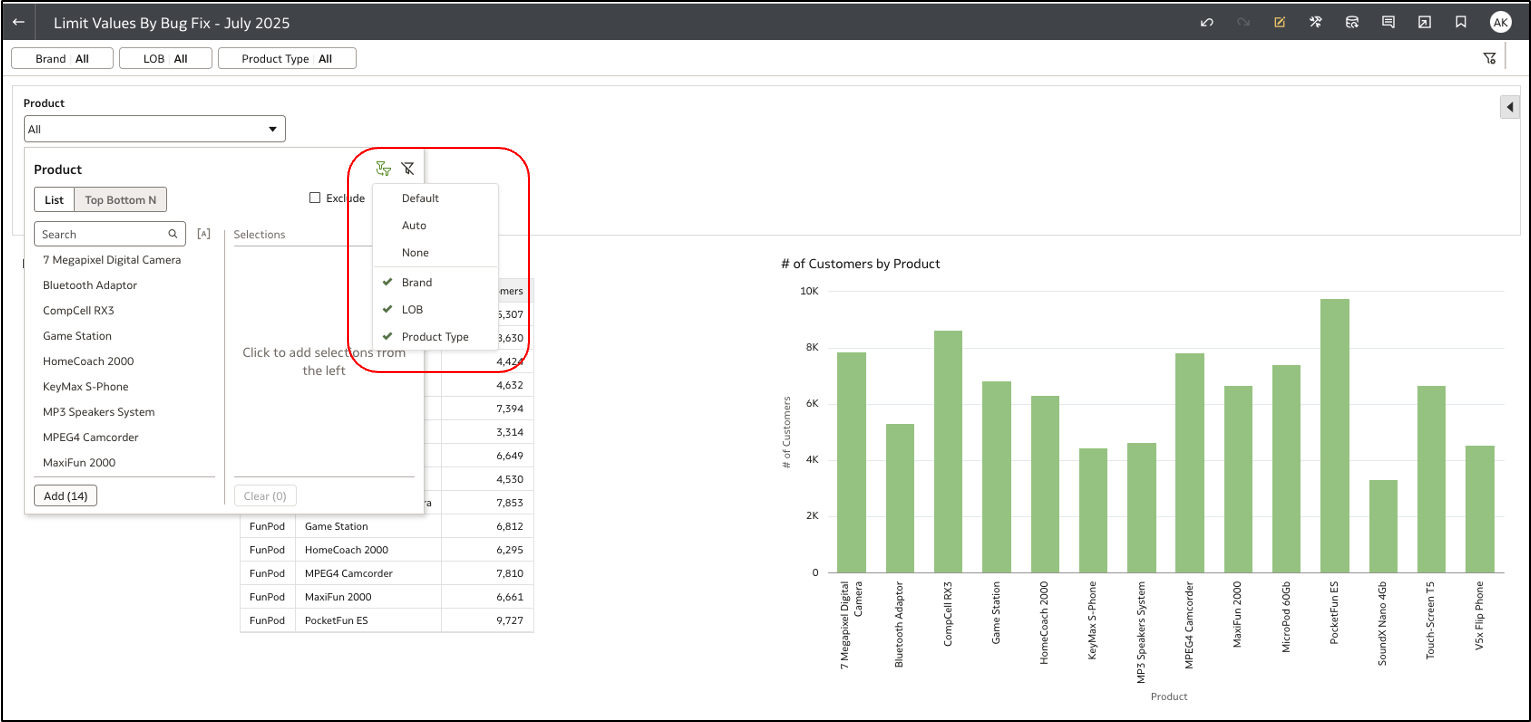
However, the bug allowed consumers to override your Limit Values By settings in this situation.
Since they could access the Limit Values By setting for the dashboard filter, they could manually add the filter bar columns back to the custom list by selecting them, thus breaking your intended filter relationships.
The Bug Fix and Impact on Existing Workbooks
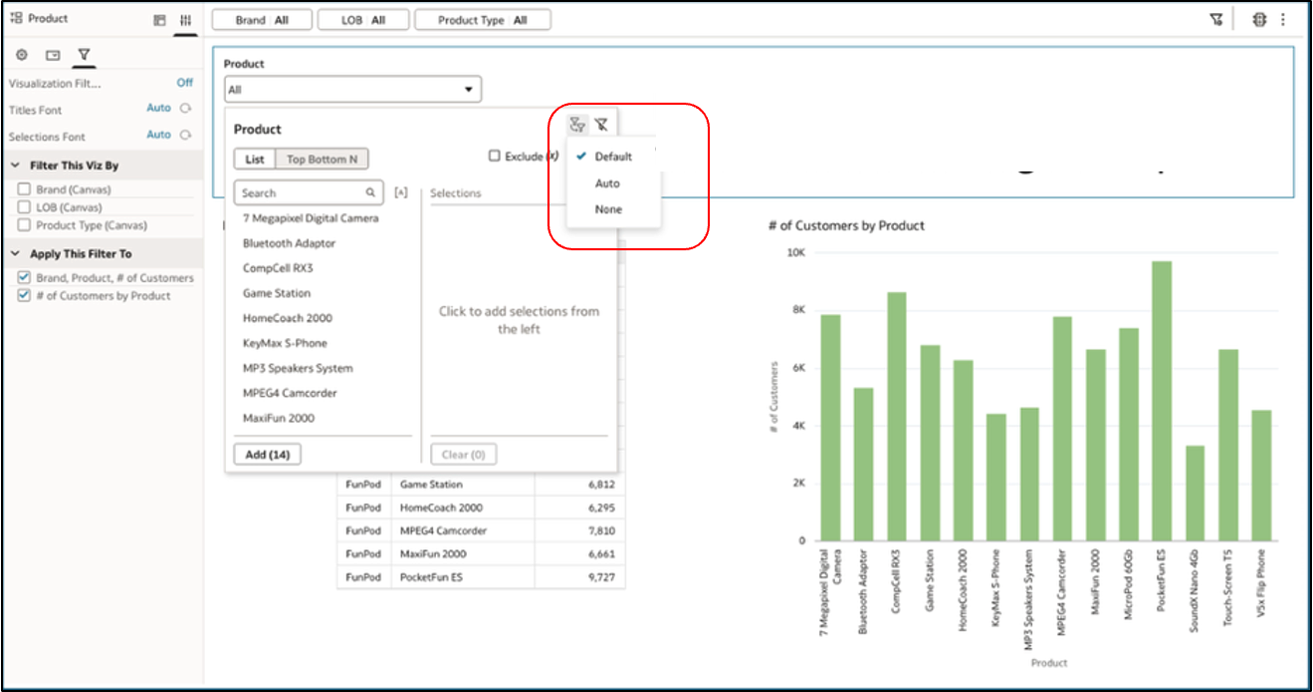
The enhancements fix the bug by restricting the custom option to filters in the same location only.
This ensures you maintain full control over filter interactions and prevents consumers from bypassing your intent as an author. This new behavior is also more intuitive by ensuring the Filter This Viz By property and Limit Values By settings don’t conflict with each other.
This bug fix will impact workbooks that meet all the following conditions:
- The Filter This Viz By property for a dashboard filters visualization is configured to prevent filters in the filter bar from affecting the filters in the visualization.
- The Limit Values By option for the dashboard filters visualization is set to Custom.
- The Custom list includes filter bar filter columns.
With the new behavior, the Custom list will no longer display filters from higher locations which could potentially leave the dashboard filter with no filters in its Custom list. Additionally, a different set of values may be shown for the dashboard filter than expected.
How to Fix Affected Workbooks
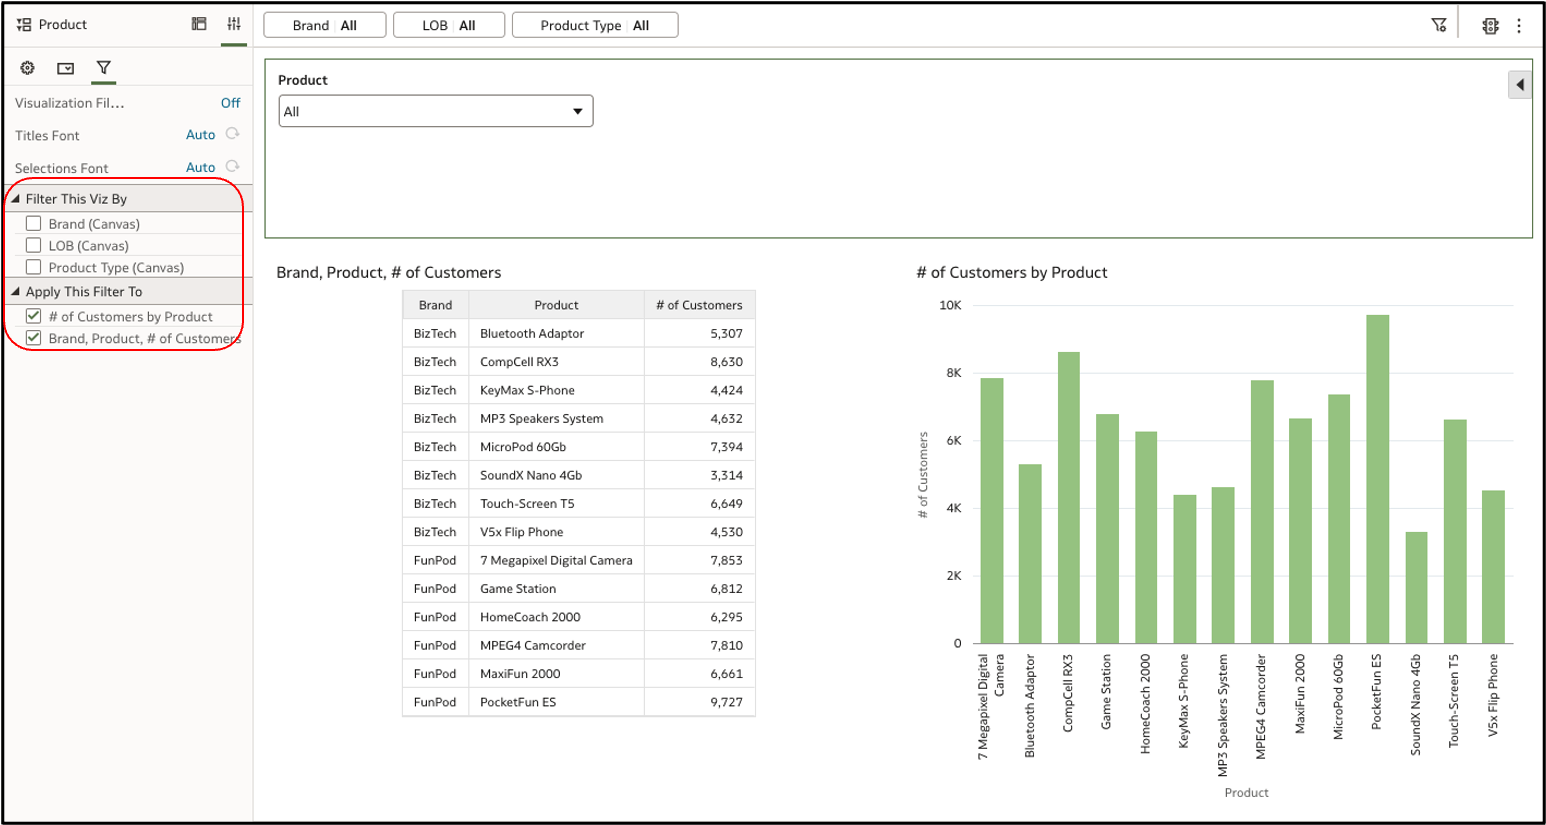
You can use the Filter This Viz By property for the affected visualization to prevent filters from a different location with the same or higher scope from having an effect.
- Open the affected workbook.
- Select the affected visualization.
- Go to the Properties pane and click the Filters tab.
- In Filter This Viz By section, select the filter columns you want the visualization to be filtered by.
- Save the workbook.
Rollout Plan
Oracle is rolling out the enhancements to the Limit Values By settings in phases to give you time to adjust.
Oracle Analytics Cloud Customers
- July and September 2025 update: A new Console setting—Enable Enhancements to Limit Values By—is OFF by default. Customers can turn this setting ON to test the new behavior.
- November 2025 update: The Console setting is ON by default. Customers can turn this setting OFF to temporarily retain the old behavior while they fix workbooks.
- March 2026 update: The Console setting will be removed and the new behavior is permanent.
Oracle Analytics Server Customers
- March 2026 update: A new Console setting—Enable Enhancements to Limit Values By—is ON by default. Customers can turn this setting OFF to fall back to the old behavior.
Call to Action for the Oracle Analytics Community
To take full advantage of the improved usability of the Limit Values By functionality and to ensure a smooth transition, we strongly encourage you to:
- Ask your administrator to turn the Console setting on so you can test the new behavior.
- Analyze all workbooks for potential impact.
- Fix your affected workbooks using the steps provided in this article.
- Share feedback with the Oracle Analytics product team to help refine the experience.
Resources:
- Watch this video for a demonstration of the Limit Values By functionality.
- For more information about Oracle Analytics go to https://www.oracle.com/business-analytics/
- For documentation, visit the Oracle Help Center.