Sporting Legends! Extreme Weather! Pop-Culture Stars!
Submissions for the Oracle Analytics Data Visualization Challenge 2025 really did cover it all.
“I am really proud of all the customers, partners and employees, for participating in the first global Oracle Analytics Data Visualization Challenge ever! Seeing the success of the competition and judging the entries showed the amazing skillset of our community using Data, Analytics and AI. Thank you to competition lead, Madeleine Groeger-Wilson, and all of the participants!”
Benjamin Arnulf, Senior Director, Oracle Analytics Customer Community
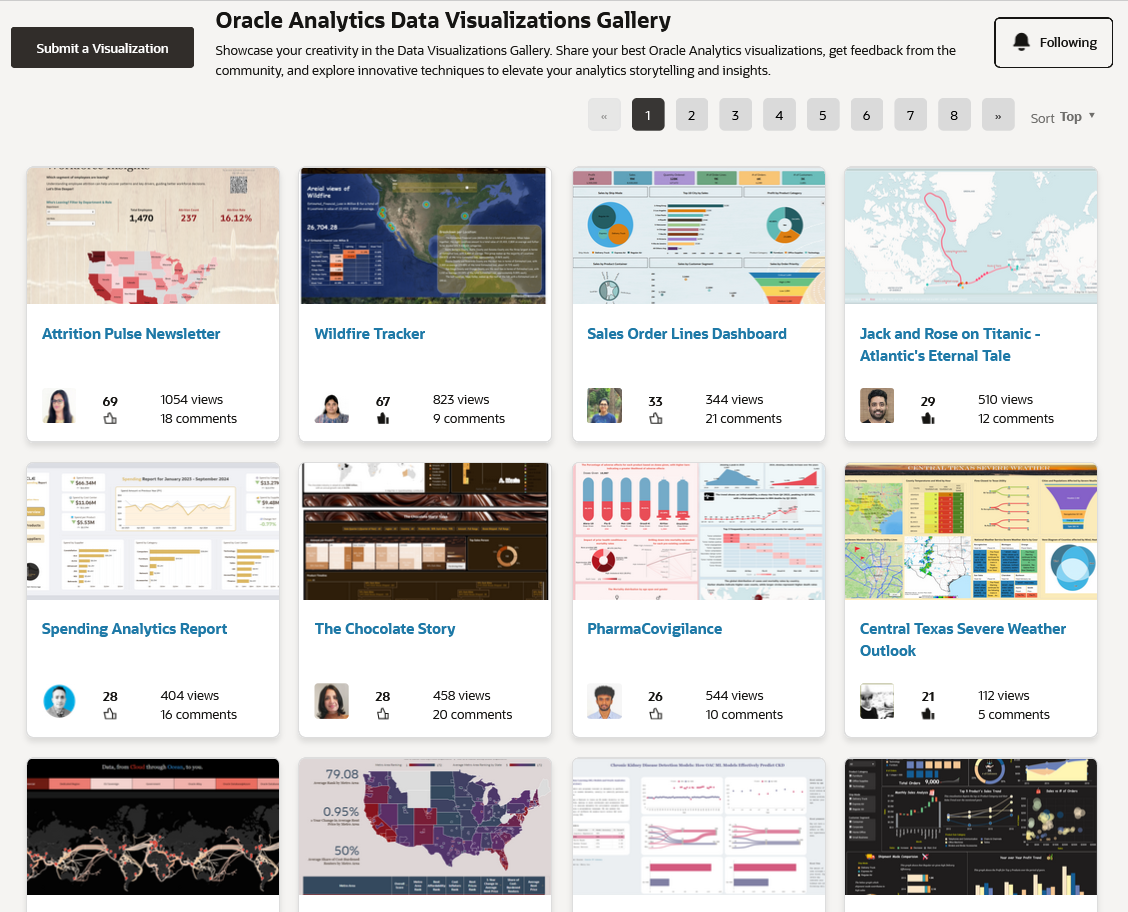
Creating everything from detailed business dashboards to high-impact interactive infographics, the Oracle Analytics Community showcased the best of Oracle Analytics Cloud’s (OAC) capabilities. Just 6 weeks saw Oracle customers, partners and employees – plus some keen university students – from across the globe transform their data assets into works of analytics art that you can see hosted in the community Analytics Data Visualization Gallery.
“It was so inspiring to see the wide range of topics and designs all of our participants created. They truly showed how data visualizations can illuminate truths and tell stories. Thank you to the community for showing us your imagination, pushing what OAC can do, and shedding light on how we can enhance OAC even more. Well done!”
Winston Wang, Vice President, Oracle Analytics User Experience & Design
From more than 150 entries, some visualizations stool out from the crowd!
Meet the Winners of the Oracle Analytics Data Visualization Challenge
Community Winners
Auto Insurance Customer Retention | Dan Bunker, Ethan Lang, Rafael Simancas & Felicia Styer
F1-Champions Face to Face | Carlos Megia, Pol Òliva Martínez & Daniel Bueno
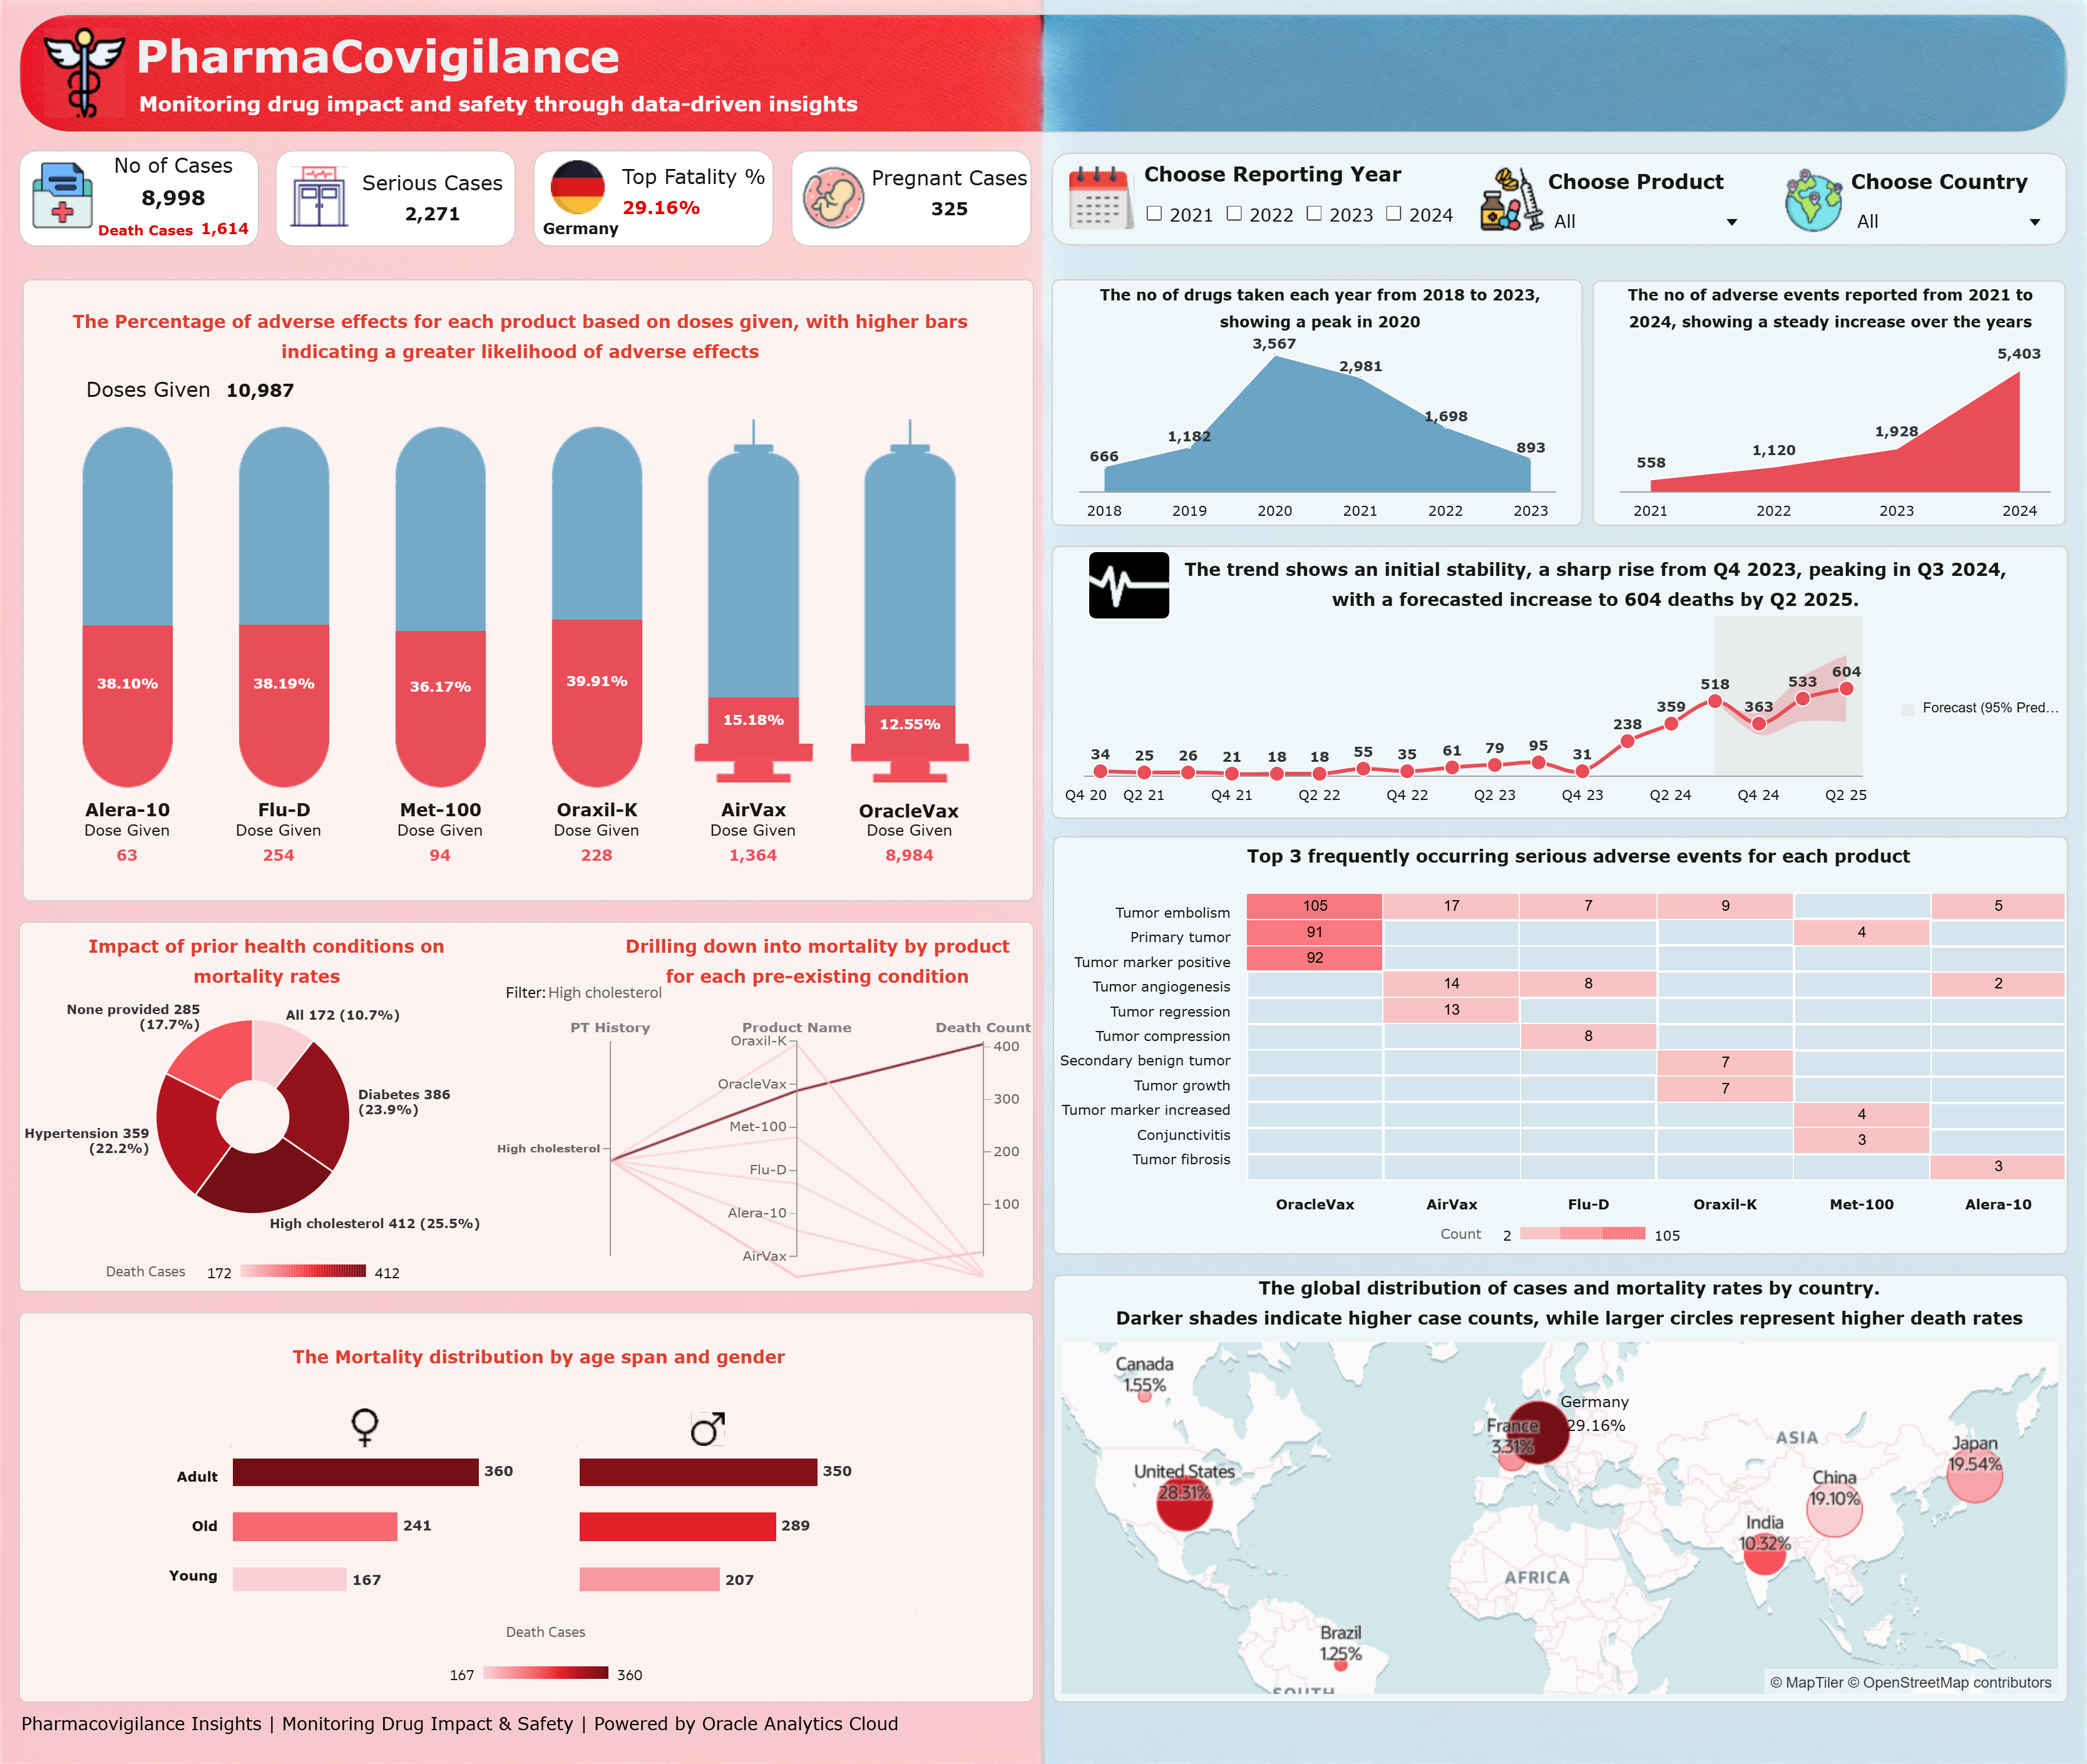
Pharmacovigilance | Kaliraj Ramu
3PT Revolution | Rudy Juarez
Driver Comparison | Philip Godfrey, Angel Armingol, Cian Durnan, Colm McCarthy, David Pedro, Mayara Alves & Jason Beattie
Wildfire Tracker | Sravani Raavi
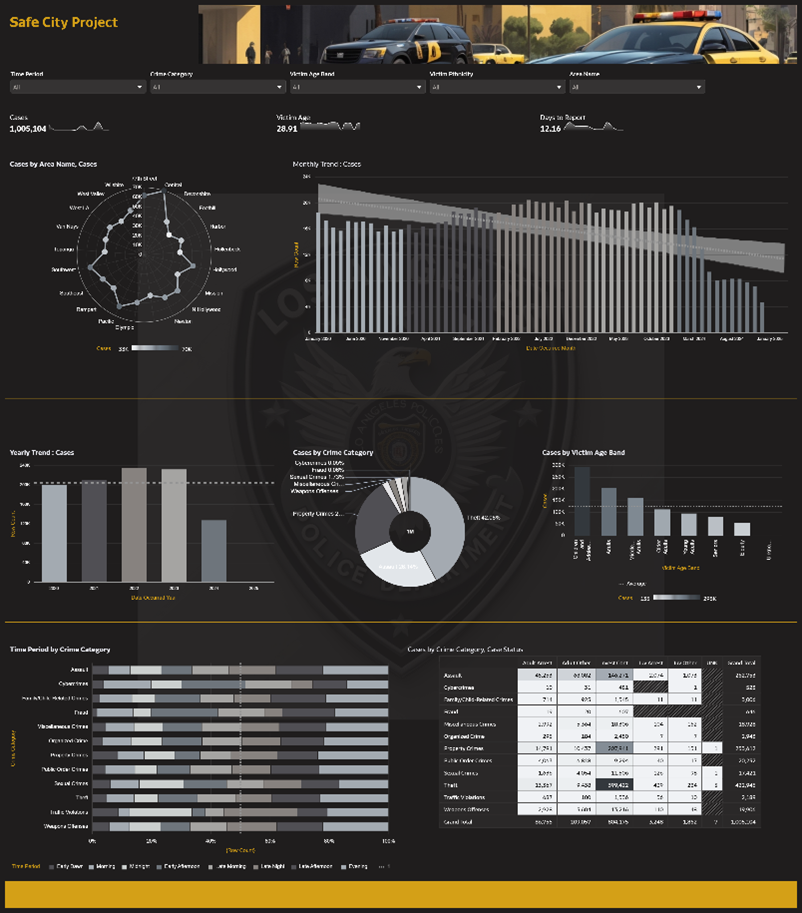
Safe City Report | James Lomotey
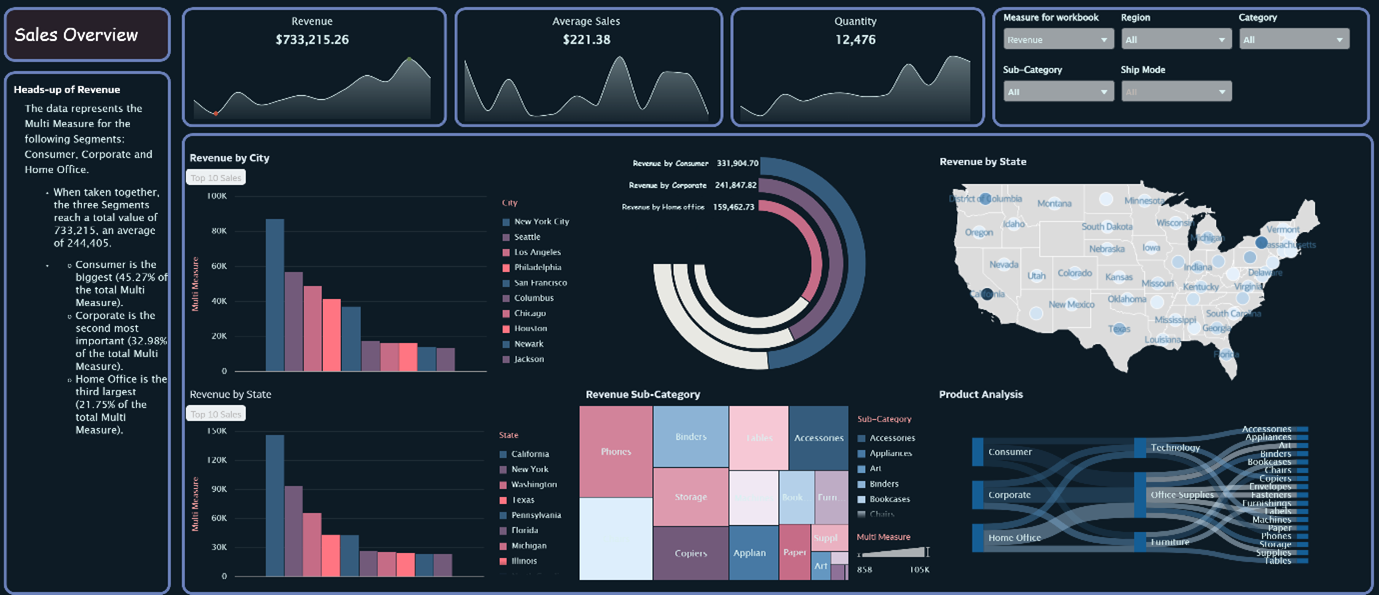
Sample Superstore Overview | Huzaifa Saifee
Sales Analysis | Sowmiya Ranganathan
Life Sciences: Patients Dashboard | Debasmita Das
Oracle Winners
Attrition Pulse: Mapping Workforce Insights | Anisha Patra
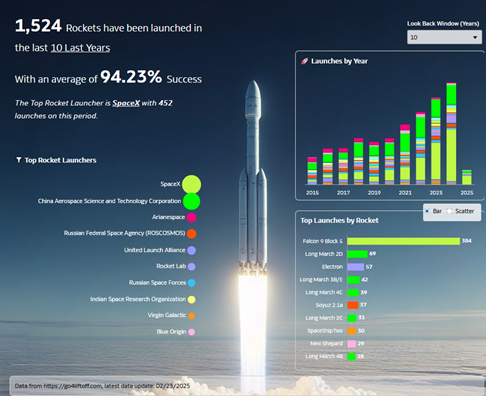
Space Launches | Patrick Goubet
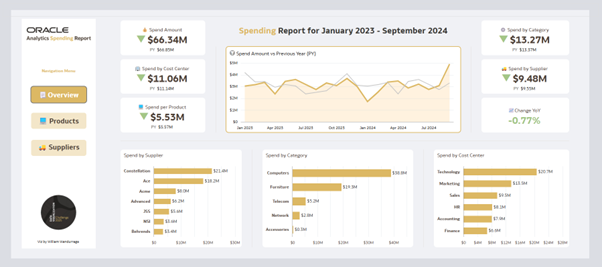
Spending Analytics Report | William Wandurraga
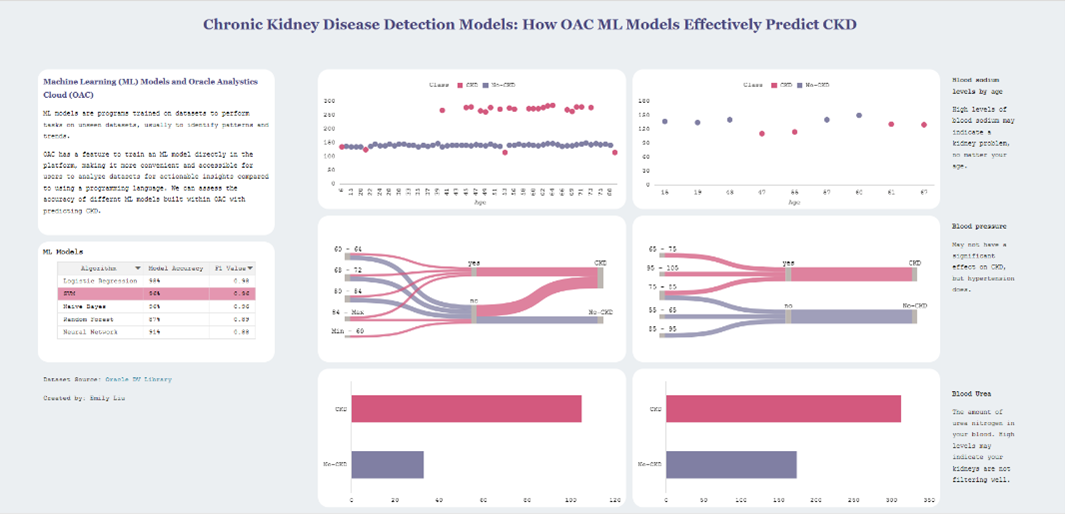
Chronic Kidney Disease Detection Models | Emily Liu
Titanic: Atlantic’s Eternal Tale | Gautam Pisharam
Check out their data visualizations and hear from them in this recording of the Oracle Analytics Live! Webinar.
“It was fantastic to see both novices learning new things and those with mastery spreading their wings. There were some advanced techniques done well that I had never even tried.”
Dave McColgin, Senior Director, Oracle Analytics User Experience & Design
Sporting Success!
Sport represented a major inspiration for many of the Challenge entries this year. With basketball, Formula 1, cricket, soccer, darts, and baseball all getting a mention, it is no surprise three of our winners elected for a Sports themed visualization!
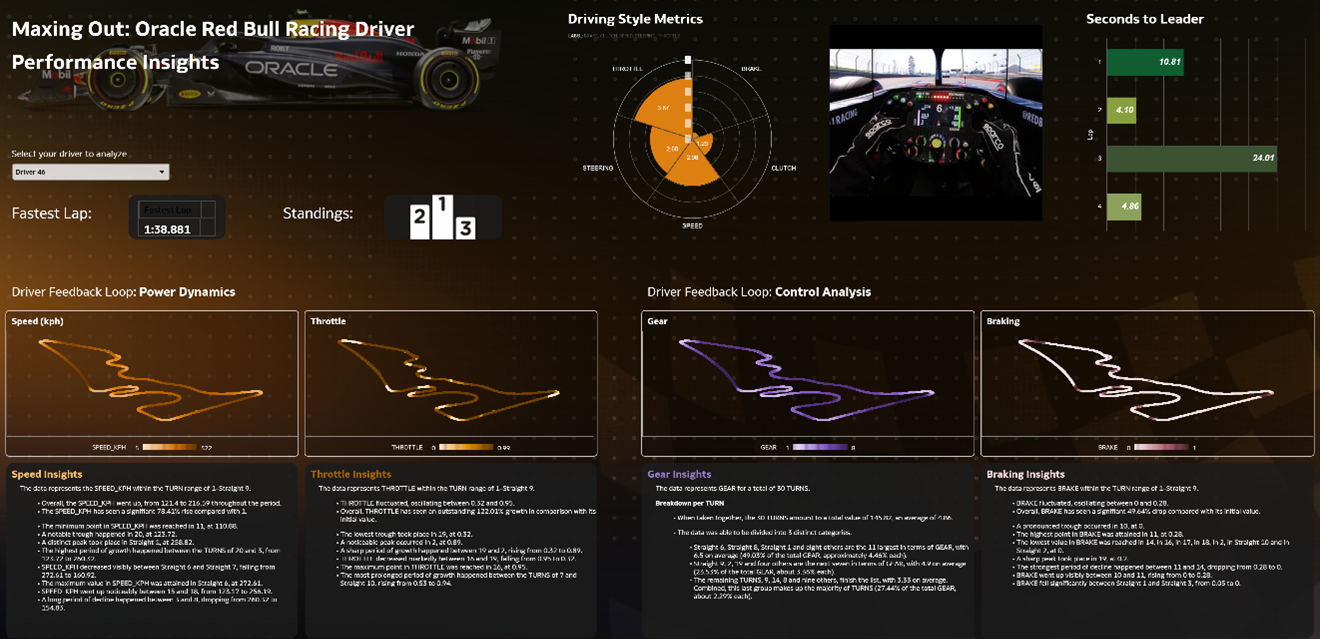
Both Carlos Megia and Philip Godfrey used Formula 1 as their inspiration, comparing the performance of drivers in their glossy sports dashboards. Below we can see Philip’s expertly designed data visualization, delivering instant insights on driver power and control dynamics contributing to their place in the race. See Philip’s visualization here.
“We really enjoyed the opportunity to experiment with features and visualizations that were new to us, as this allowed us to explore fresh possibilities for data representation and deepen our understanding of the tool. Our goal was to create a visualization that not only provides valuable insights but also connects with users on an emotional level, reminding them of the thrill and intensity of live sports.”
Carlos Megia. See Carlos’s visualization here.
Rudy Juarez decided to combine his expertise designing visual reporting and his life-long love of basketball into an indepth exploration of his favourite sporting hero! Employing a sleek dark design, custom tooltips, area charts and more, Rudy’s visualization expertly showcases how his idol pushes boundaries and stands out from the rest – much like Rudy’s entry itself!
“Bringing sports into OAC was an amazing opportunity to analyze vast quantities of data around human feats! I loved having the freedom to explore data of personal interest to me.”
Rudy Juarez.
Interactive Insights!
Standing out from the group as a first-time OAC user, Dan Bunker certainly excelled in his Oracle Analytics debut!
Dan delivered an elegant, informative series of dashboards visualizations, translating a dataset on Automotive Insurance into a compelling, interactive experience for the judges. Applying his previous experience with Tableau, Dan was pleasantly surprised by the advanced capabilities and intuitive user experience OAC provided.
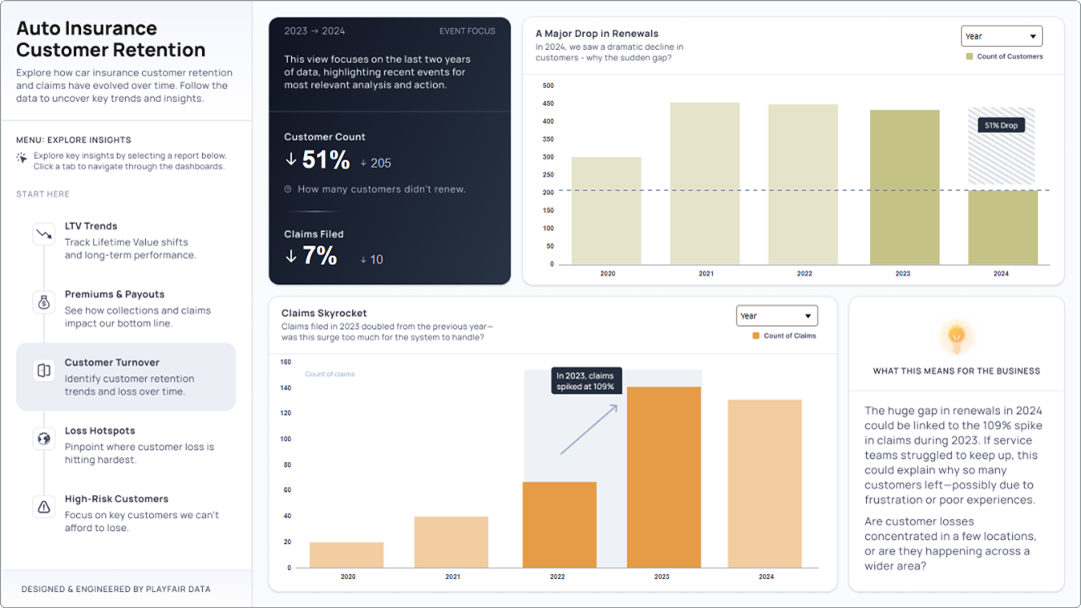
“Being a new Oracle Analytics user, I wanted to show that the visual analytics principles of design, data prep, strategy, and visual analytics engineering are universal across all data visualization tools. I enjoyed the challenge and developed a liking for the unique parameter qualities as my favourite OAC feature!”
Dan Bunker. See Dan’s visualization here.
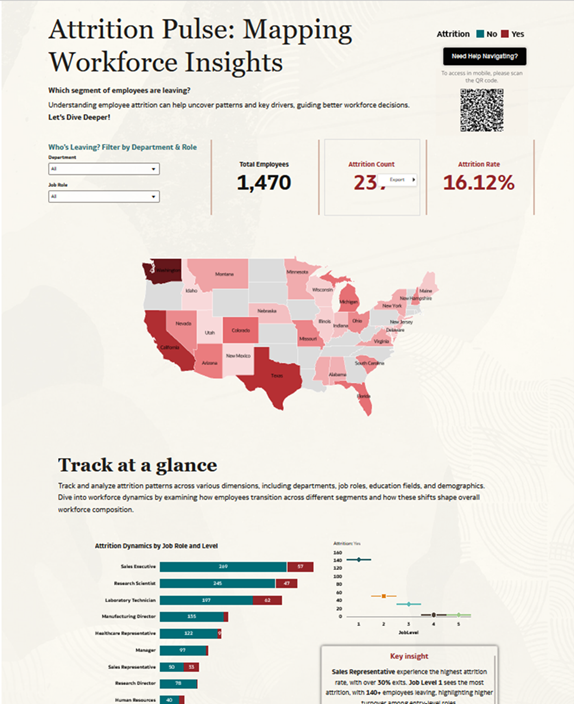
Similarly sleek, Anisha Patra’s scroll-able newsletter-style infographic expertly guides People Leaders through key data insights to help them tackle attrition issues. Walking them through employee attrition patterns, key risk factors and hidden workforce dynamics, this infographic not only got points for leveraging some of the latest OAC capabilities, but also for making moves to help business leaders proactively address their key challenges! See Anisha’s visualization here.
Security and Science!
Two visualizations had public safety at the heart of their designs. James Lomotey and Sravani Raavi both created striking visualizations helping emergency forces respond to disaster, with Sravani focusing on trends in wildfire devastation.
“Analytics has been my core skill since I started my career – I enjoy displaying numbers and figures in more beautiful, impactful way. When I came across wildfire incidents happening around the globe, I wanted to explore how OAC could help predict trends to help first responders anticipate future incidents.”
Sravani Raavi. See Sravani’s visualiztion here.
James’s dashboard focused on helping police and policy makers to identify trends in crime patterns, high-risk locations, and temporal fluctuations, laying the foundation for data-driven decision-making on crime prevention. See James’s visualization here.
From our Oracle winners, Patrick Goubet delivered a dynamic data visualization tracking rocket launches over the past decade. This visualization incorporates responsive charts and text that adjust to audience filter selections and is designed for use on the Oracle Analytics Mobile App for a seamless experience wherever it is viewed! See Patrick’s visualization here.
Healthcare Heros!
Improving drug efficacy and supporting patient care outcomes was a popular choice for Data Visualization submissions. Debasmita Das won her place in the winner’s circle with a dashboard designed to highlight critical patient information for medical practitioners and leaders, containing insights on patient demographics, vaccine use and recovery cases.
“Without visualization, data has no meaning. For the complex organizational data that gets accumulated in the source over years, data visualization provides actionable insights and helps in better decision-making.”
Debasmita Das. See Debasmita’s visualization here.
Kaliraj Ramu also created a visualization aimed at enhancing patient outcomes through his Pharmacovigilance infographic. This work helps healthcare professionals, regulators, and pharmaceutical companies to monitor adverse effects, detect trends, and ensure compliance when developing life-saving treatments. See Kaliraj’s visualization here.
Finally, one of our winners combined healthcare requirements and OAC’s machine learning capabilities to showcase the art of the possible. Emily Liu’s data visualization looks at the potential of machine learning to predict devastating diseases to support early intervention. Emily’s impactful entry showcases how even BI beginners can leverage advanced techniques thanks to OAC’s intuitive design. See Emily’s visualization here.
Sales and Spending!
With developing high quality workbooks for business leaders being a key talent in the Oracle Analytics Community, no wonder we saw some excellent examples of sales dashboards come to the front in this Data Visualization Challenge.
Huzaifa Saifee and Sowmiya Ranganathan both applied OAC’s capabilities to provide top quality insights for sales leaders and business stakeholders. Huzaifa’s dashboard highlights key metrics around revenue, average sales, and quantity, while giving viewers additional insights through his use of Narrative Language. See Huzaifa’s visualization here.
Sowmiya’s submission also informs business stakeholders with key trends around sales, product lines and customer segmentation, expertly balancing data-dense charts and eye-catching iconography.
“I enjoyed the Data Visualization Challenge as an opportunity explore more themes by using the free form functionality incorporating both images and charts to convey my story. I feel data viz acts as a bridge between raw data and understanding capability of human. Visually representing the data helps us to interact more with it and also involves logic and creativity.”
Sowmiya Ranganathan. See Sowmiya’s visualization here.
Shifting the focus to spending, William Wandurraga provides a crisp, clean dashboard for finance users to track and manage their financial habits. Incorporating a range of charts, streamlined navigation and conditional formatting for easy comprehension, William’s dashboard is a dream for business stakeholders. See William’s visualization here.
Data Storytelling
While each entry tells a story, few entries combine storytelling and visualization as literally as Gautam Pisharam. Taking one of the world’s most beloved tales and transforming it into a visualization, Gautam expertly tracks the course of the ill-fated Titanic and its impending iceberg – leveraging OAC’s Geometry Data Type. As both objects progress, Gautam layers emoticons tracking sentiment changes of the passengers and characters we all know and love, in a simple yet powerful data visualization canvas.

“I love visualizing data and I wanted to paint a historical emotional journey on a modern technology canvas in a minimalistic way. This visualization represents the impact of maps and spatial technology for powerful storytelling.”
Gautam Pisharam. See Gautam’s visualization here!
Even more to see!
The Community Gallery is open to all! Make sure to upload your visualizations and get inspired by works from other Oracle Analytics users, in the run up to the next Data Visualization Challenge…
For questions on the Data Visualization Challenge, contact competition lead, Madeleine Groeger-Wilson.