The Oracle Analytics Cloud (OAC) January 2025 Update opens the new year with advanced enhancements for business users, dashboard authors and data administrators. With new AI profiling capabilities for insight generation, and an expanded list of data modelling sources supported, Oracle Analytics has many new features to explore.
Featured highlights:
Augmented analytics and machine learning
- New AI-powered insights: Contextual Insights for business users
- Accelerated data profiling: Enhanced explain functionality
- Responsive insight generation: Auto-insights now responds to dashboard filters
Data connectivity, modelling and preparation
- Expanded modelling capabilities: Semantic modeler support for EPM Cloud and Essbase
- Faster data import: Simultaneous multi-sheet upload for datasets
Exploring, dashboarding, and storytelling
- Enhanced curation controls: Hidden columns for dashboard consumers
- Expanded conditional formatting: Conditional formatting for attributes
- Increased collaboration: Shareable watchlists to communicate KPIs
Augmented analytics and machine learning
Oracle Analytics users can expect a variety of new and enhanced features designed to generate high quality, highly relevant insights on their data.
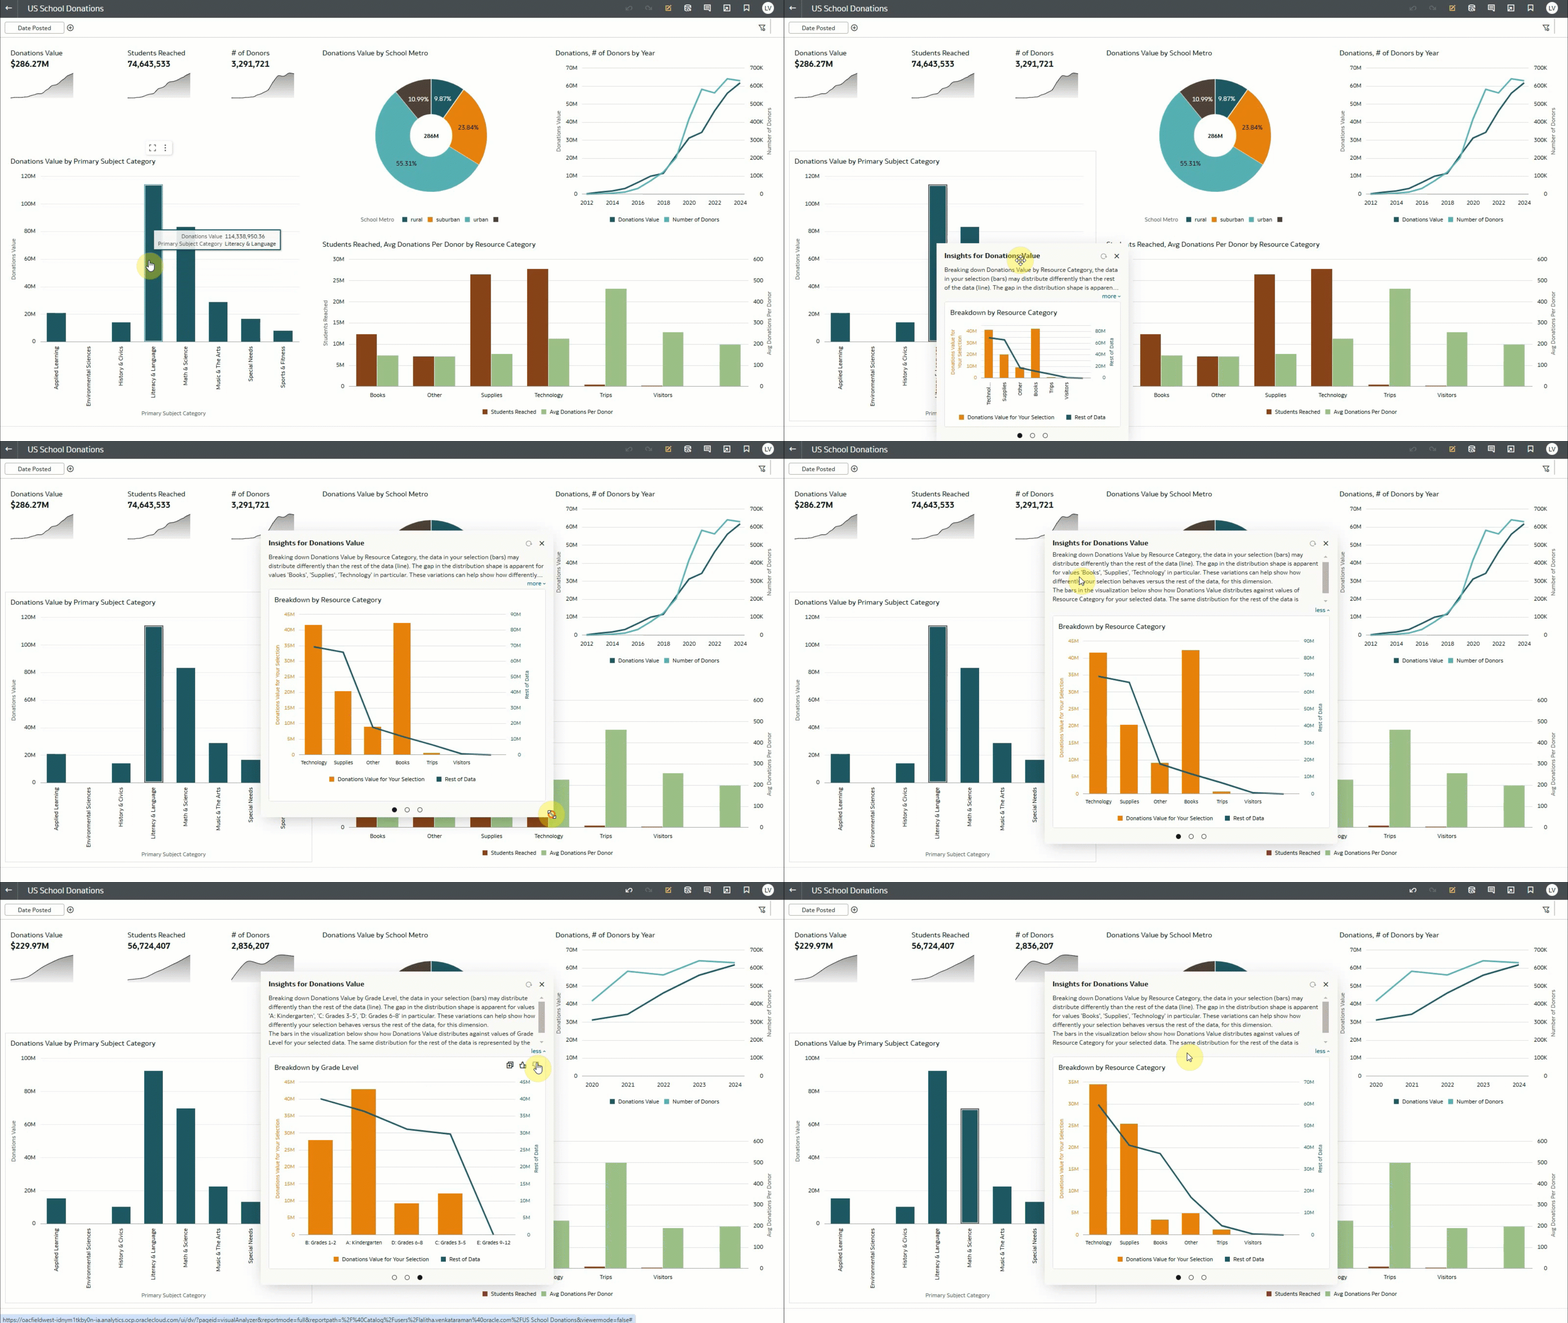
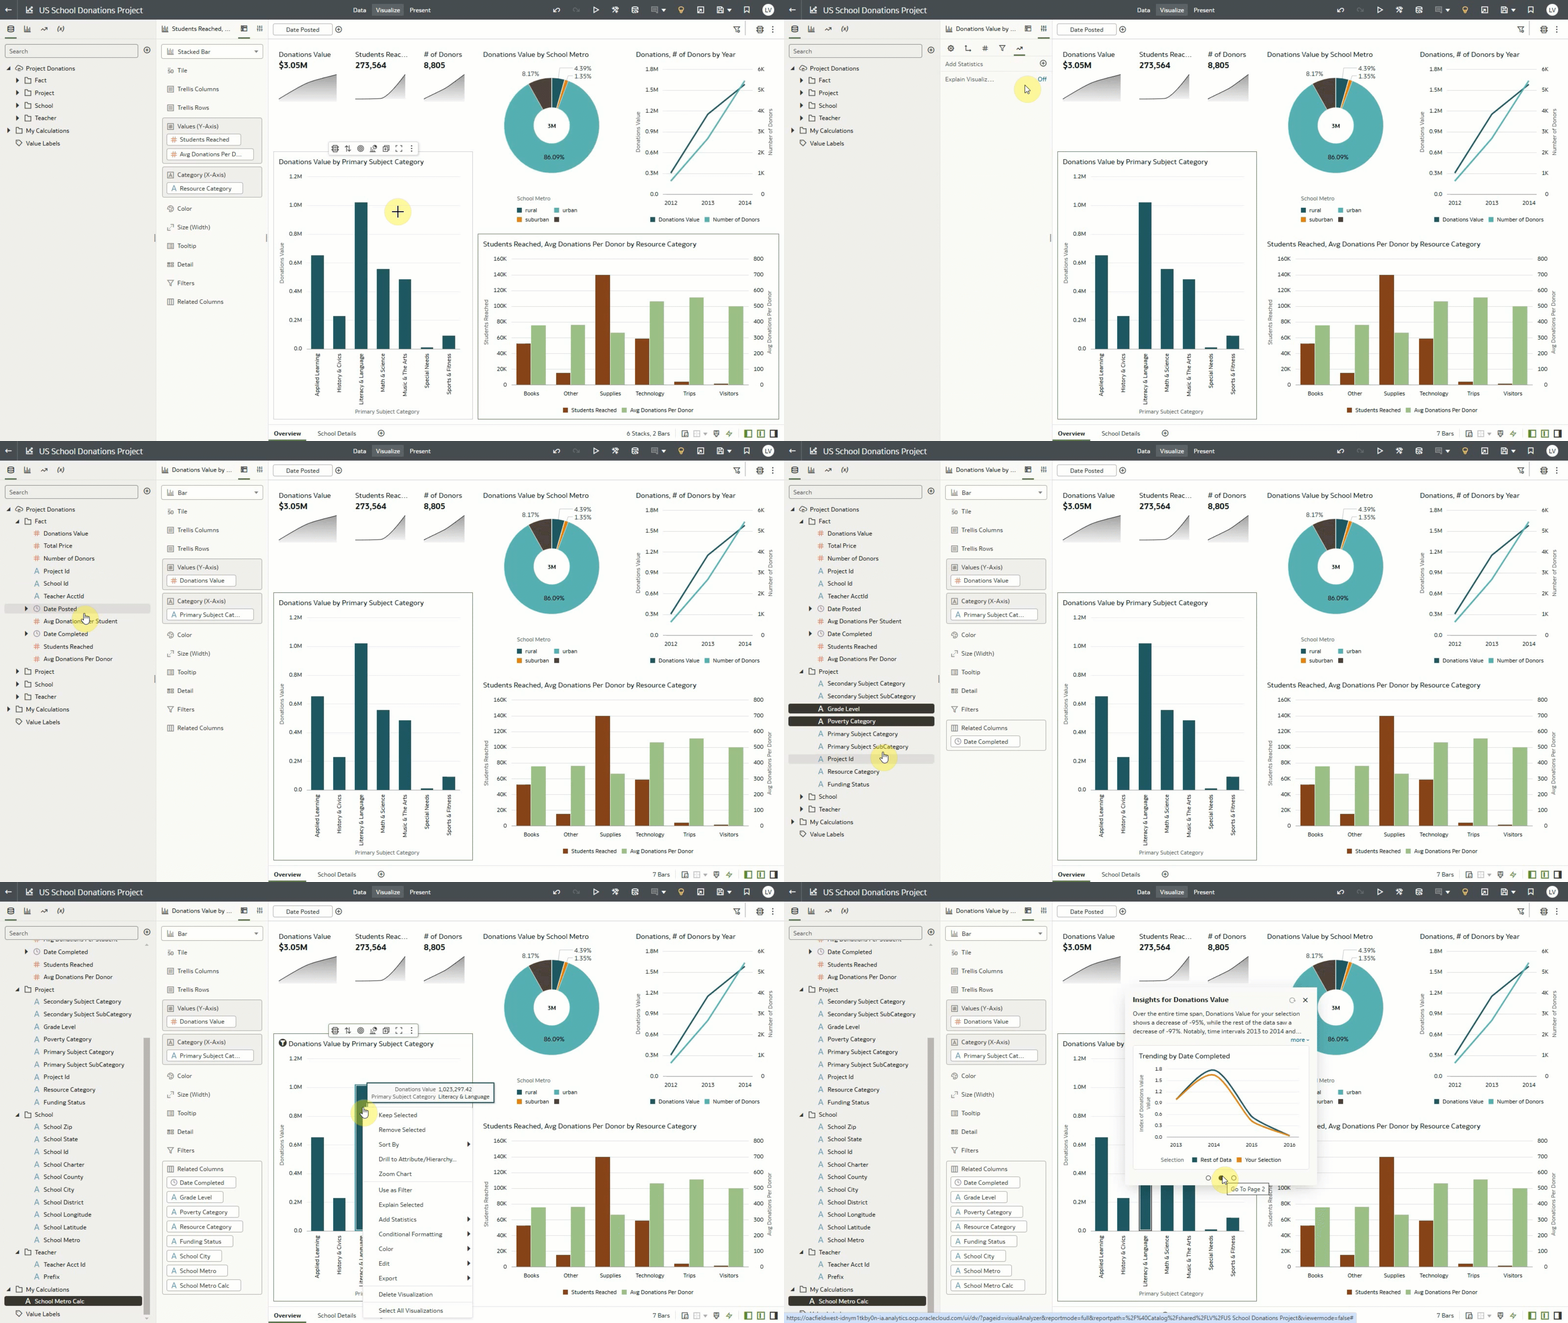
The January 2025 Update introduces Contextual Insights to OAC users. These AI-generated insights can provide business users valuable insights on how their selected data point(s) differ from the rest of their data.
Functioning on both subject areas and datasets, contextual insights can uncover hidden trends and patterns within the data, complete with a textual description and new visualization chart which can be easily added to a workbook or watchlist. The underlying AI is not only designed to prioritize the most relevant insights but also responds to new filters and generates new insights based on the consumer’s interaction with previous results. This surfaces data-driven insights that may otherwise be missed, enabling more informed decisions. Contextual Insights can be enabled and configured by workbook authors to offer maximum value to consumers.
“This new release marks a groundbreaking milestone in Oracle Analytics augmented analytics, introducing innovative consumer-facing capabilities that redefine how insights are uncovered. No longer reserved to analytics authors, AI is empowering business users—dashboard consumers—to easily explore advanced insights directly within their dashboards. This approach democratizes AI led insights discovery, making it intuitive and accessible for all users.”
– Philippe Lions, Vice President, Oracle Analytics Product Management
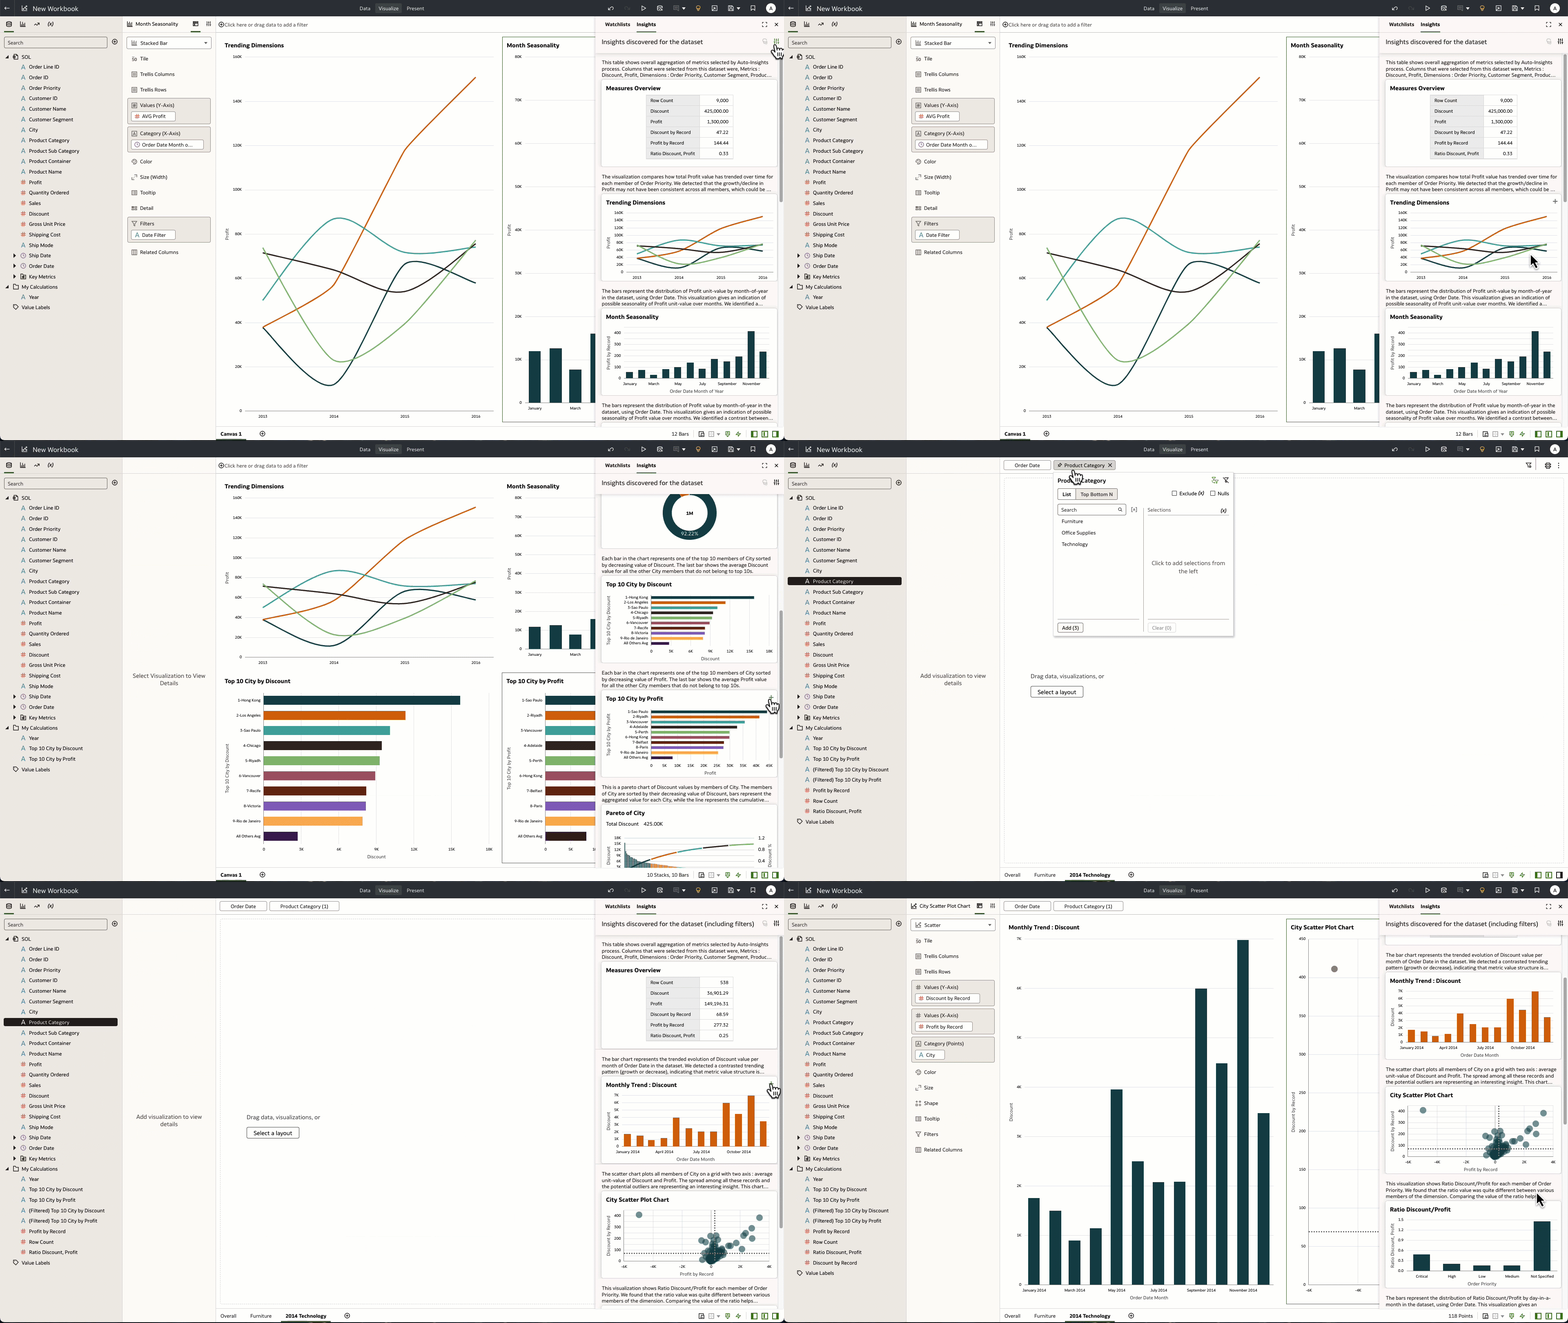
Auto Insights is also enhanced in this update to provide filter-aware results. Upon adding date or category filters onto their canvas, users can now refresh Auto Insights to generate a new series of visualizations based on the new profile of their data.
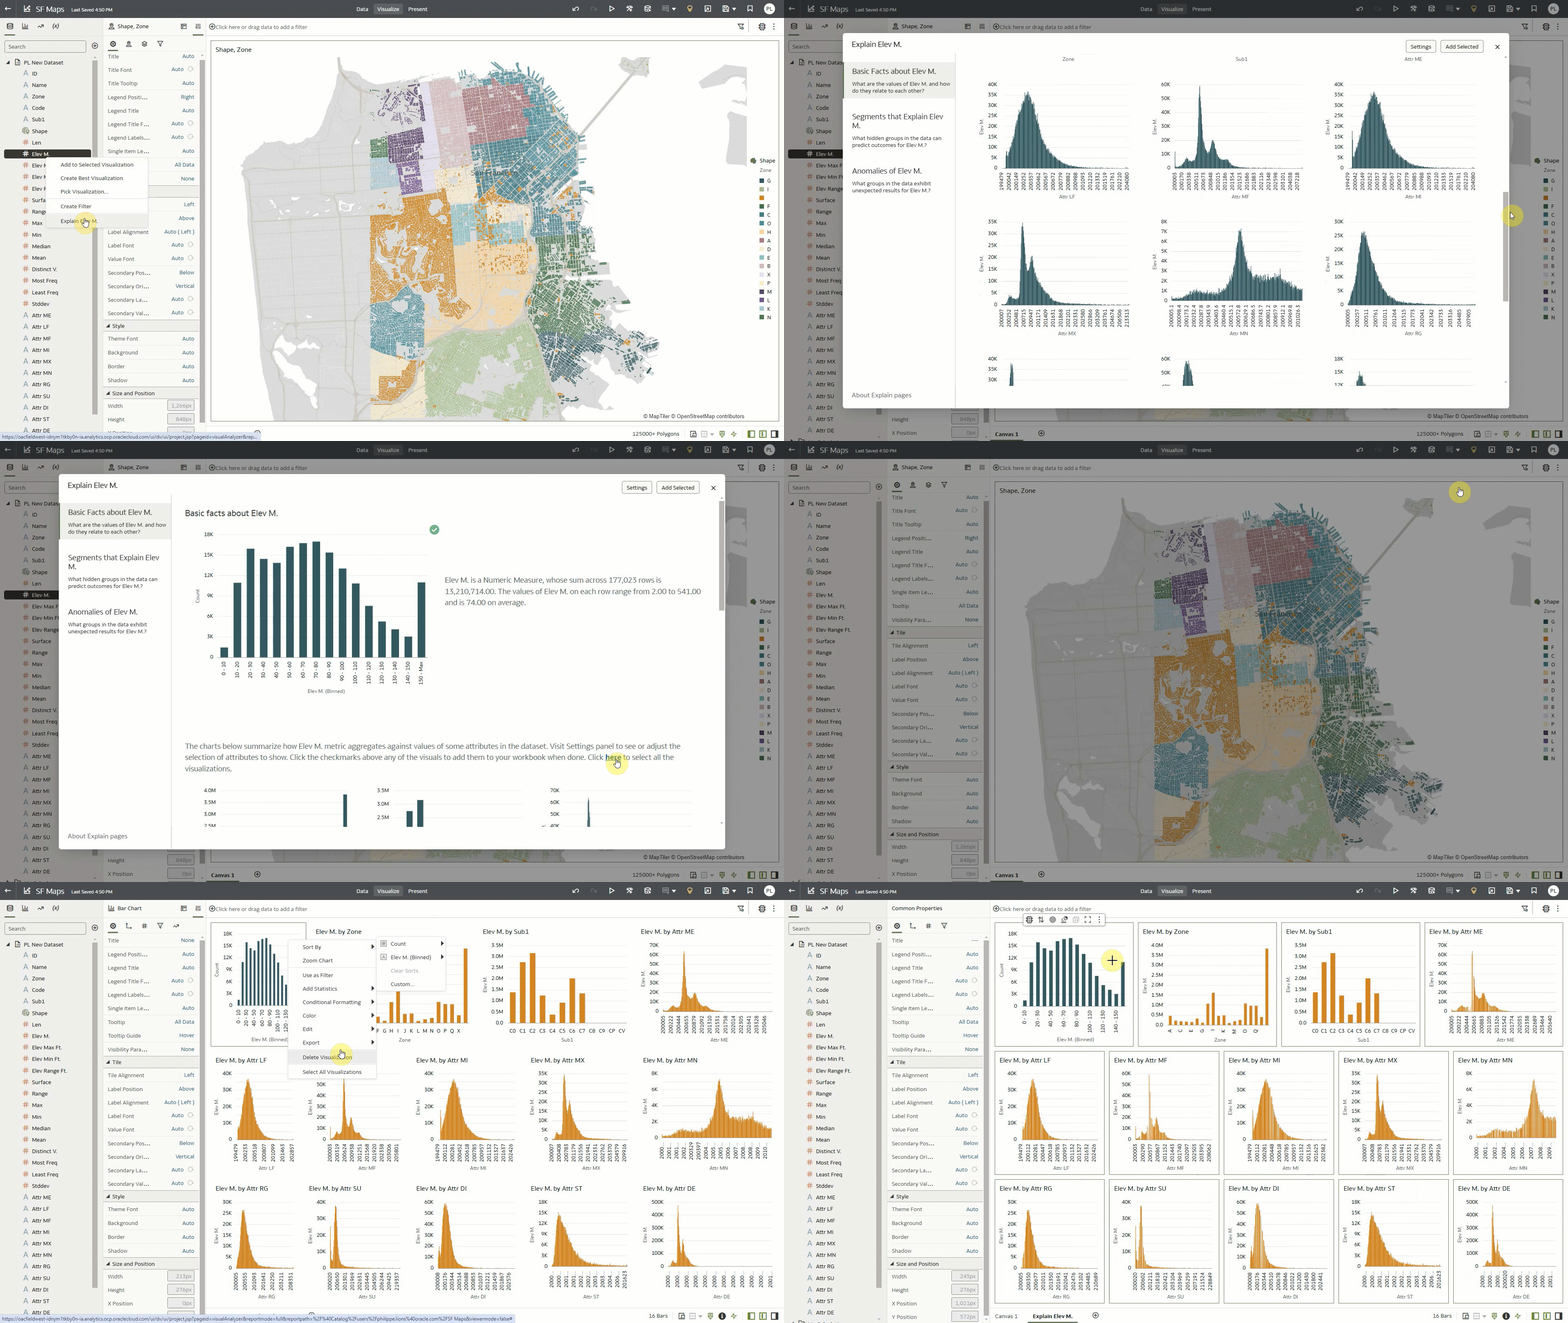
Enhancements to the Explain functionality within a workbook allow users to create a new dynamic canvas profiling their data in seconds with the ‘select all’ capability. This addition can be used to accelerate a user’s analysis by delivering a comprehensive overview of descriptive statistics and advanced key driver analysis on any column within a dataset, in a matter of clicks.
Data connectivity, modelling, and preparation
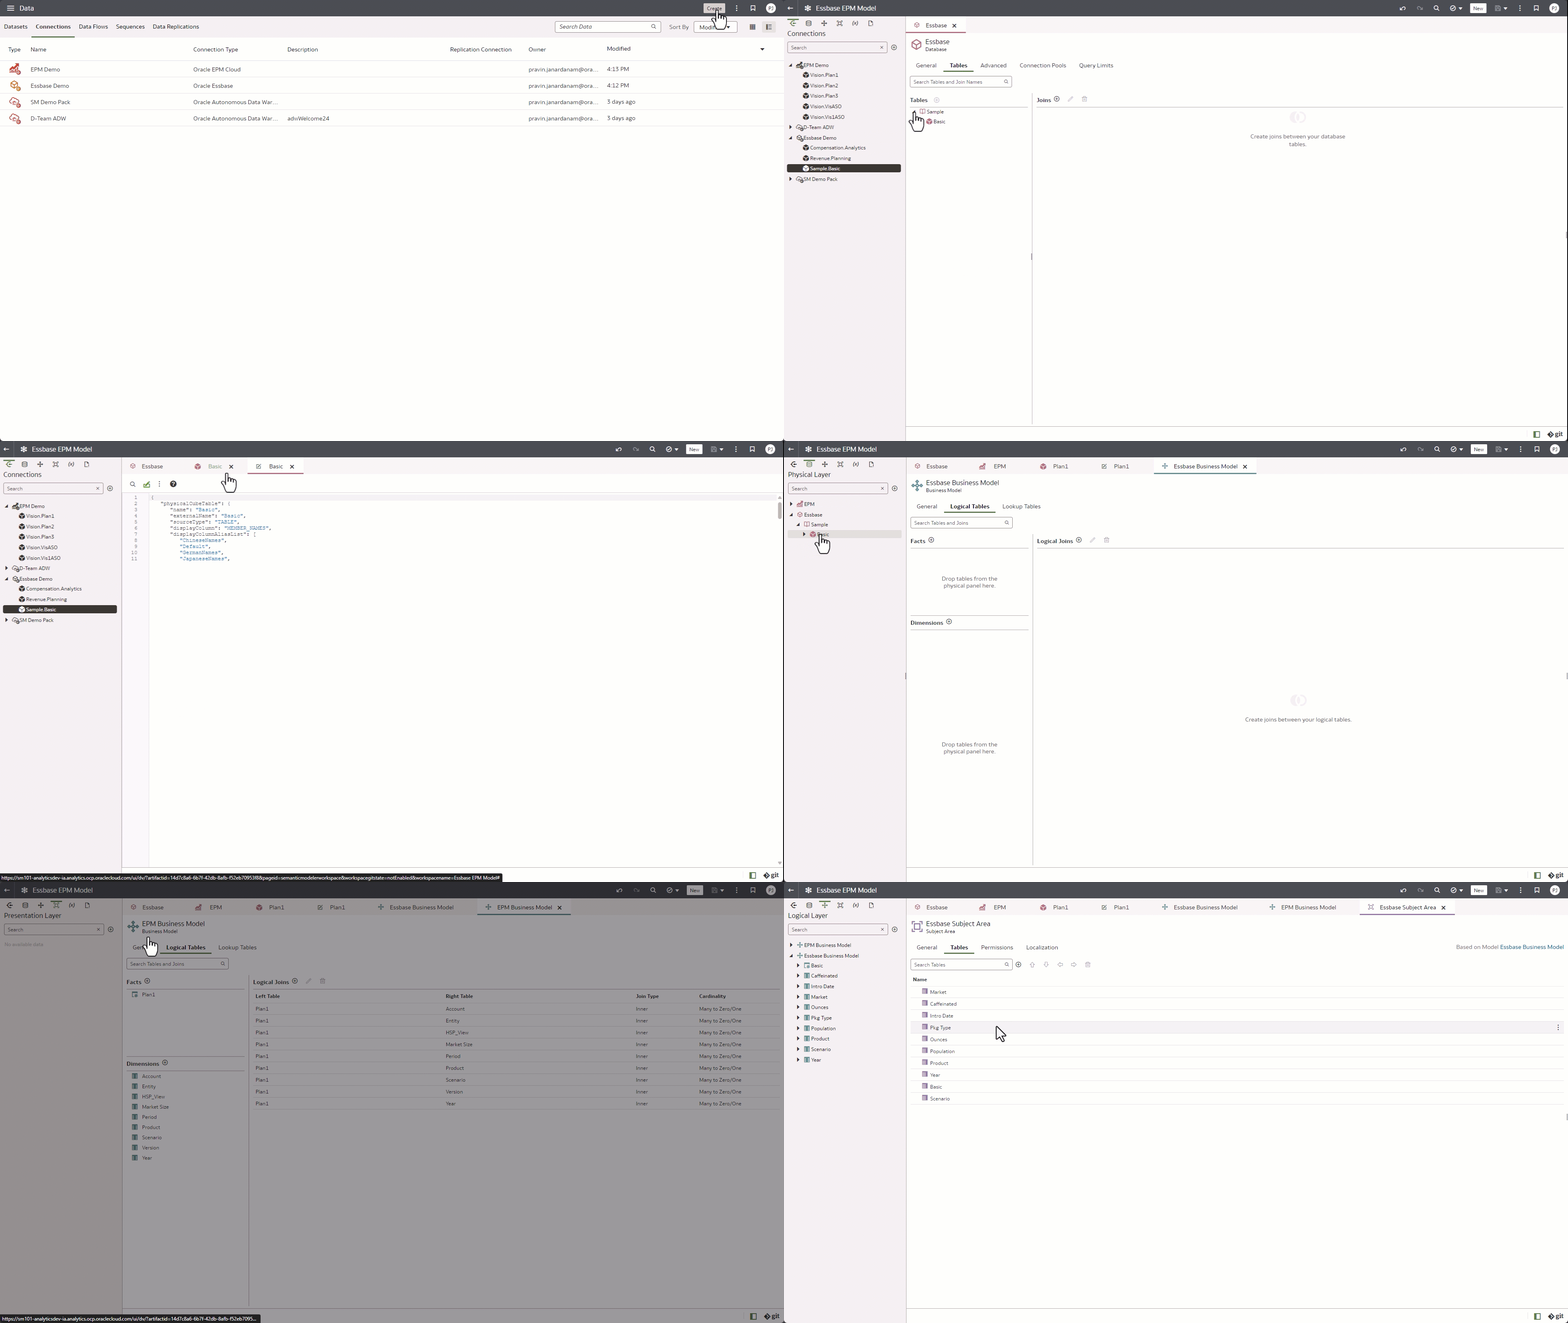
OAC’s Semantic Modeler now supports data modelling for EPM Cloud and Essbase cubes. Administrators can easily connect and add EPM and Essbase elements into their semantic models with OAC by seamlessly importing the dimensions and hierarchies associated with each cube. The user-friendly drag-and-drop functionality of Semantic Modeler allows the administrator to easily create the physical database, business model and subject area layers, concluding with a one-click consistency check to help ensure any errors are flagged in advance of deployment.
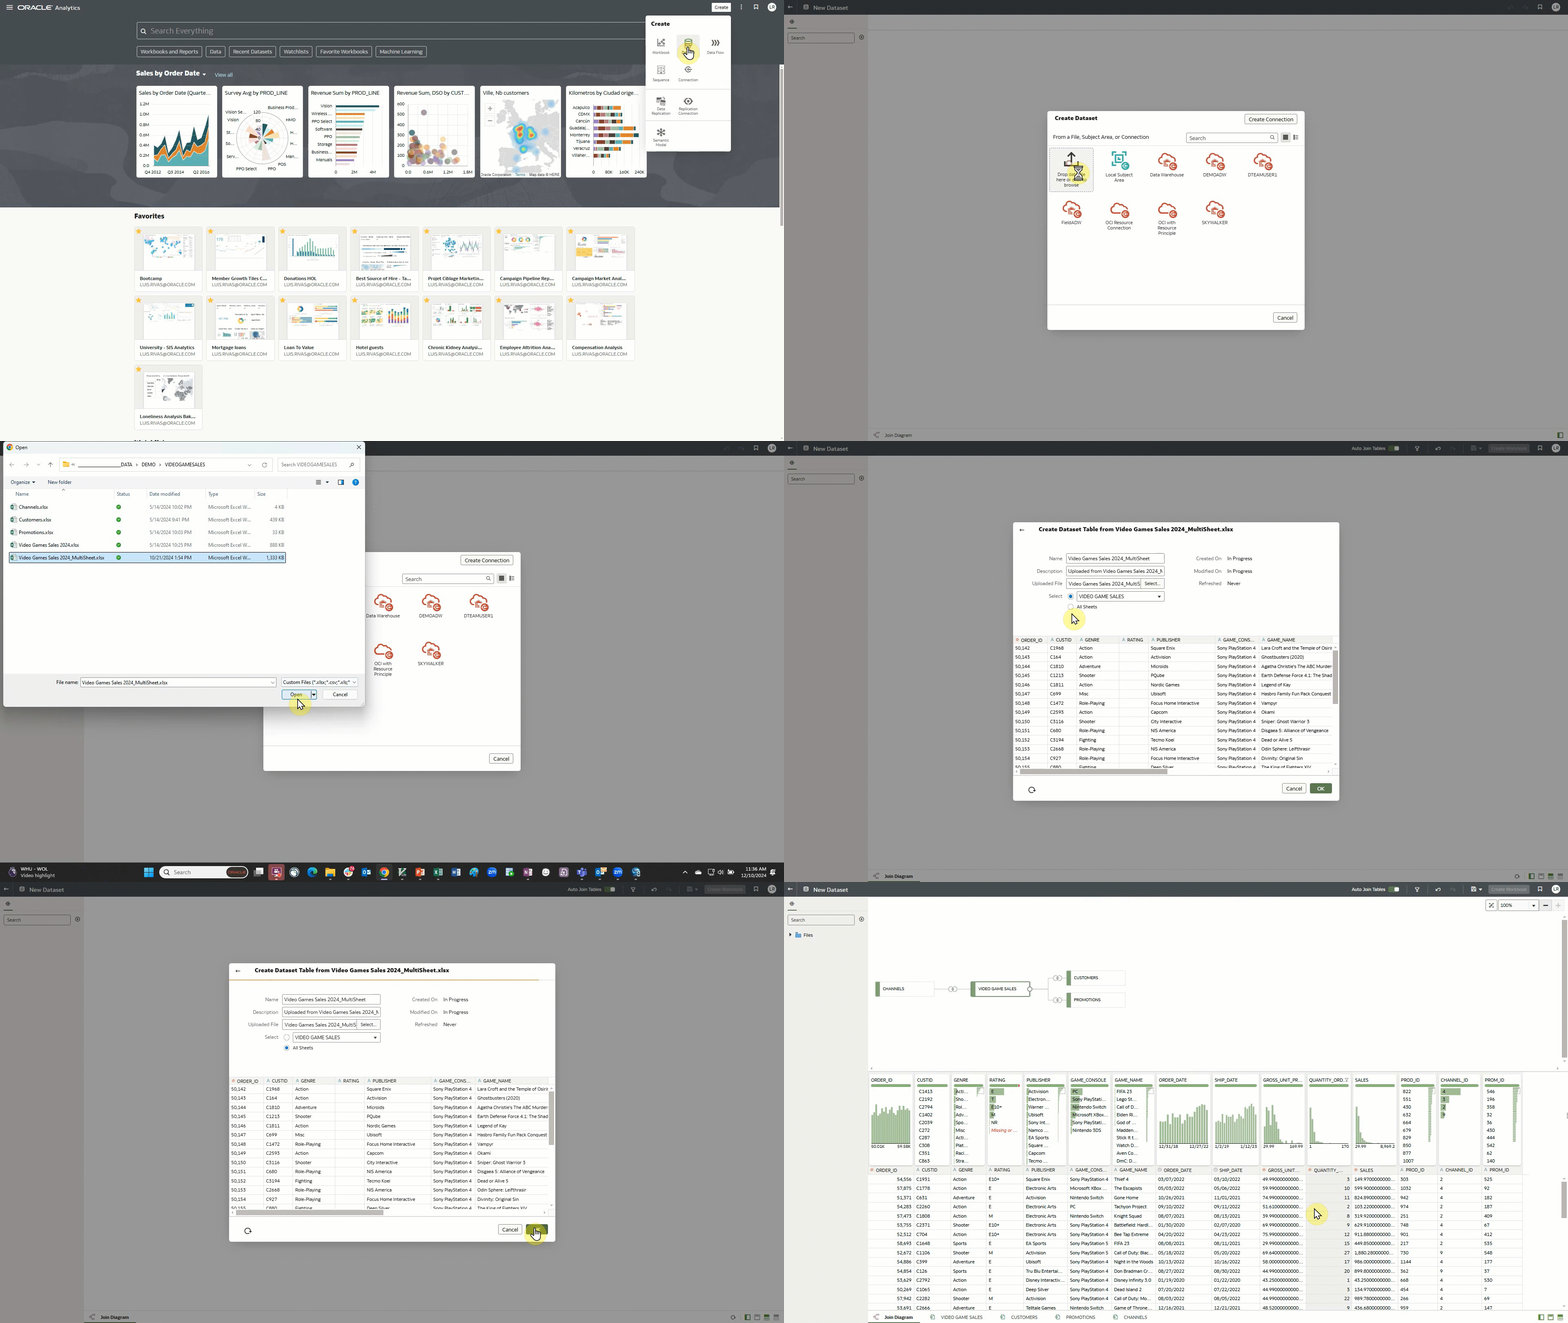
The multi-sheet upload enhancement to data import is designed to save users time and effort when processing large, complex Excel files. Imported datasets can be instantly profiled and converted into a comprehensive data join diagram, with the key connecting relationships identified with no effort from the user in this streamlined process.
Users can expect additional enhancements with this new data preparation functionality:
- Easier data upload with an enhanced UI for the Add Data dialog.
- More understandable data origins with new metadata information in tooltip.
- Improved performance and efficiency with incremental reload for OCI Object Storage data.
Exploring, dashboarding, and storytelling
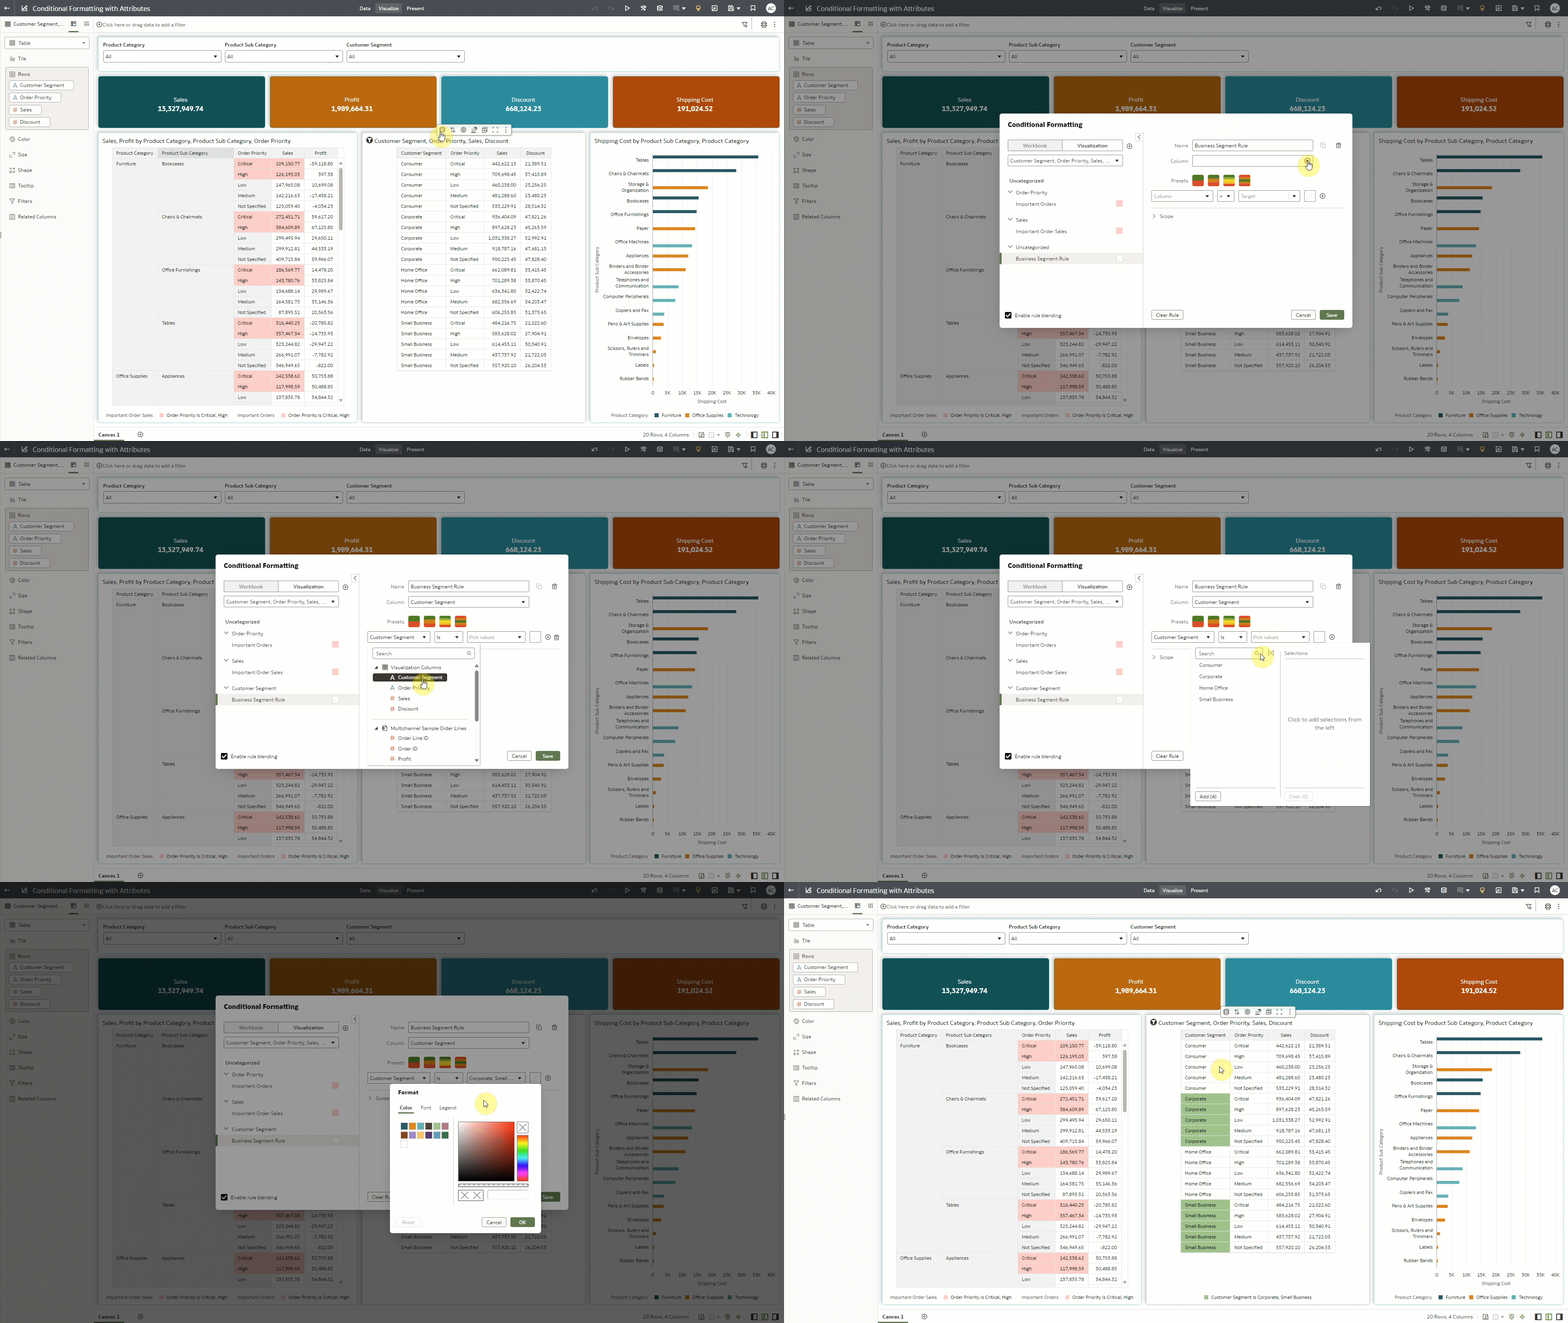
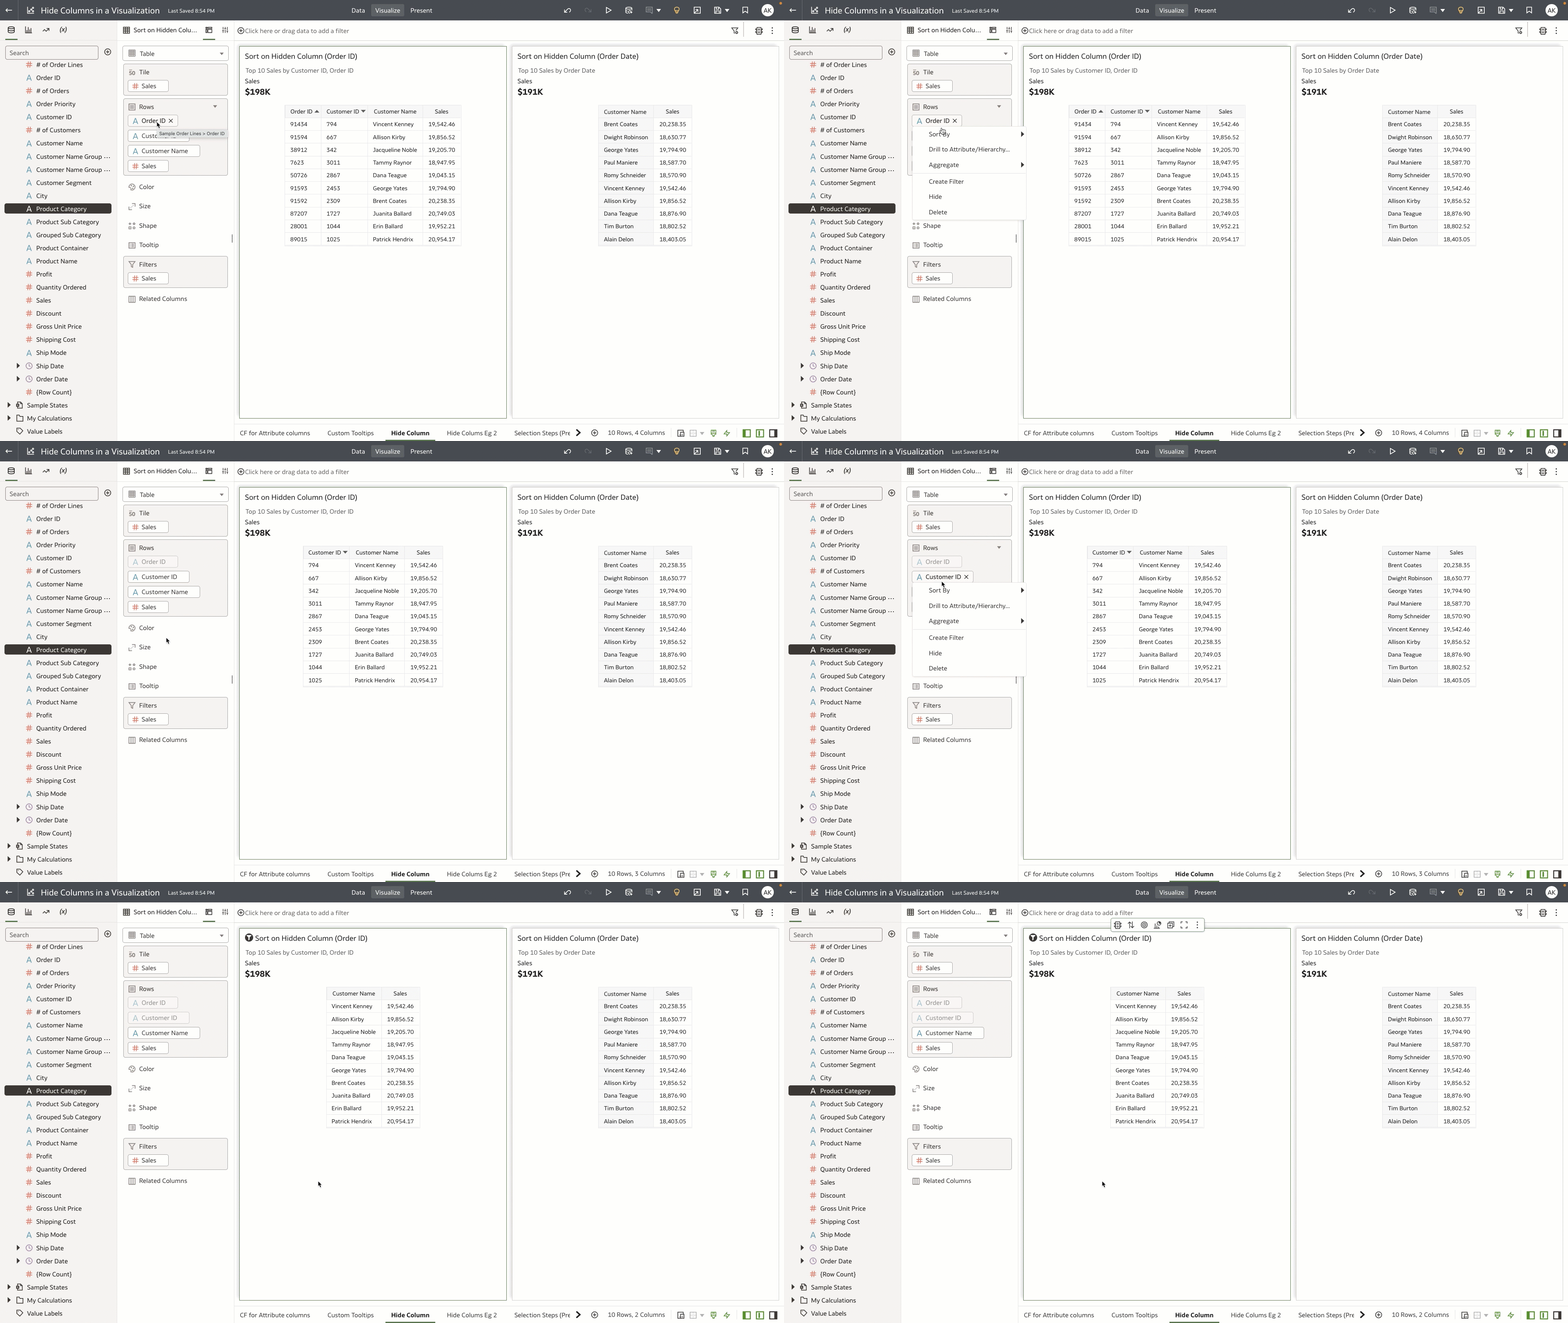
Creating streamlined, high-value dashboards is easier with this update. Authors can now apply conditional formatting to attributes as well as measures, meaning critical values of all types can be highlighted for consumers. Authors can now hide columns within visualizations to help prevent consumers from scanning through unnecessary data or viewing sensitive information. This won’t affect the column’s ability to add context for data actions or impact the overall grain of the visualization.
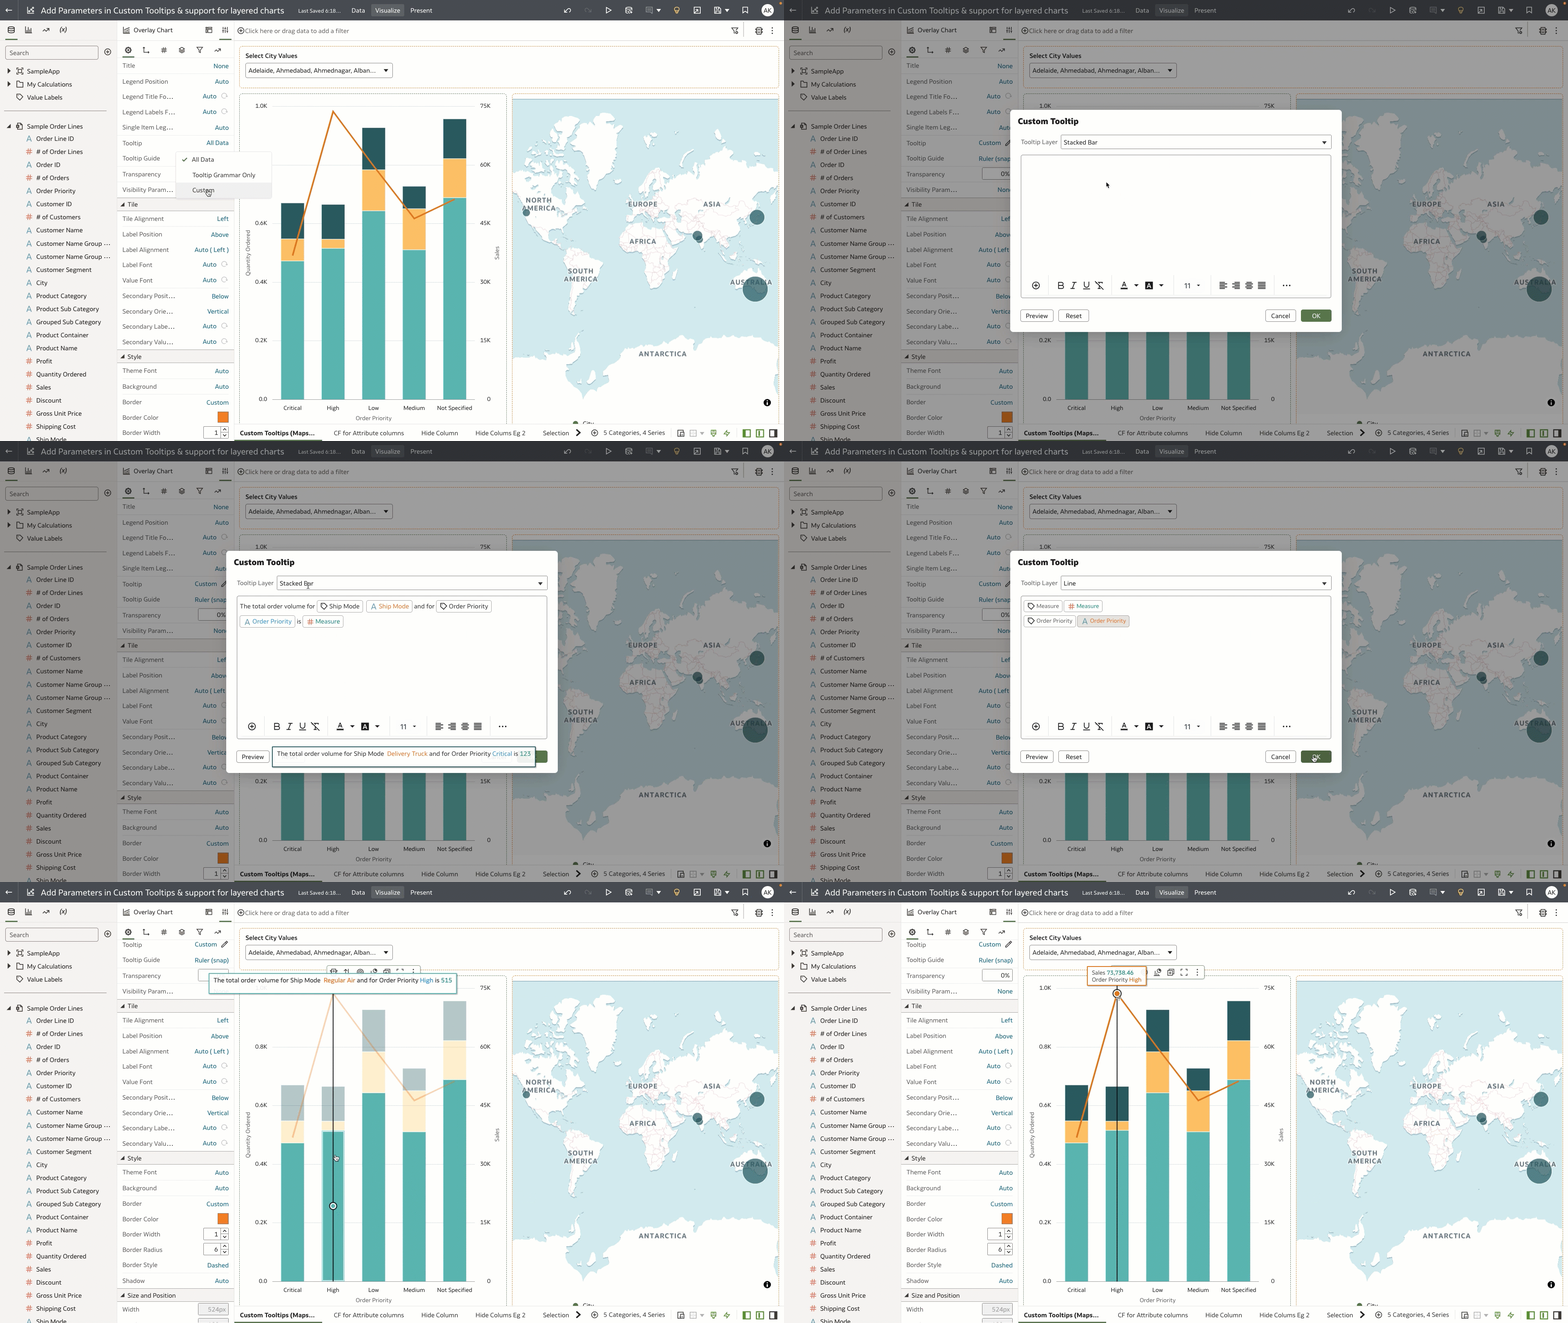
Building on the custom tooltip feature released with the November 2024 Update, OAC will now support custom tooltips for an expanded set of visualizations including Maps, Sunburst, Network and Boxplot. This expansion also includes the ability to add parameters into tooltips, as well as customize tooltips in layered charts, with specific formatting being applied to different aspects of the same visualization chart. This will extend an author’s ability to add specific context for a business user as they undergo their analysis.

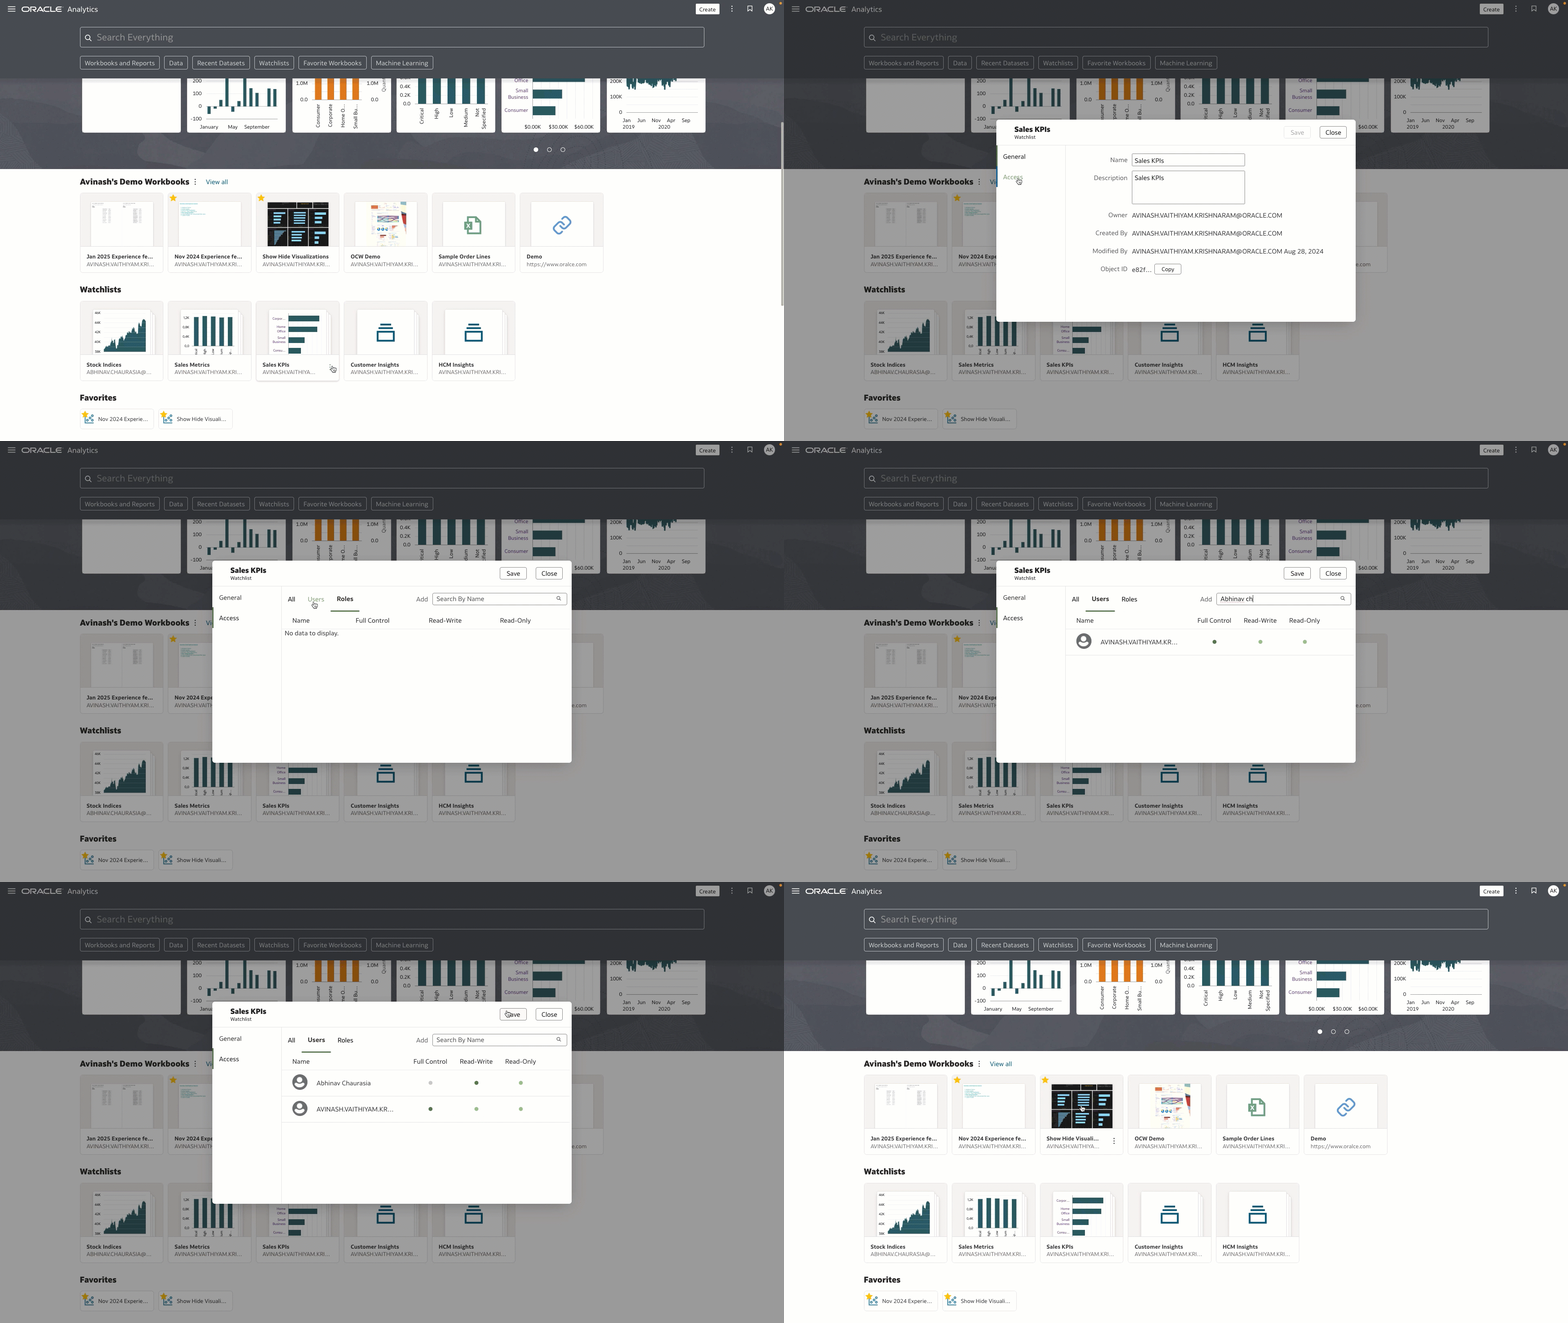
The January 2025 update makes collaboration even easier within OAC, as watchlists are now able to be shared with different users. This enables users to share their most critical KPIs and data visualizations with team members, allowing them to be easily monitored and integrated into analyses. Users can also define permissions for their watchlists based on the recipients’ required level of interaction with the shared content.
Authors and consumers can also expect:
- Enhanced Home Page experience with external webpage URLs.
- Expanded Canvas Templates with saved background, border, and shadow styles.
- Curated workbook filtering with selection steps (in preview).
Performance, compliance, and administration
Improved configuration increased fine-grained permissions, and an enhanced experience will be provided for administrators in the January 2025 Update. New functionality includes:
- Easier navigation through the redesigned OAC Console.
- Finer permissions controlling who can send and receive email deliveries.
- Programmatic mail server configuration and management through RESR APIs.
- Easy-to-schedule recurring email exports for visualizations in .XLSX, .PDF and .PNG formats.
See more in the What’s New documentation.
Key takeaways
The January 2025 Update continues to leverage AI to provide business users valuable and relevant analytic insights on their data. Administrators and architects can expect enhanced data upload and preparation capabilities, as well as expanded Semantic Modeler support for different data sources. Finally, dashboard authors will enjoy numerous additions to the data visualization experience that help to provide curated insights and key contextual information to their consumers.
For more information:


