Introduction
This blog introduces the concept of server scalability curves, how to create them and where they are useful.
A Puzzling Customer Performance Question
Recently a customer wanted to know why using 1/4 less connections did not affect their system throughput. It was not obvious at first and then I remembered a fundamental computing concept – server scalability curves. In short, the customer’s server was overloaded.
The most important Laws of Computing
Computer Science is a relatively young and evolving discipline, but there are some fundamental truisms or laws:

- Moore’s Law
- Amdhal’s Law
- Little’s Law
- Universal Scalability Law
- Metcalfe’s Law
- Putt’s Law
- Murphy’s Law
The Missing Law of Server Scalability Curves
While Neil Gunther’s Universal Scalability Law can be great at modelling systems for scalability it can scare off those who do not have a strong grasp of queuing theory and Little’s Law. A simpler, more intuitive concept [without the math] is Server Scalability Curves. Many computer performance tuning books and internet articles talk about concepts related to the server performance curve of a specific server, but I am not aware of the generalization of the concept. In over 30 years of computing, I have never seen a server system that does not fit within the model of Server Scalability Curves.
Interpretation of the Law of Server Scalability Curves
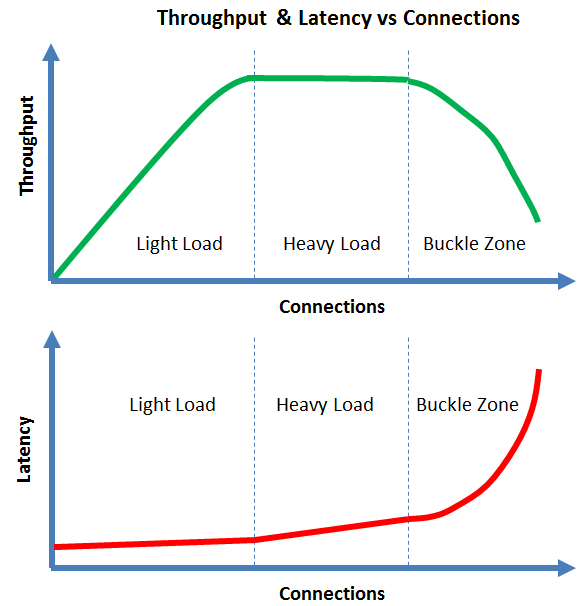
If you are a computer performance engineer, then these graphs are likely familiar and my comments obvious. If you are not a computer performance engineer, then you many only be familiar with the light load zone of the Server Scalability Curve [ie the linear scalability part].
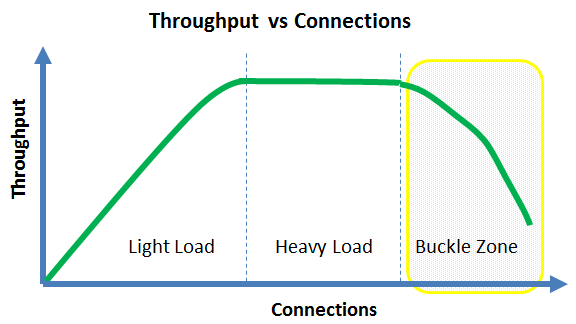
The myth of linear scalability
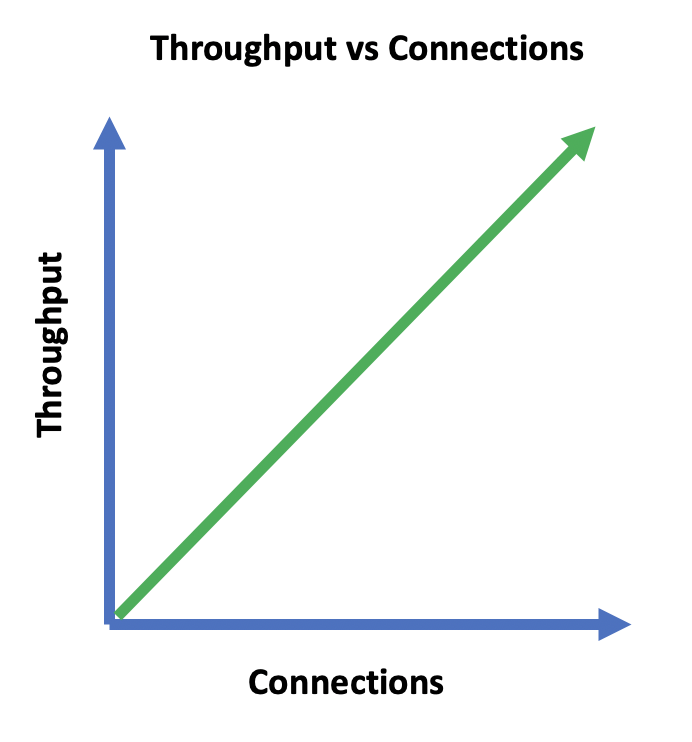
Many people talk about linear scalability for their favorite server. The reality is that even under optimal conditions, no server can mantain linear scalability forever. At some point, the throughput will flatten and then decrease. This reality is the essence of server scalability curves.
Obviously not all computer servers (SQL RDBMS, NoSQL, HTTP, REST, SOAP, CORBA, Tuxedo, CICS etc) have the same scalability curve, but they all have a scalability curve with the following characteristics:
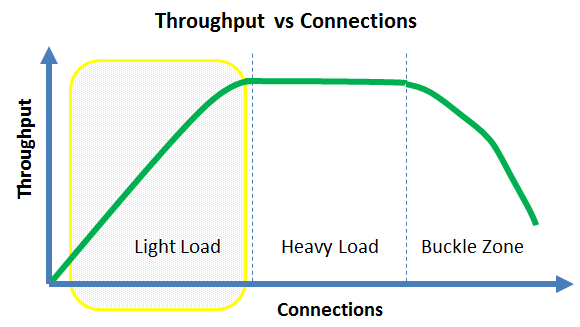
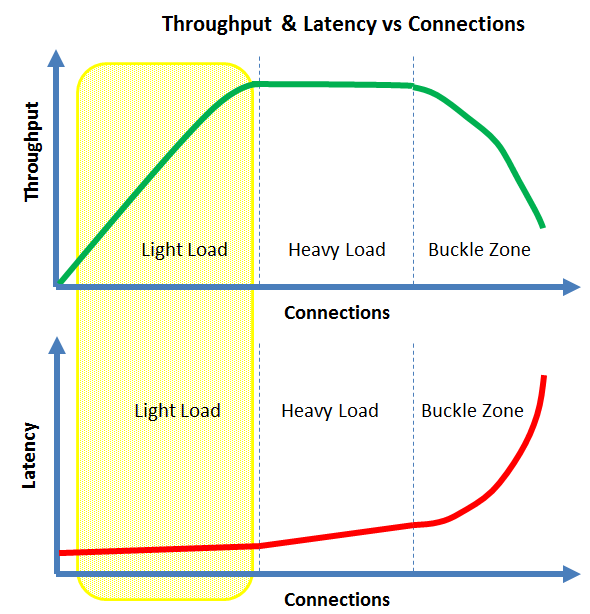
- Under light load, adding more connections will tend to increase the system throughput
- Your server may approach linear scalability in the light load zone, but it cannot last forever
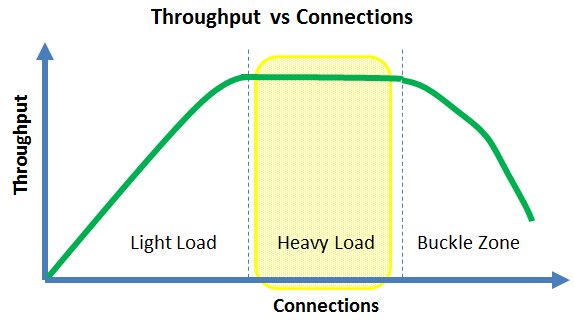
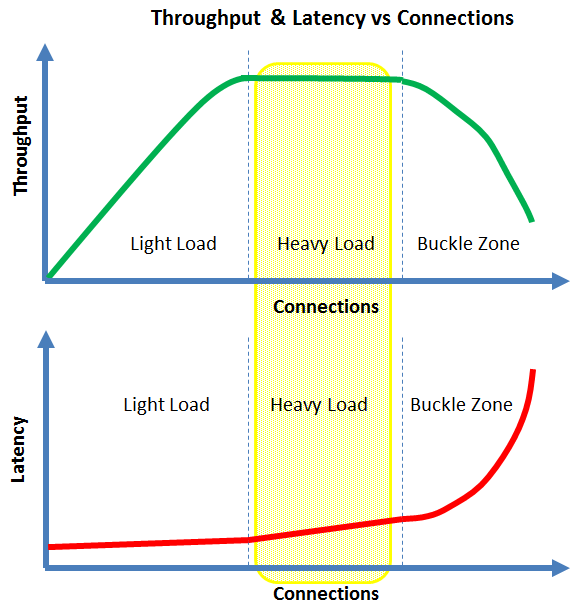
- Under heavy load, adding more connections will tend to neither increase nor decrease the throughput
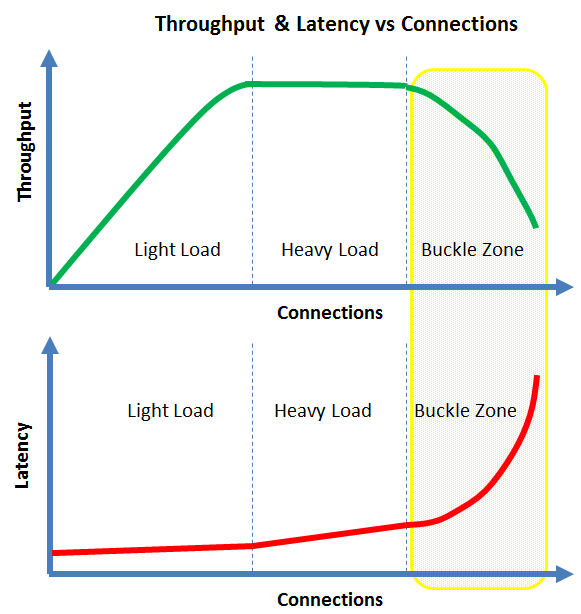
- In the buckle zone, adding more connections will tend to decrease the throughput
There is also a direct relationship between latency and throughput:
- Under light load, the latency will be the lowest and tend to be flat
- Under heavy load, the latency will tend to slowly increase with the number of connections
- In the buckle zone, the latency will tend to grow without bounds. This is often called the hockey stick where the latency becomes un-acceptable
While I claim that all servers have a scalability curve, those curves will tend to be different. That is they all tend to differ in how they behave in the light load, heavy load and buckle zones.
Real world Servers
Real world servers are not perfect and tend to vary in the following ways:
- How close that they get to linear scalability in the light load zone
- How long that they can continue to scale in the light load zone [ie what is the maximum throughput given a workload and hardware/software configuration]
- How long they can achieve a mostly constant throughput in the heavy load zone
- How quickly that their throughput decreases [and latency increases] in the buckle zone
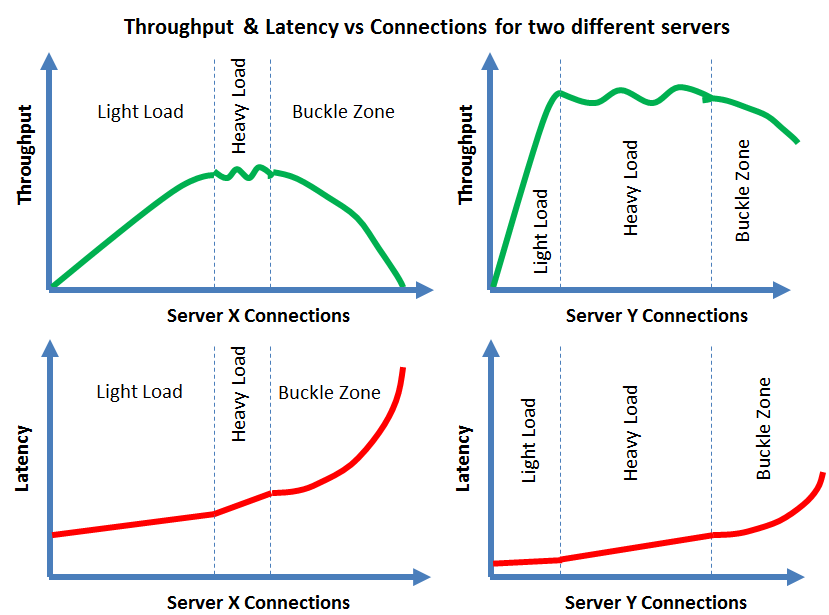
It should be obivious that Server Y performs significantly better than Server X based on their server scalability curves.
An answer to my customer’s question
So to explain why my customer’s throughput did not change when they decreased their connections by 1/4, the answer was because their system was in the heavy load zone of the server scalability curve.
How can you determine the zones of the Server Scalability Curve
You need to test the server given a workload and hardware configuration as each combination of workload and hardware will tend to give a different scalability curve. A simple way to create a server scalability curve is:
- Use powers of 2 [eg 2, 4, 8, 16, 32, 64, 128, 256, 512, 1024, 2048, 4096, 8192, 16384, 32768, 65536] to vary the number of connections
- Servers cannot scale forever as they have a finite number of CPU cores, a fixed number of network cards and a finite bandwidth and response time for their persistent storage
- Once the throughput stops increasing, use a binary search to determine where the light load zone become the heavy load zone
- Once the start of the heavy load zone is determined, increase [double] the number of connections until the throughout decreases
- Use a binary search to determine where the the heavy load zone ends and the buckle zone starts
- You do not need to test to far within the buckle zone as the latency will tend to increase rapidly [without bounds]
- Chart the throughput vs connections and latency vs connections graphs
What can you do with a Server Scalability Curve
Having a server scalability curve for your server / hardware / workload, allows you to:
- Determine the optimal throughput given an acceptable latency
- Determine how many servers you many need to use for your desired workload [ie use horizontal scalability]
- Have a baseline for when comparing new hardware, server software versions or different [software] servers
Disclaimer: These are my personal thoughts and do not represent Oracle’s official viewpoint in any way, shape, or form.