Today we bring a video to you that shows an advanced use case for our WebUI. It recorded one part of the Hands-on-Lab we offered at Oracle Openworld in San Francisco this year.
Solaris StatsStore’s WebUI has been described as the easy to use interface to various kinds of performance and status information Solaris can collect. Having a graphical representation of well-known data like average CPU utilization, or disk I/O, or network load is what very many other tools can provide as well, and Solaris StatsStore presents this information right on the entry screen after one has logged into https://<server>:6787
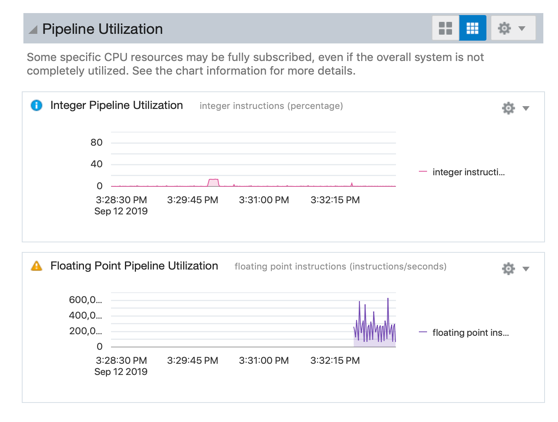
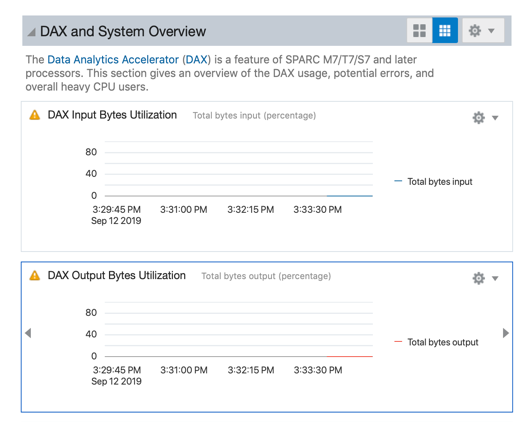
Solaris StatsStore can in addition visualize very platform specific data, or application activity:
 |
 |
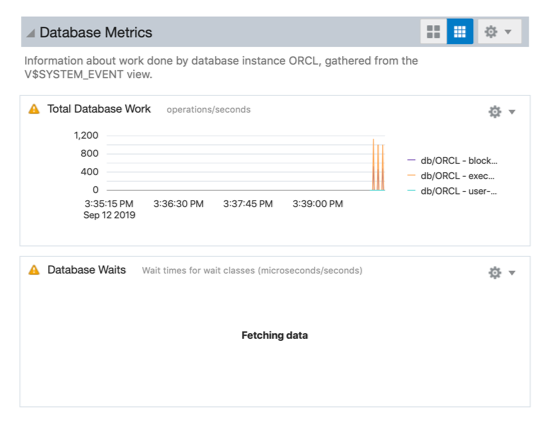 |
| Integer pipeline utilzation of an individual SPARC M8 core | Load on SQL in Silicon accelerators (“DAX”) of each SPARC M8 CPU | Database activity as seen from the Oracle Database’s own view |
The following video demonstrates how one can create his own personal view on the activity of a single system with just a few mouse clicks. It combines CPU, disk I/O, DAX activity, and database transaction volume into a single unified view
(if you do not see a video below click here)
