I’m happy to announce the first release of the StatsStore Scraper to the GitHub oraclesolaris-contrib site.
Ever since we released Oracle Solaris 11.4 with the StatsStore and WebUI in it customers have been looking how to use the rich set of stats the StatsStore can pull from the system. And where initially a lot of the activity was around using the WebUI to inspect and drill-down on the individual system basis, more and more folks have been looking foor way to pull data from the StatsStore and collect this in a central location.
One of the ways this can be achieved is through the RAD/REST API that has a module that allows you to directly query the StatsStore and get the data in JSON format. And in the past we’ve shown how you can do this through a REST client in presentations we’ve done and example code we’ve published on the oraclesolaris-contrib page. However, depending on the REST client this probably requires a fair amount of programming skills, plus the response JSON coming from the StatsStore is well suited for programmatic tools—like the WebUI—but less for data collection through a REST client.
So, as a step to help folks centrally collect StatsStore data in their tool of choice we’ve started working on a scraper tool that can connect to the StatsStore on an Oracle Solaris instance, transform and simplify the collected JSON data, and then present it to your tool of choice.
In this first release we wanted to give a concrete example where you can not only collect data from various systems and into a central tool, we also wanted to show how you could make it easier to install and have it always on through creating an IPS package and SMF service of it. We’re publishing both the way to create the package and service yourself or to take a pre-built package and install that.
In the example in this first release we had to choose from one of the tools we often get requests on and from the list of tools like InfluxDB, Prometheus, ElasticSearch, and Splunk, we choose the latter, but we hope to have more examples out to other tools soon. Once we had this one ready we didn’t want to wait and just get this out there now.
Here’s a Screenshot of a Splunk instance with a bunch of systems reporting into it.
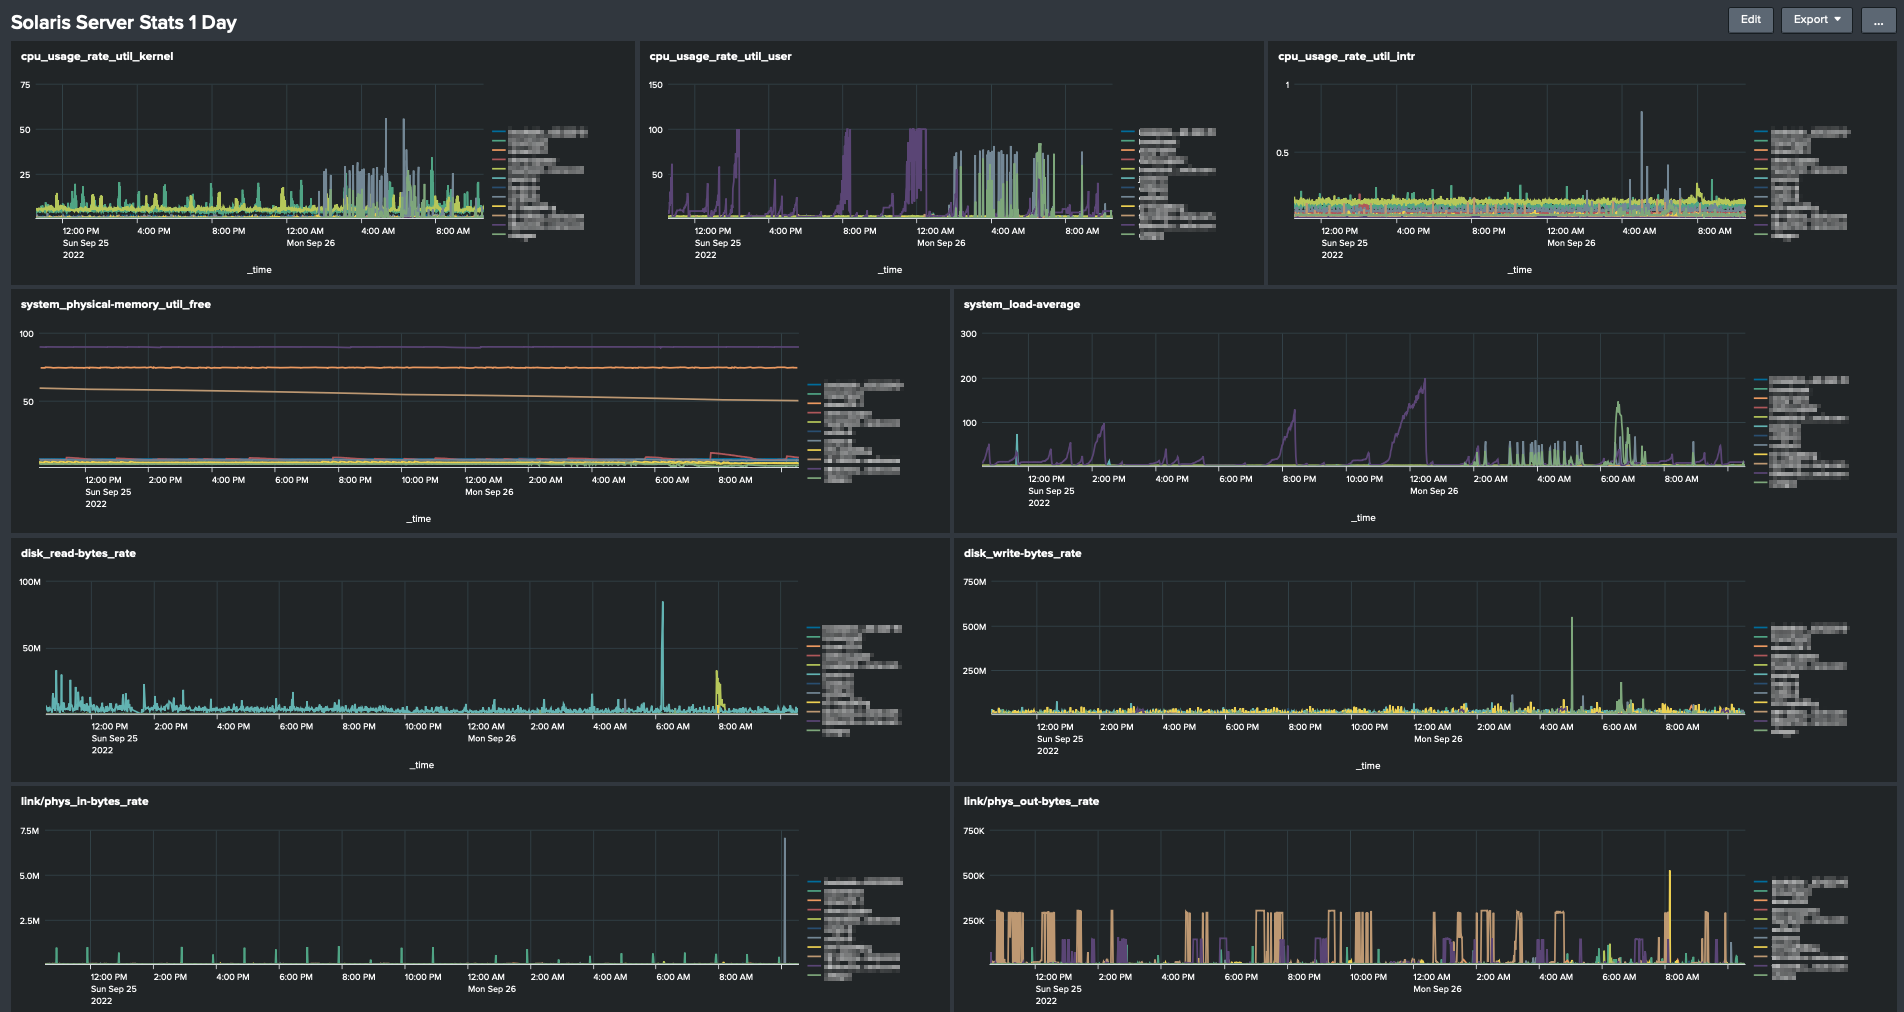
Note this example only includes the Oracle Solaris related bits, it doesn’t include the Splunk setup of the HEC and dashboards. Using the HEC to import metrics is a fairly common use case for Splunk admins and should be easy to set up.
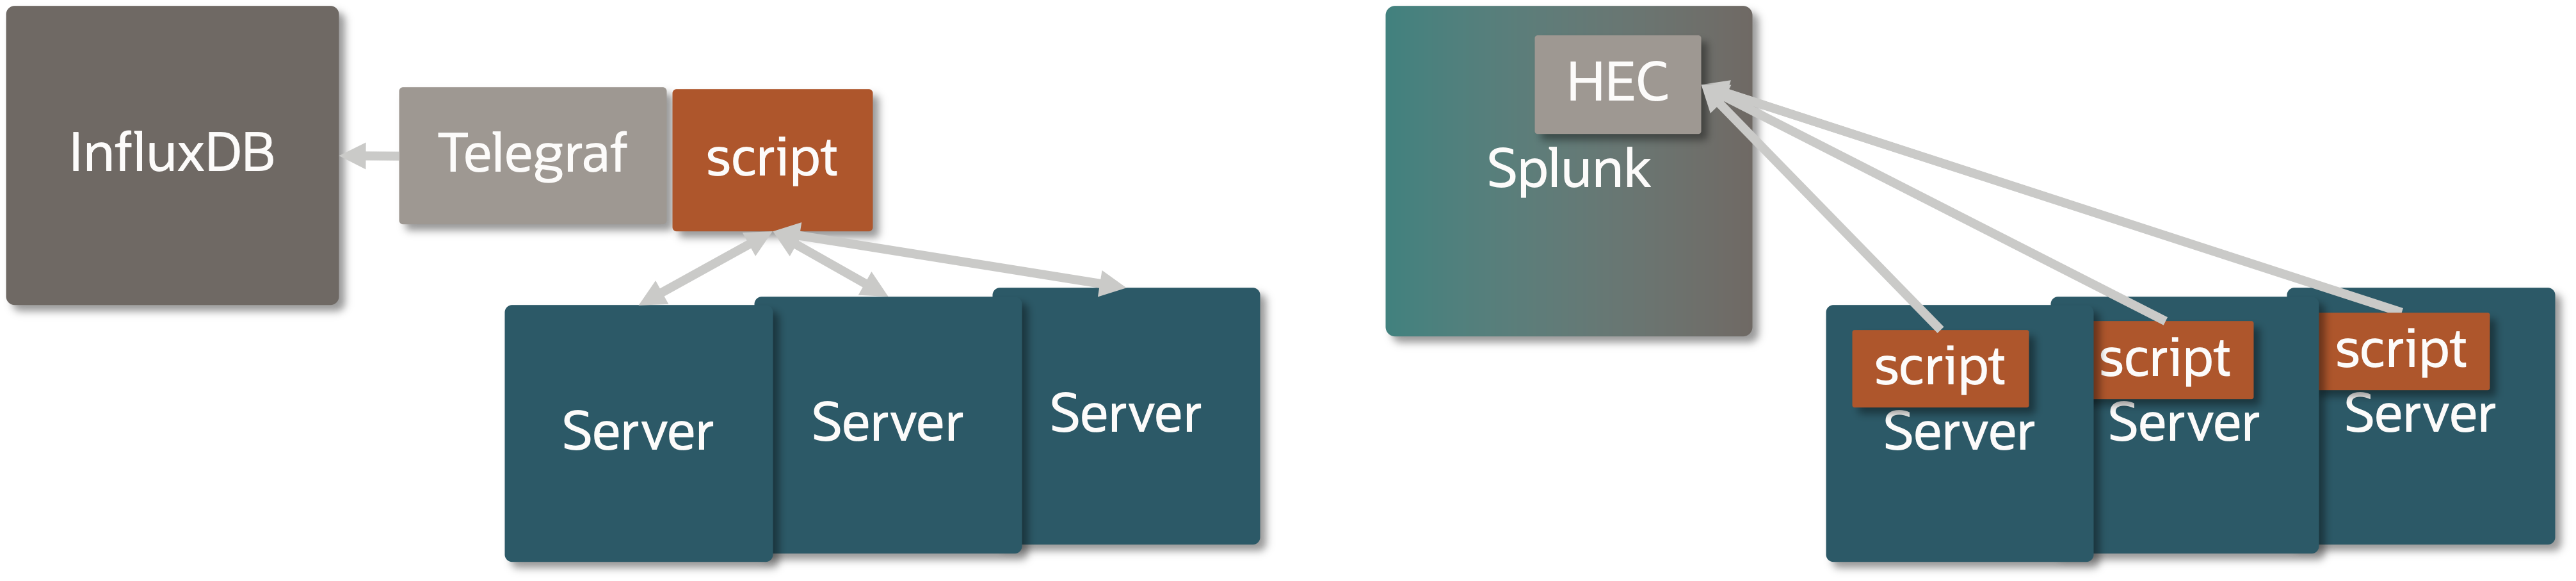
One more thing to point out is that in our example we can choose to run the StatsStore Scraper script remotely from the system and connect over RAD/REST and in that way collect data from a bunch of systems in one go, or run the Scraper script locally on each system. In our first example we’ve chosen to run the Scraper script local in each Oracle Solaris instance, in part because we could then also show how to create an SMF service and IPS package, but also because in some use cases it’s better to push data than to allow for it to be pulled.
In the remote model you might want to have something like Telegraf collect data onbehalf of a series of systems and push this collection into InfluxDB as you can see in the following figure. In future examples we hope to show the remote model too.
You may ask: Why on GitHub and not in Oracle Solaris directly? There are many options to choose from and it’s hard to come out with something that can cover all those cases, so by doing this on GitHub and we want to give the community the ability to pick this up and amend it to their liking and give us feedback in the process. Plus, we may bring some of these things into Oracle Solaris proper as we get more feedback on this area, the tools used, the stats you’d like to collect. So, feel free to give us feedback though the GitHub issues page.
So, go to oraclesolaris-contrib pull the repository and try it for yourself!