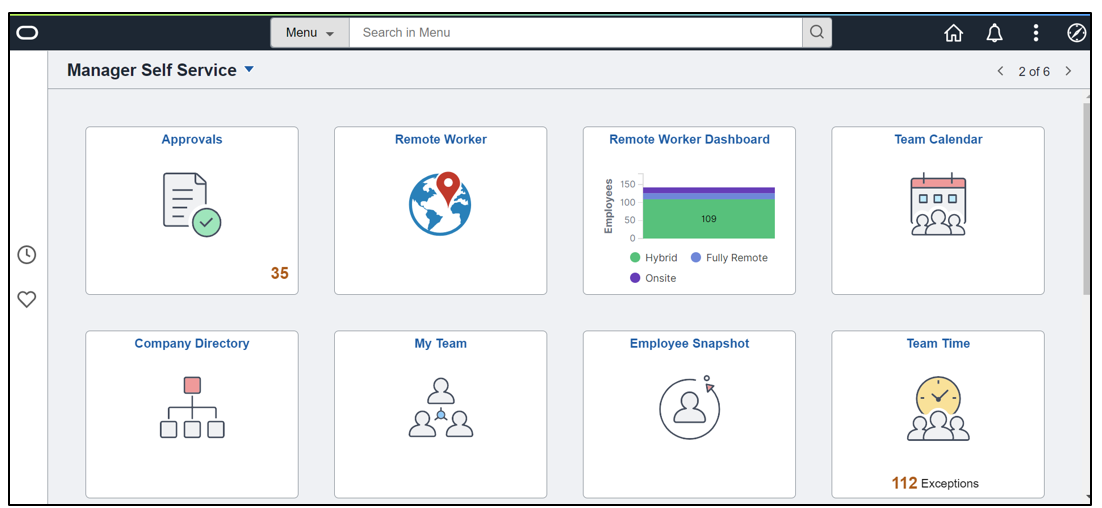
Now that you have Remote Worker implemented, Managers need the ability to see the who, where and when of their employees that are remote working. Just released in Image 42 is a new dashboard that can provide your Managers this information at their fingertips.
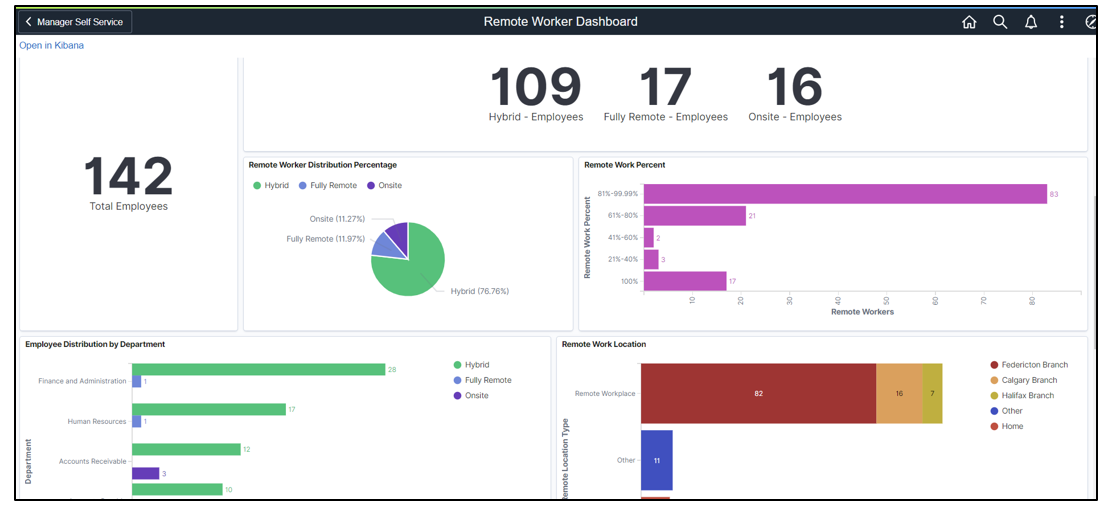
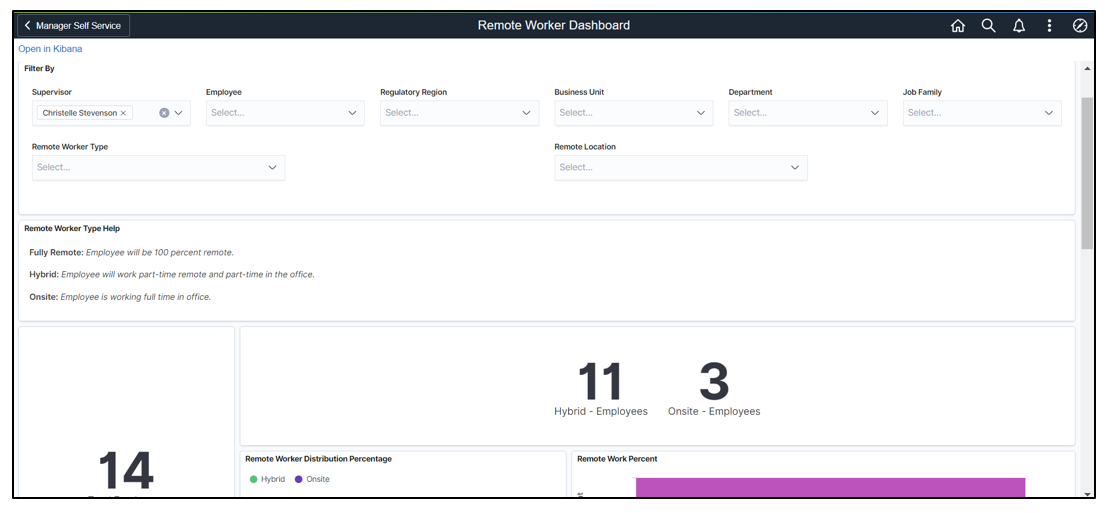
The visualizations provide the Manager with information about the number of directs and in-direct reports that are Fully Remote, Hybrid Remote, or always working Onsite. They can also determine what percent of the time the Hybrid employees are working outside of the office and the distribution of remote working by departments.
Other important information is to understand where the remote work is being accomplished. Is it at home, another location, or at a different work location?
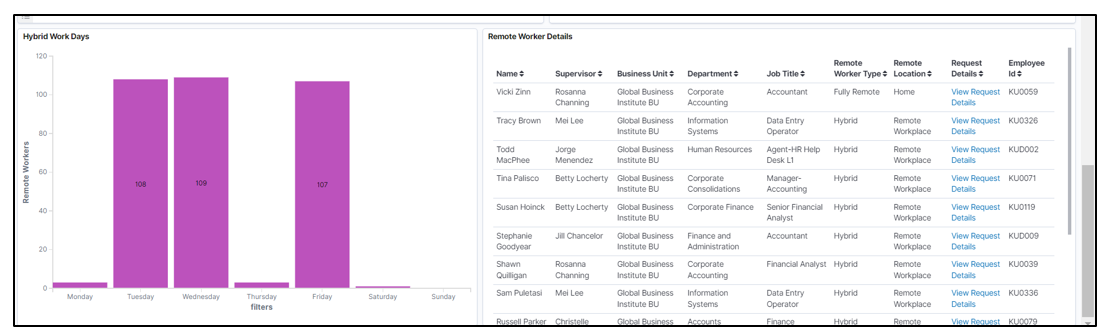
The Hybrid Work Days visualization helps the Manager to understand staff coverage for those employees that work part of the time in the office and part of the time remotely. In addition, there is the Remote Worker Details grid with a direct link to the View Request Details.
A Manager will see all of their employees when entering the dashboard. This includes direct and in-direct reports.
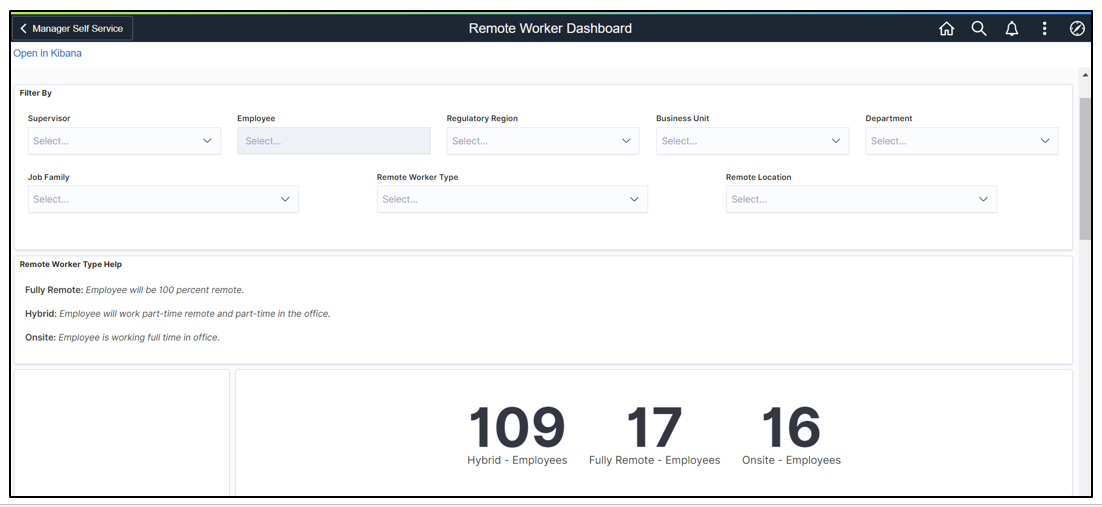
By selecting their own name in the Supervisor filter, the manager can drill down to see only the employees that directly report to them.
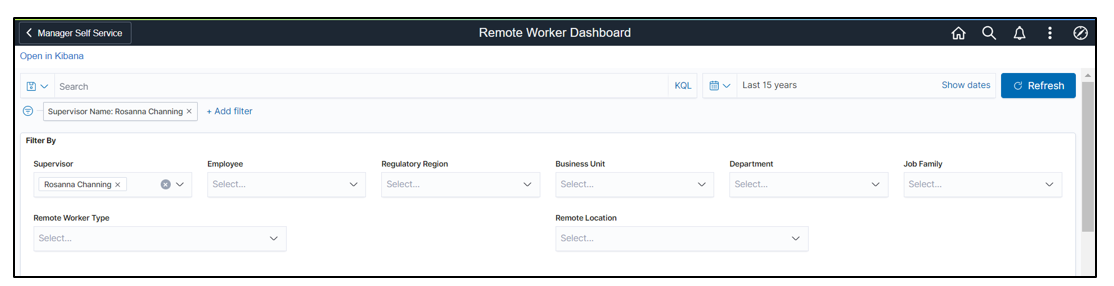

If they would like to see the employees that indirectly report to them by specific supervisor, the Manager can change the Supervisor’s name in the filter. The visualizations will automatically change to provide a different view of the data. Since access is based on reporting security, the manager can only see those employees within their purview.
A demo of the Remote Worker Dashboard for the Manager is available in the Image 42 Highlights. If you need more information about how these analytics work, this Analytic WorkCenter is a great place to find additional documentation, videos, and blogs.
