PeopleSoft Billing recently delivered analytics dashboards that enable Billing Specialists and managers the ability to proactively monitor billing operations. PeopleSoft Billing integrates with several source systems including PeopleSoft Order Management, Contracts, Projects as well as third-party system for enterprise-wide billing operations. The new dashboards can help billing managers in rebalancing of Billing Specialist workload and ensure that invoices received from multiple feeder systems have been processed in a timely manner. The new dashboards, Billing Analysis Dashboard and Billing Operations Dashboard, have been implemented using Kibana. The primary source of data is the Billing Header Table and a new search index based on a connected query has been built to access, summarize, and present this data. Now let us look at how these dashboards help the billing department.
The Billing Analysis Dashboard (Figure 1) helps analyze the number of invoices processed within a selected time frame. Billing users can view invoice volume for top Business Units and invoices by Bill Source.
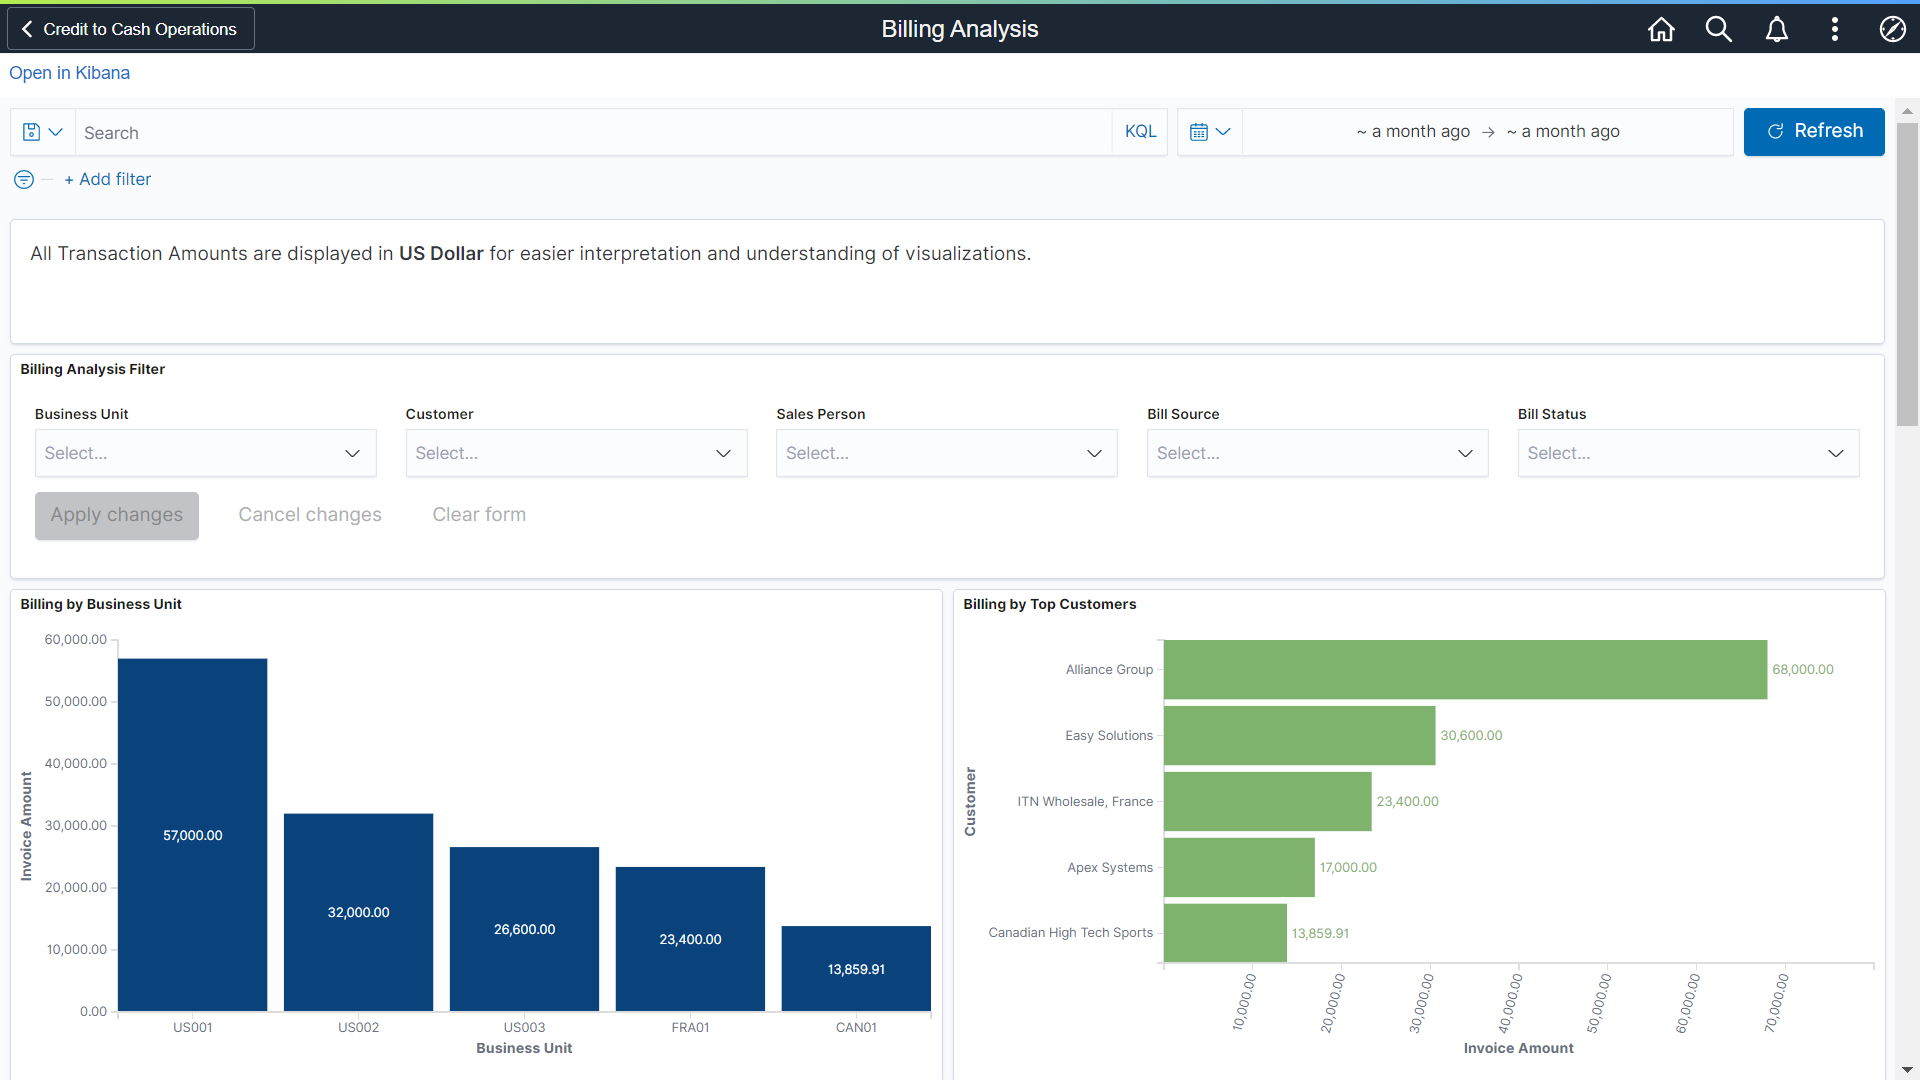
Figure 1. Users can filter by invoice data by Business Unit, Customer, Salesperson, Bill Source and Bill Status on the Billing Analysis Dashboard
Billing Analysis Dashboard provides Billing Specialists several visualizations (Figure 2) to analyze billing data including Billing by Top Bill Source, Billing by Top Contracts, Billing by Industry and Billing by Top Salesperson
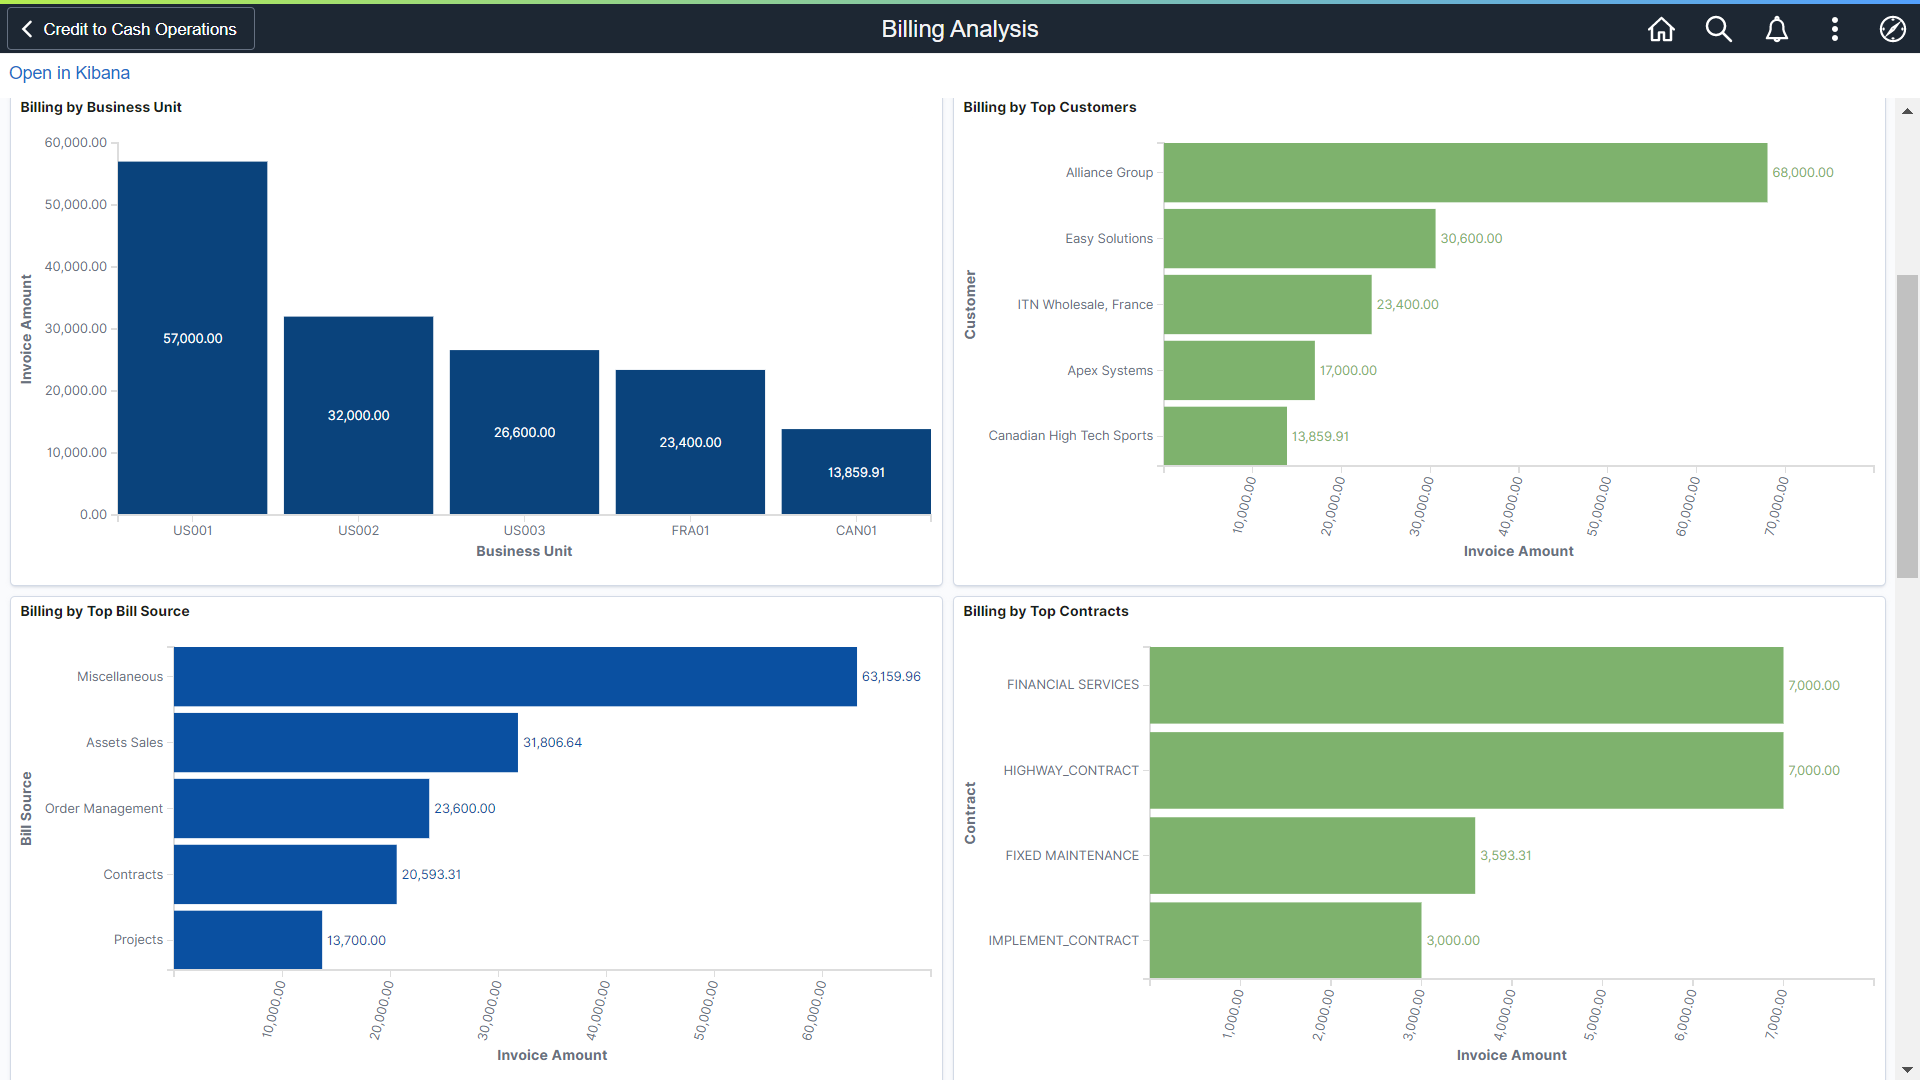
Figure 2 Billing Users can review aggregated data to get an accurate picture of state of operations
The second dashboard, Billing Operations Dashboard (Figure 3), can be used by Billing Managers for analysis through these visualizations:
- Invoices by Customers and Billing Specialists – shows invoices for top Customers and Billing Analysts assigned to them. If multiple Billing Analysts are assigned to a Customer, all will be shown along with the number of invoices assigned to them
- Invoices by Bill Source and Business Units – Because PeopleSoft Billing processes invoices from multiple sources, it is important for operations to know if all have successfully processed. For example, if a Project invoice for a large Customer does not get processed due to system error, this visualization can highlight the issue and help resolve the exception
- Invoices by Invoice Media – For organizations looking to move to paperless invoicing, this can help identify all invoices by media such as paper, email attachment or electronic file.
- Invoices by Top Contract – shows invoices by top 5 Contracts
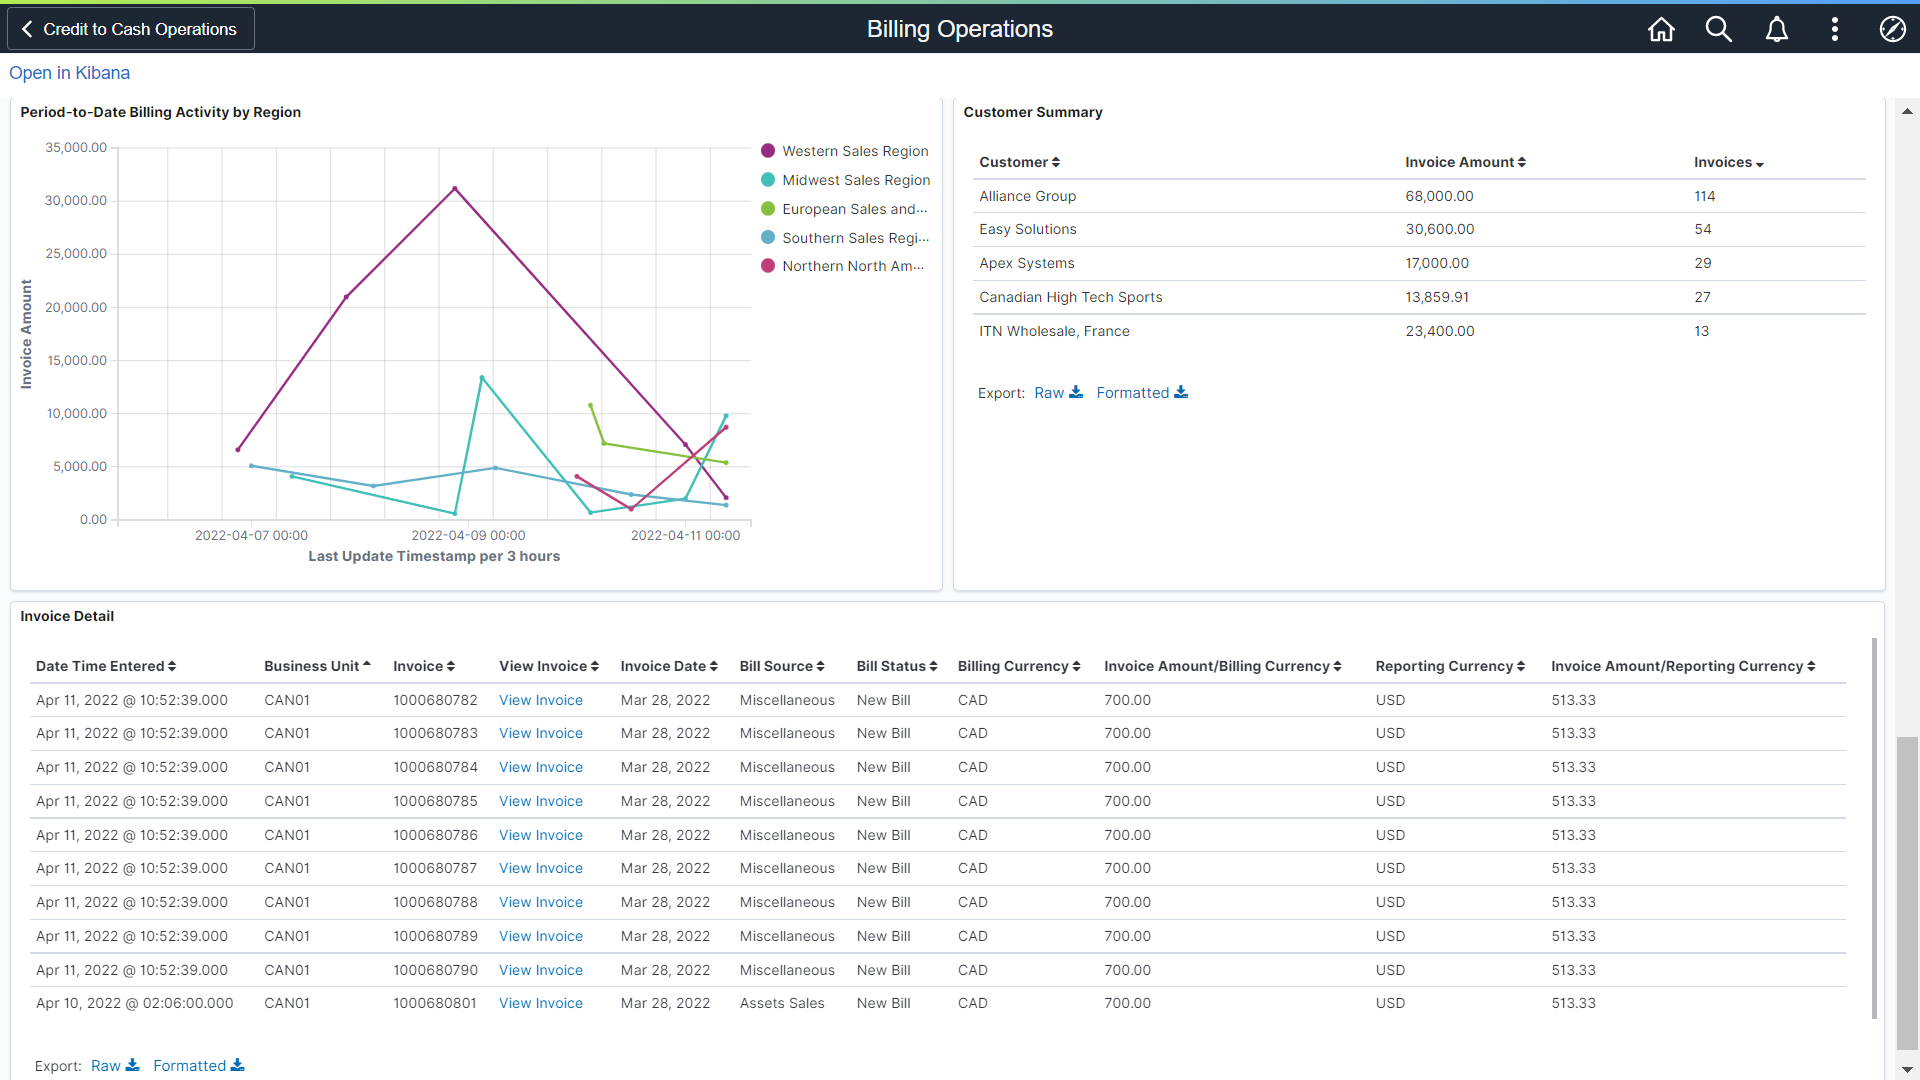
- Period-to-date Billing Activity – shows invoice amounts processed with time stamp
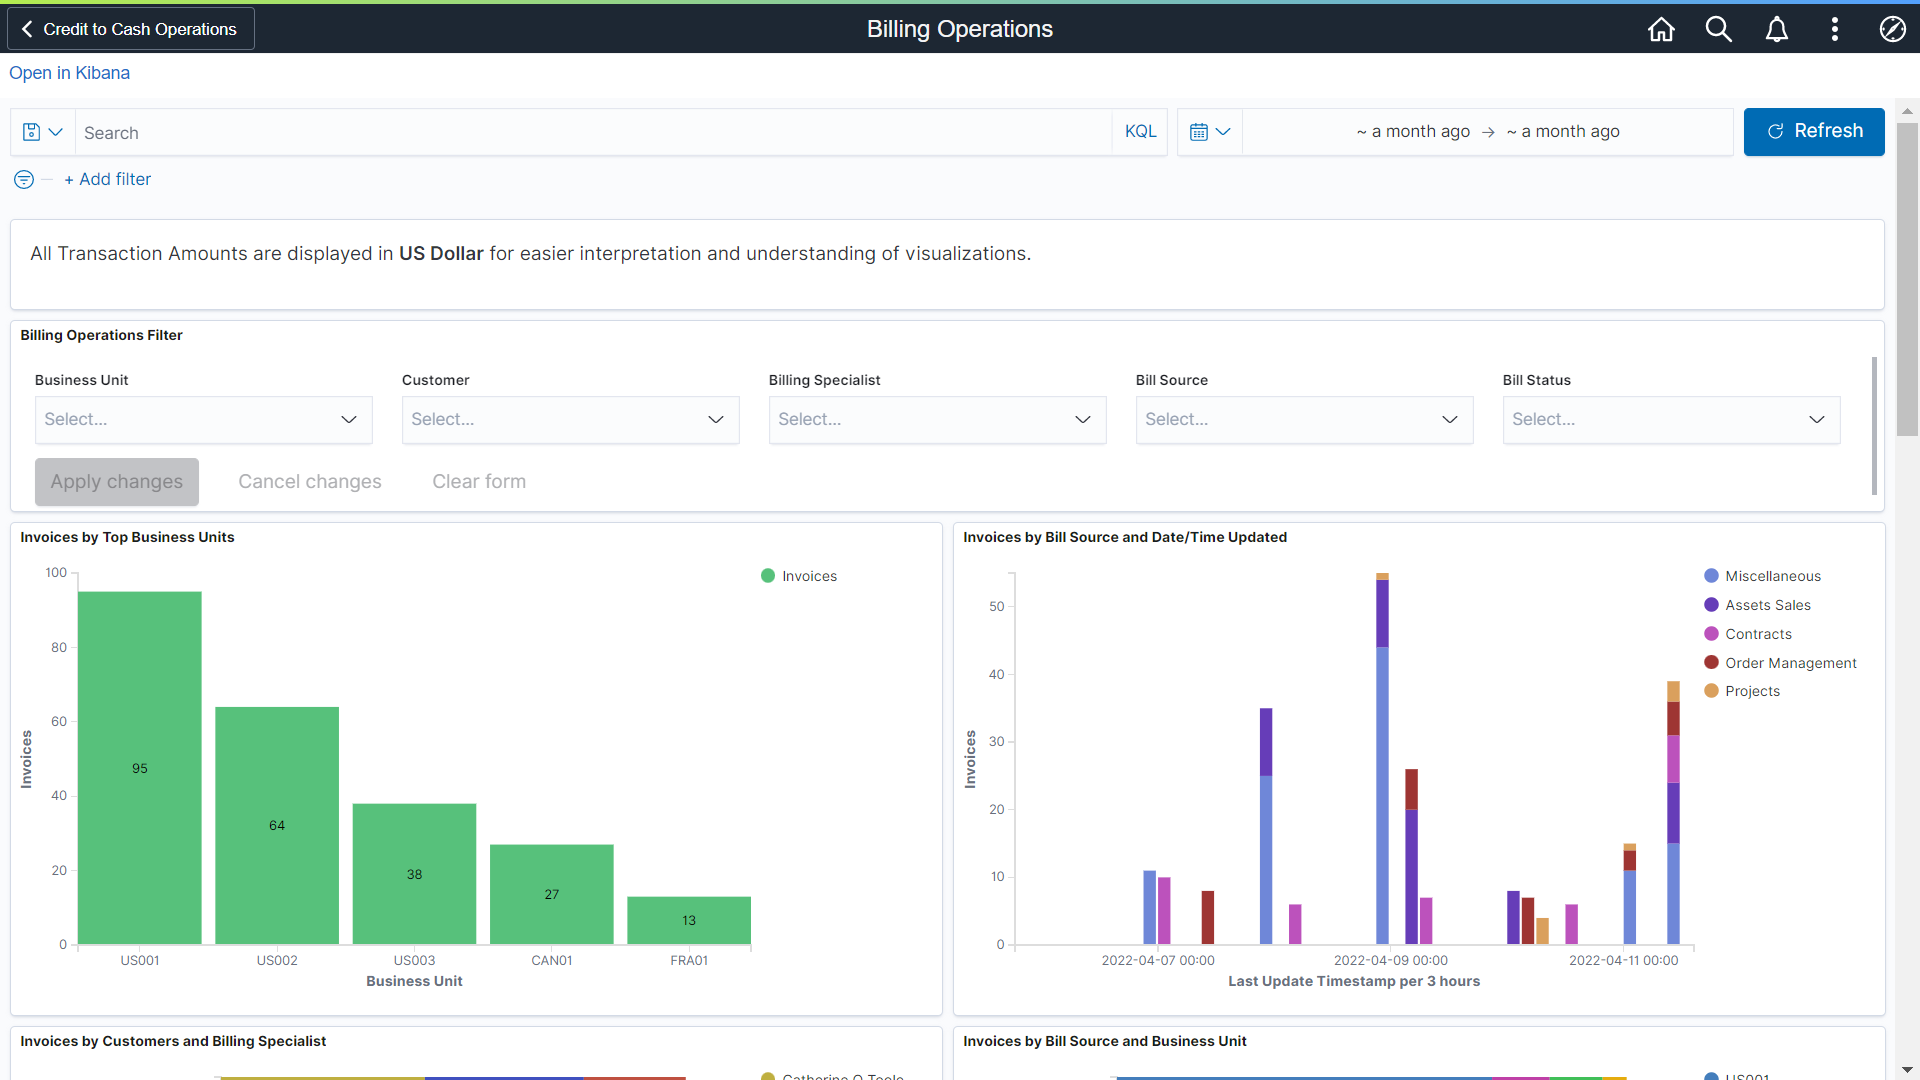
Figure 3 Users can drill into each visualization to see invoice details.
The detail table shows all the invoice details that can be downloaded on excel for further analysis. Also, both the transaction currency and code and the reporting currency and code are available for each invoice.
With these in-application data visualizations, billing departments can look at large volumes of billing data and perform time-based trend analysis without impacting system performance. These analytic dashboards can help manage invoice backlog and improve customer satisfaction through timely and accurate invoicing. Managers will get quick access to relevant data – and they can do this all within PeopleSoft!