Did you know that Accounts Payable offers two dashboards that Payables as well as Cash managers and analysts can use to monitor their payables activities?
PeopleSoft Accounts Payable was the first product to release Kibana dashboards in Image #36!
Kibana for PeopleSoft provides rich analytics and visualization with performance enhancements – enabling better decision-making and improved understanding of your data. Kibana is easy to install, configure, and maintain, and it provides superior performance in rendering visualizations. Kibana analytics do not affect transaction processing because analytics are processed against Elastic indexes, not the transaction database.
Early Detection and Monitoring is a tool for customers to see liability and payment exposure that came in through vouchers created by nightly batch processes and manually entered. This dashboard is time-sensitive for early detection and monitoring.
The Trend Analysis dashboard allows you to view the liability exposure across financial periods by currency as well as the activity volume for your lines of business (business unit(s)). The initial default is the last 12 months but can be modified to any timeframe that is desired.
Early Detection and Monitoring dashboard:
The Early Detection and Monitoring dashboard provide the Accounts Payable Manager as well as the Cash Manager a nightly view into an organizations liability exposure that will identify such things as:
- High dollar invoices
- Ensure sizeable discounts are not lost
- Working closely with Cash Management to understand cash requirements for a given time span
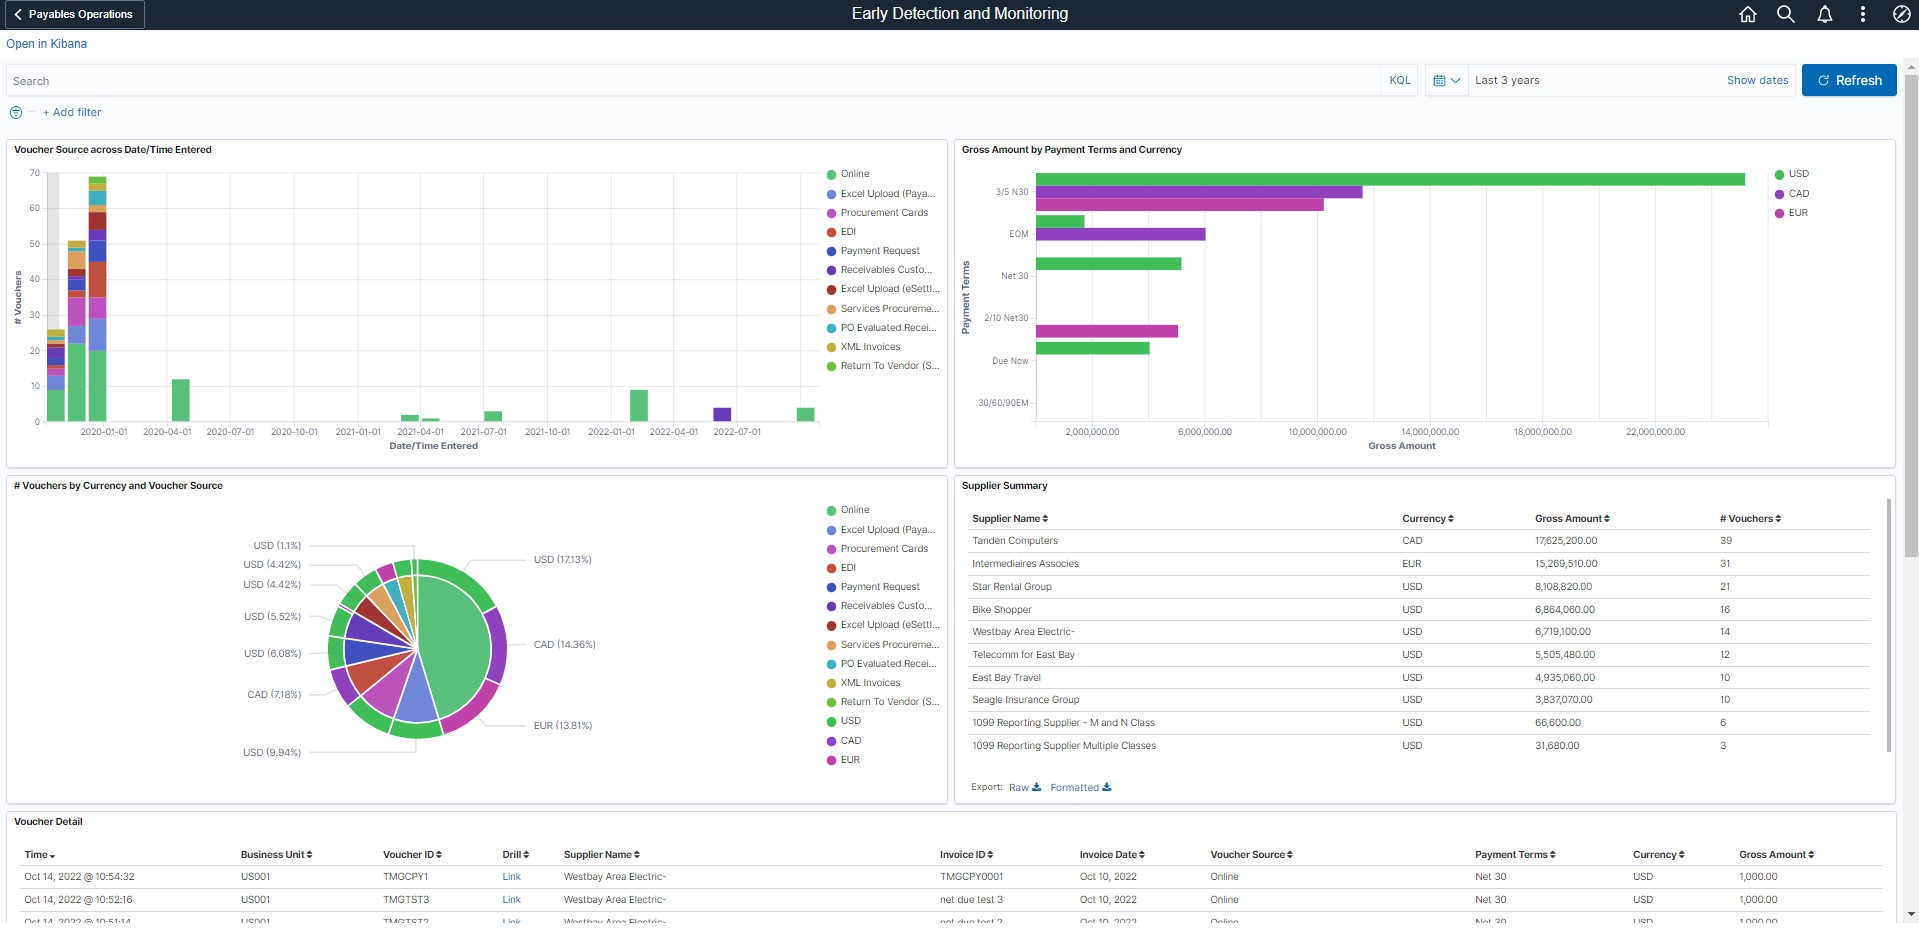
With this dashboard managers can see the voucher activity and can drill down into specific invoices to see what liability exposure has recently arrived. The Early Detection and Monitoring dashboard displays the following visualizations:
- Voucher Source across Date/Time Entered
- Gross Amount by Payment Terms and Currency
- # Vouchers by Currency and Voucher Source
- Supplier Summary

- Voucher Source across Date/Time Entered visualization shows the number of vouchers by voucher source for a given date/time range. Managers can view and monitor the volume of vouchers being entered and which sources are being used.
- Gross Amount by Payment Terms and Currency visualization shows the gross amount by payment terms for currencies for a given date/time range. This shows gross liabilities across various currencies by payment terms and the expected disbursement based on when the vouchers are to be paid.

- # Vouchers by Currency and Voucher Source visualization, similar to Voucher Source across Date/Time entered allows managers to view the number of vouchers by source for given currencies.
- Supplier Summary displays the top 10 Suppliers based on gross amount.
A few examples of actions you can take with the visualizations in the dashboard:
- Apply a filter to the data (like currency code)
- Apply multiple filters (like currency code AND payment terms)
- Change the date range (either using the Timepicker or by selecting dates/times in a date histogram)
- Drill from the Saved Search (grid) to view the voucher in the Document Status page
- View the visualization full screen (and minimize back to normal)
There are several ways to apply filters; the easiest is select what you are interested in. In some cases, what you have selected represents more than one filter; and in this case you can select / unselect from a list before applying the filter(s).

When the green bar above is selected it represents two filters, currency = USD and payment term = 3/5 N30, the list of the 2 filters are presented as selected:

Select Save to add both filters – a filter on currency (USD) and a filter on Payment Terms (3/5 N30); or unselect for just one filter.
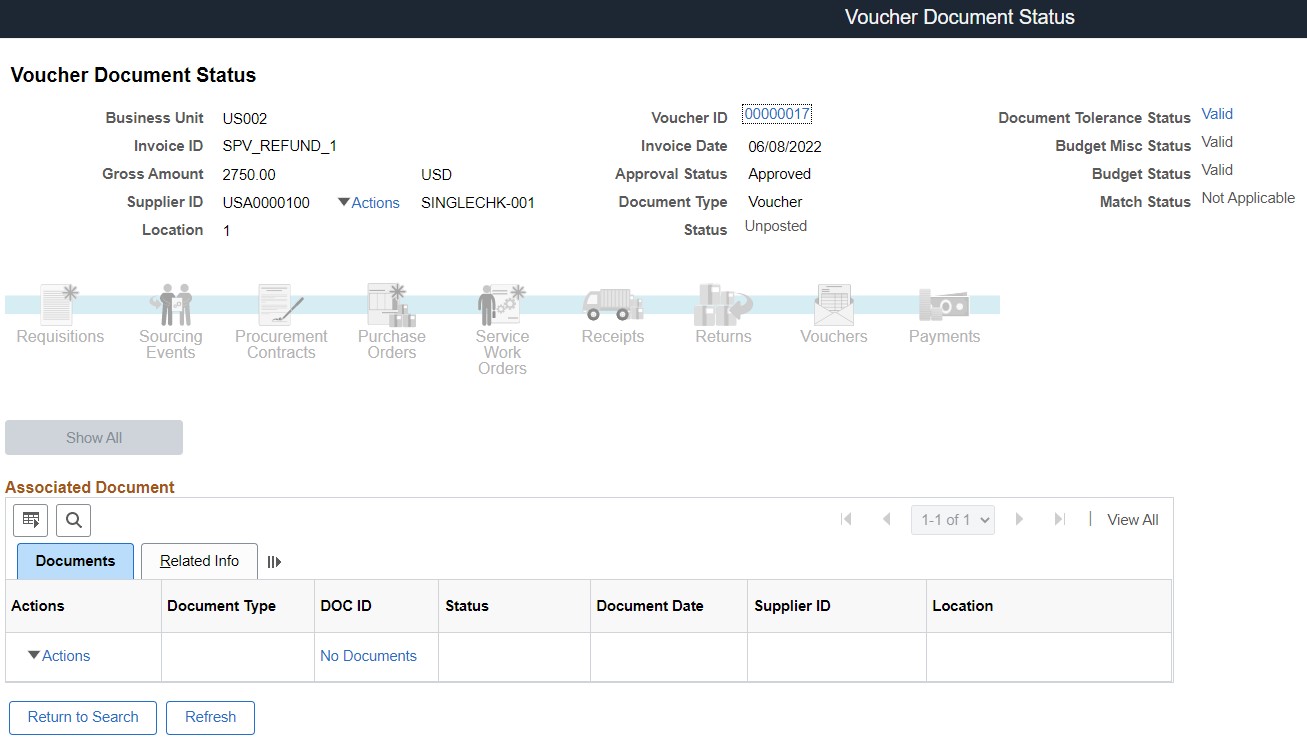
At the bottom of each of the Payables dashboards, there is a grid of all vouchers meeting the current filter criteria. There is a hyperlink that can be selected to see the voucher details in the Document Status page:

To view additional voucher specific details use the Drill link that will open up the Document Status inquiry page!
Trend Analysis:
The Trend Analysis dashboard provide the Accounts Payable Manager as well as the Cash Manager a period based view into an organizations liability exposure that will identify such things as:
- Month over Month liabilities
- Year over Year liabilities
- Ability to view anomalies over user defined time periods
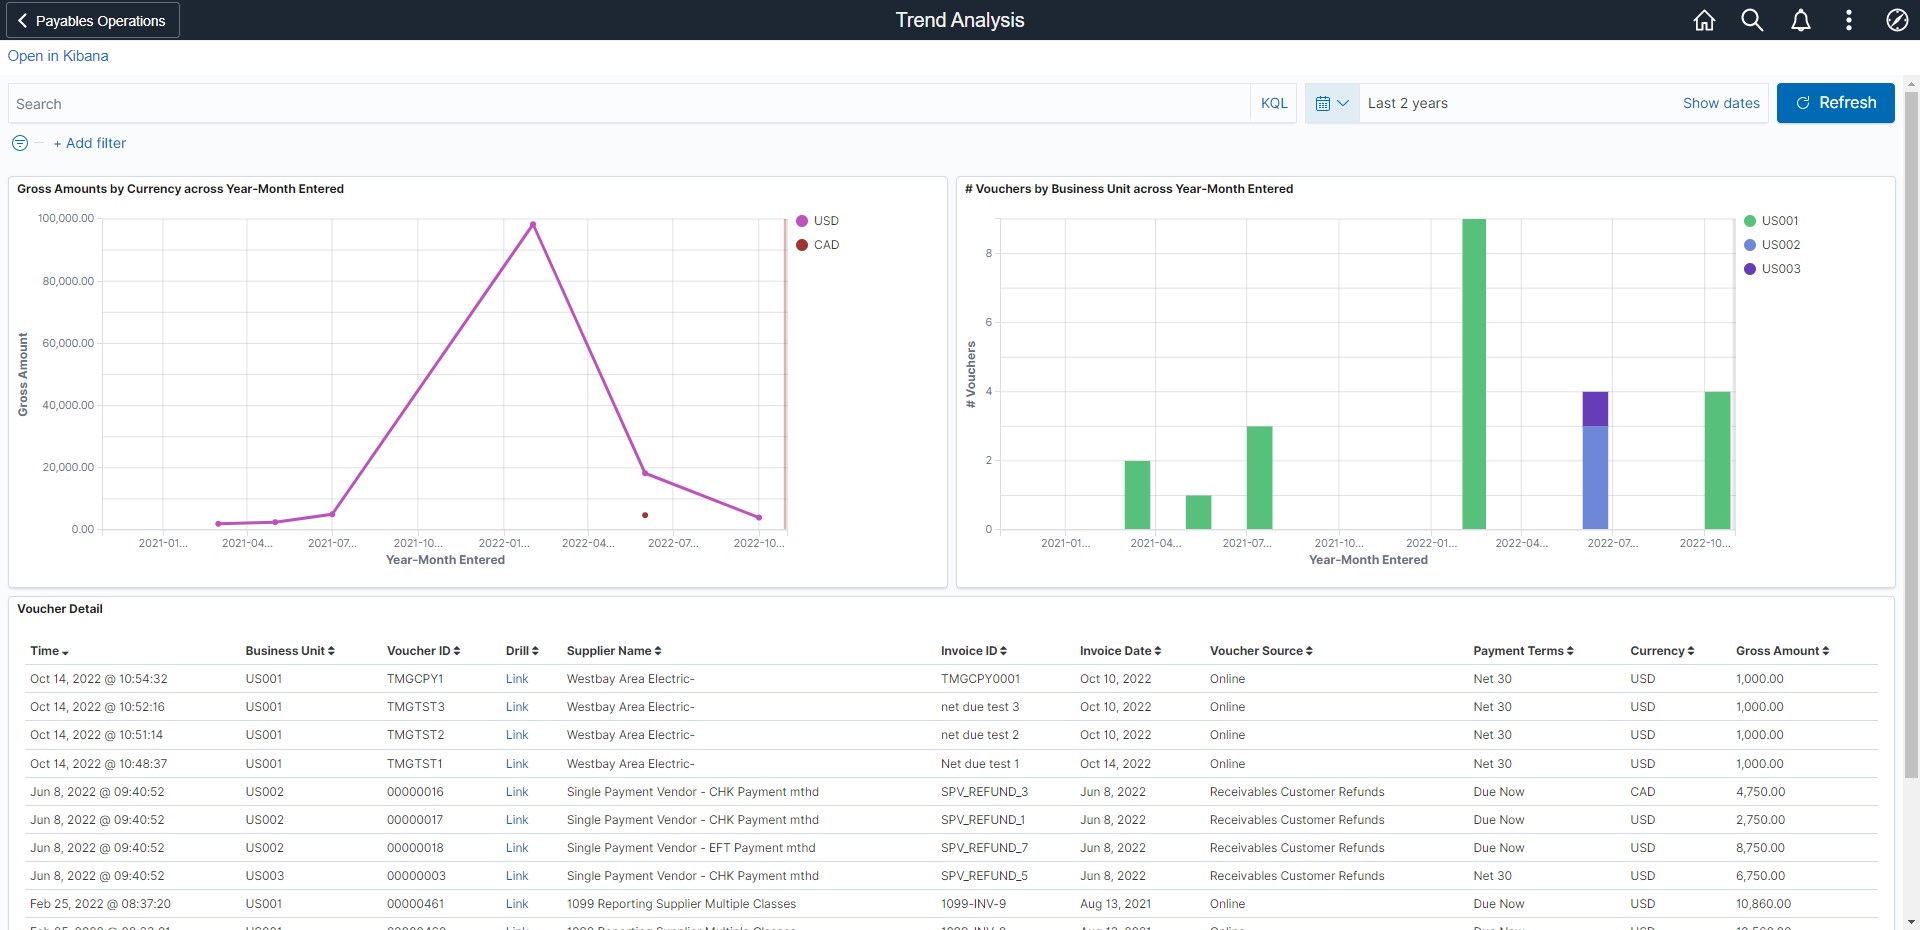
With this dashboard managers can see the liability exposure across financial periods by currency and can drill down into specific invoices to see further details. The Trend Analysis dashboard displays the following visualizations:
- Gross Amounts by Currency across Year-Month Entered
- # Vouchers by Business Unit across Year-Month Entered

- Gross Amounts by Currency across Year-Month Entered visualization displays the gross amount of all vouchers by currencies over a given period range giving manages a view into liability exposure by currency and period
- # Vouchers by Business Unit across Year-Month Entered visualization displays the total number of vouchers by business unit over a given period range.
Deploying Early Detection and Monitoring and Trend Analysis dashboards:
Before the Early Detection and Monitoring and Trend Analysis dashboards can be used, they must be deployed and added to a homepage.
Note – these two dashboards are also available as Tiles that can be added to a homepage.
To deploy the four delivered Accounts Payable Kibana Dashboards navigate to PeopleTools>Search Framework>Administration>Deploy Kibana Dashboards

Select all four and press the Deploy button. After deploying all four dashboards’ status should be “Deployed”.
Early Detection and/or Trend Analysis Tile(s) can then be added to a new Homepage or an existing Homepage.
When adding the tile you can search for “Kibana” or “Early Detection”/”Trend Analysis”.

To view the dashboard in the Kibana Visualizer page, click anywhere on the tile.
For further details related to configuring Kibana please see the Installation Documentation in My Oracle Support!