This blog assumes the reader has experience working with Logging Analytics and can apply basic principles of geolocation.
There are many reasons businesses choose to collect log data, such as for IT Ops, security, and compliance purposes. Geographic data enrichment to log data adds additional contextual information to better ascertain where something is occurring or where the impact has occurred. Geolocation is the process of mapping public IP addresses in logs from different apps and devices with geo-coordinates & location metadata. If you are interested in looking at a geographical view of logging data to visualize and plan by geographic location, Geolocation analytics can help you do that.
Examples why businesses should invest in geolocation Logging Analytics
Here are different industry examples on why businesses should invest in geolocation enriched Logging Analytics:
- Proven to be a key driver of sales & traffic by providing insights into why people visit your business
- Identifying security issues in your application and network can be simplified and significantly accelerated
- Real-time asset tracking and construction equipment maintenance planning
- Education institutions can enhance and optimize their online classes experience
- Industries and business sectors where location is integral, such as construction, retail, logistics, transportation, oil and gas, mining, manufacturing, and more.
Logging Analytics taps into organizational log data to drive powerful insights
Geolocation analysis takes time to set up and complete in a scalable and repeatable manner. Oracle Logging Analytics’ new geolocation enrichment and analytics can ease that for your organization’s decision-making capabilities with powerful insights into the spatial patterns that exist in your organization’s log data.
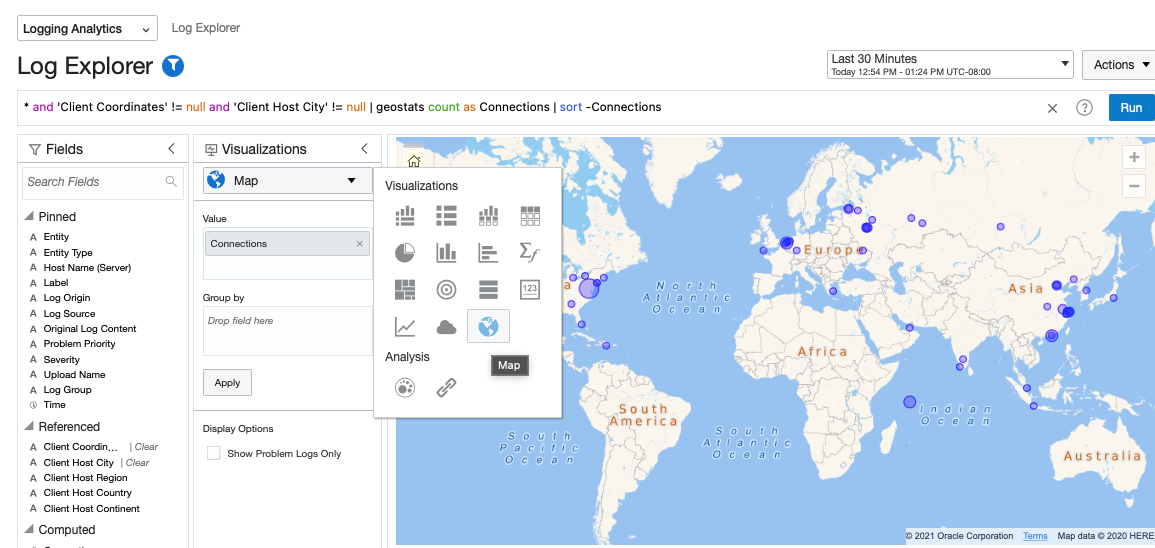
Geo-enrichment capability is available at no extra cost when you use Logging Analytics today and all out-of-the-box log sources are already pre-configured for geo-enrichment. Just select a source such as Load Balancers, Audit Logs, or VCN Flow Logs and then click the map visualization in the Log Explorer. Here are some of the ways customers are using Logging Analytics for geo-visualization.
Mapping number of unique visitors by location with Logging Analytics
Visualize dense geolocation data by combining nearby points and see tabular summary to drill down easily.
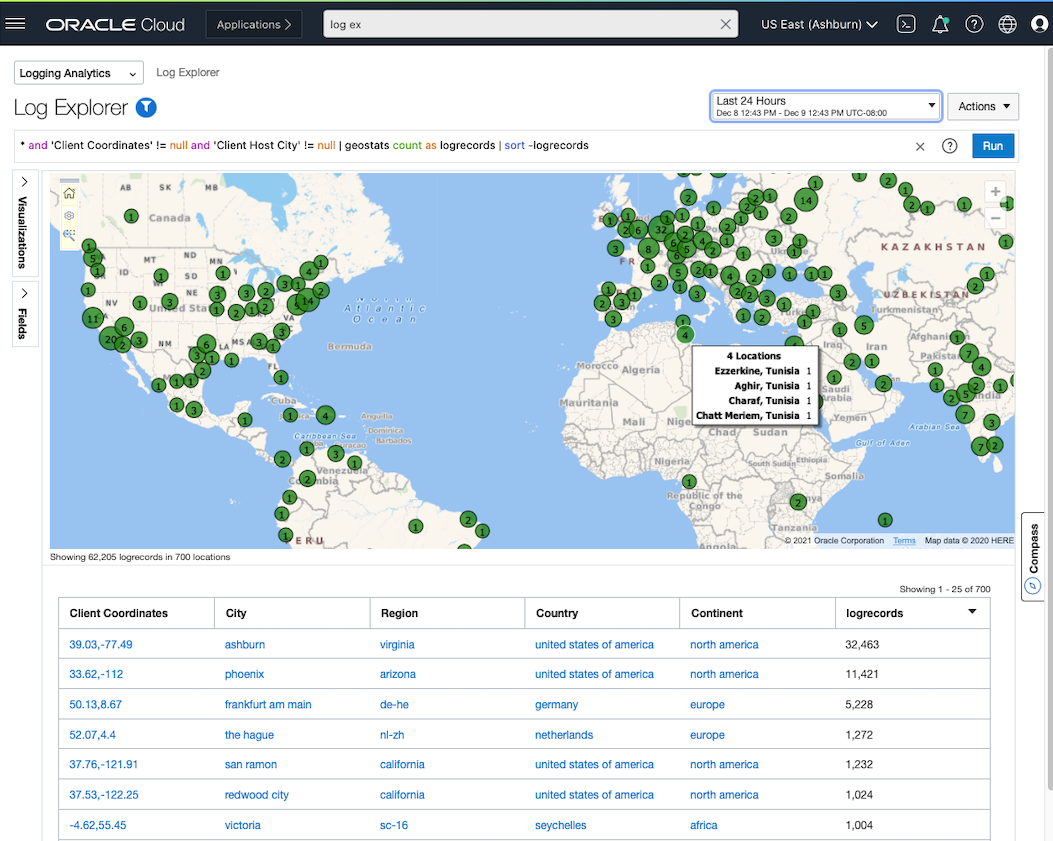
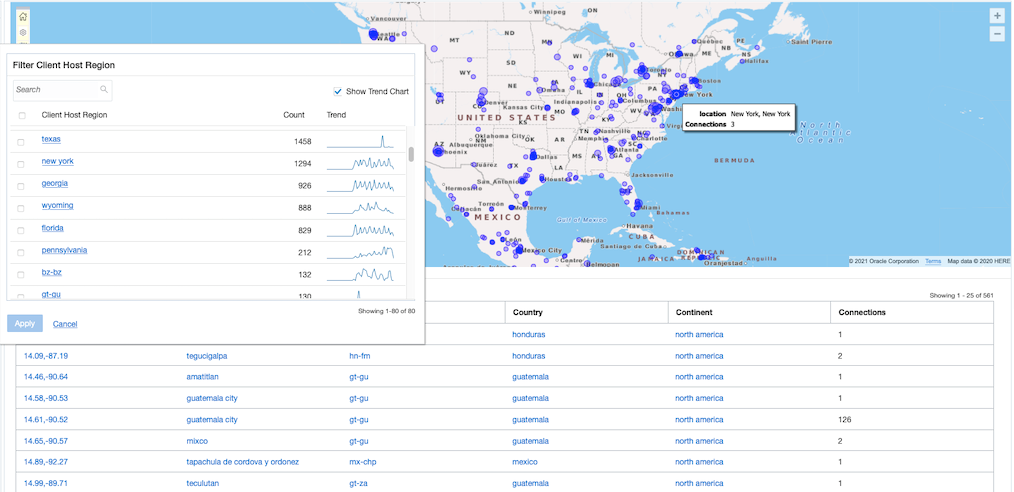
Quickly drill down based on City, State, Country, or Continent, or simply draw your custom region to filter down.
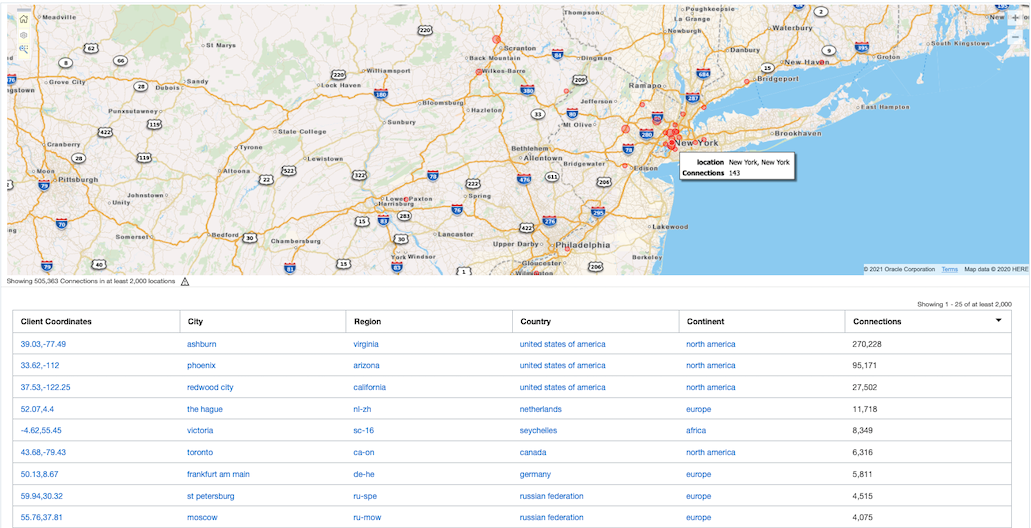
Select the right level of details depending on your use case
Extend source definition to enable Geolocation Enrichment with Log Explorer
Geolocation enrichment can be enabled for any type of log by extending the source definition as explained here. Map visualization is now generally available as an option in the Visualization panel in Log Explorer.
Do you want to get location-specific insights or enrich your geolocation log data? Review our latest documentation here.
In our next blog, we will be covering a specific use case: Geolocation enrichment for securing Private IP addresses. Stay tuned.