Grafana is an open-source visualisation and dashboarding platform that seamlessly integrates with Oracle Cloud Infrastructure (OCI) to visualise Observability and Management (O&M) metrics. Selecting the OCI Marketplace Grafana deployment, helps reduce the time and effort required to setup. Simply select from a range of Linux shapes and versions, and tailor it to suit your various use cases and workloads. The image makes it easy to get started and comes with pre-configured security rules, ports, policies and oci-metric-datasource. Additionally, example dashboards for various O&M services are provided for easy import and can be modified and cloned as needed.
This guide outlines the process of deploying Grafana on OCI using Marketplace.
Deployment Process Overview
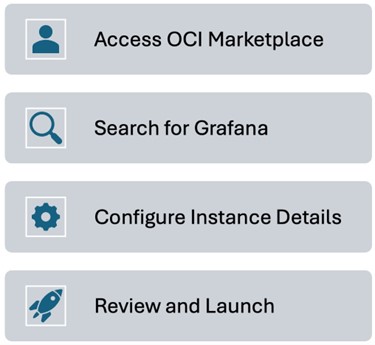
Access OCI Marketplace
Log in to your OCI tenancy and navigating to the Marketplace. Marketplace can be found by clicking in the main navigation menu and selecting “Marketplace”.
Search for Grafana
Once in the Marketplace, select “All Applications” and use the search bar to look for “Grafana”. Select the Grafana image, chose the latest Version and select the Compartment to install in, finally click Launch Stack. Click Next on the Stack information page.
Configure instance details
After the Instance has been Launched, configure your instance with the steps below:
- Choose your Compartment
- Select Availability Domain
- Pick your instance shape (CPU, RAM, etc) and Linux image type
- Configure Network options
- Set up SSH keys for secure access
- Enter Host and Policy names
Review and launch
Review your selections to ensure they meet requirements. Once satisfied, click “Launch Instance” to deploy Grafana.
With these steps completed, your Grafana instance will be up and running in OCI, ready for you to connect to the oci-metric-datasource and start building and importing O&M dashboards. Next, we’ll explore some pre-built dashboard to jumpstart monitoring.
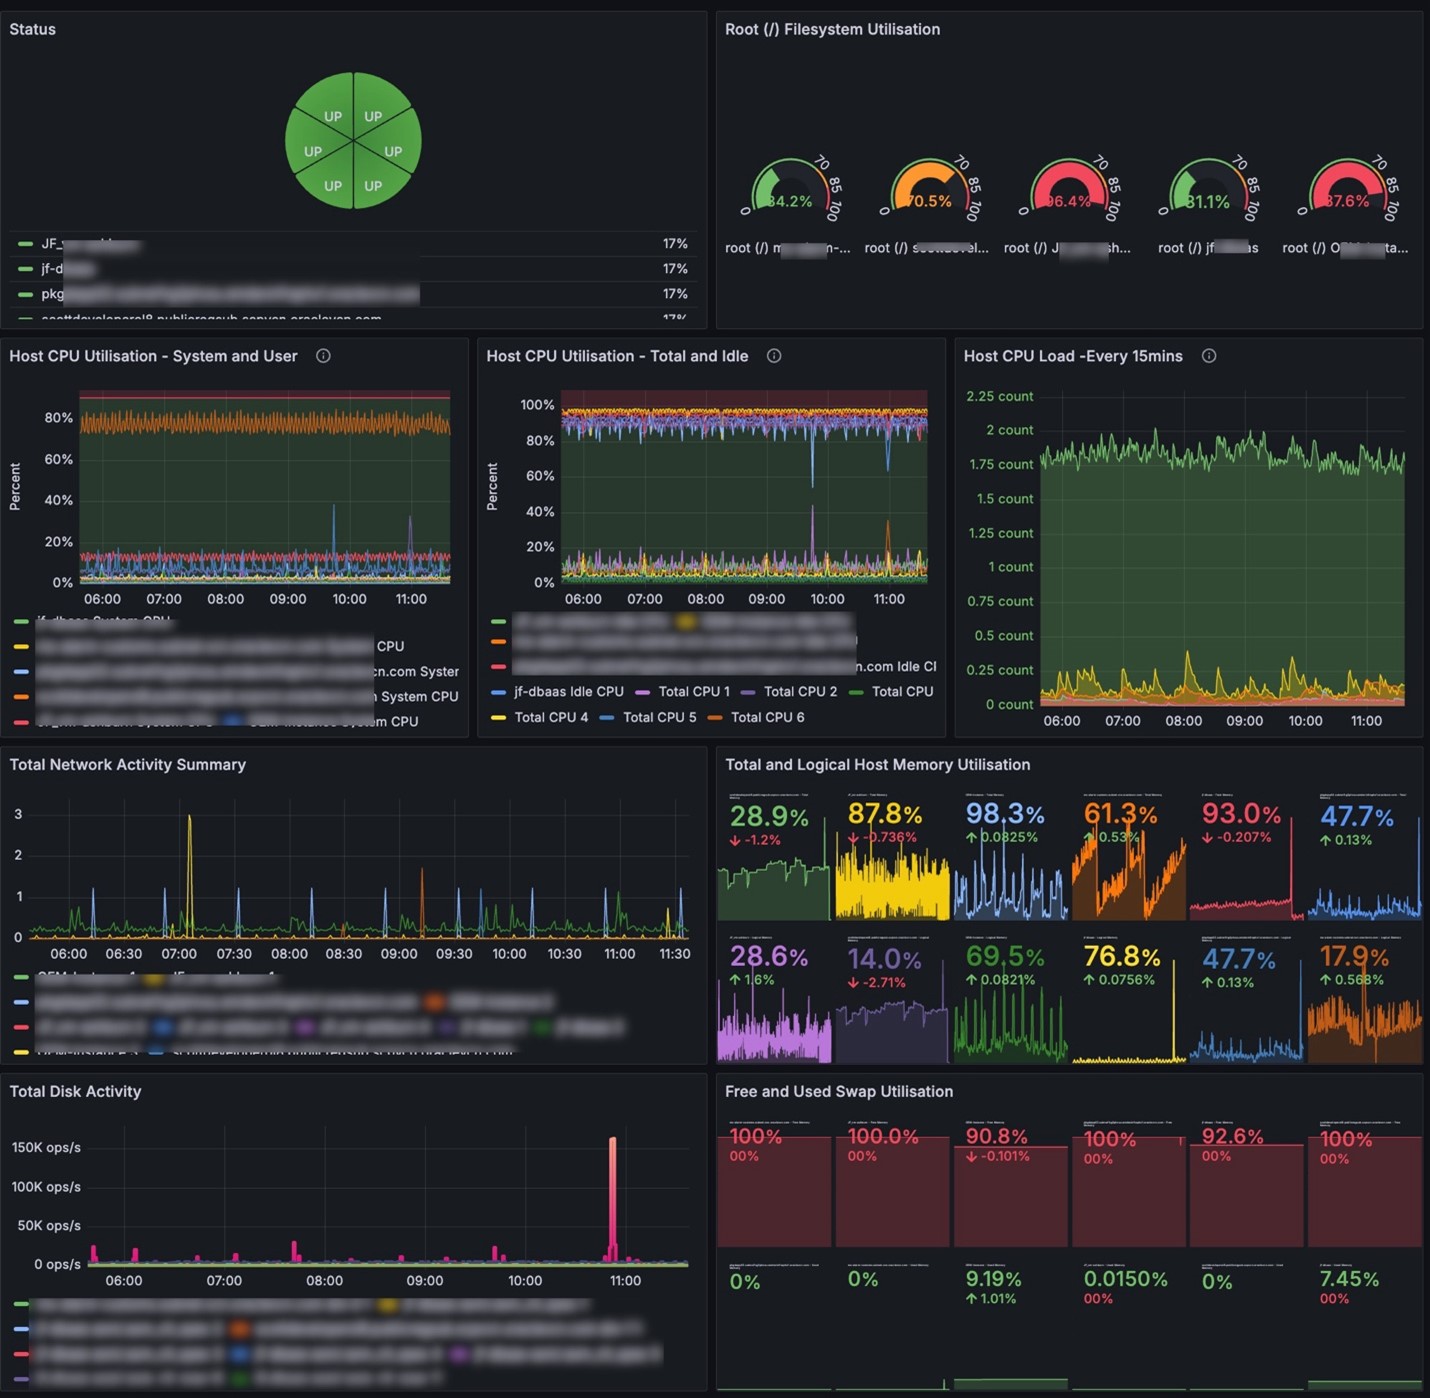
Ready to use O&M pre-built dashboards
Under the ‘Dashboards’ directory on GitHub, discover the pre-built O&M example dashboards for Application Performance Monitoring (APM), Database Management, Ops Insights (OPSI), and Stack Monitoring. These ready-to-use dashboards can be easily configured to suit your specific needs.
Once dashboards are imported, each dashboard comes with a set of instructions on how to use them, including the required namespace for visualisations.
To customise your view and display metrics, access the filters at the top for each dashboard. Find options to select Regions, Compartment, Namespace, Resource group (if required) and Dimension.
What you can expect from Pre-Built Dashboards
These dashboards provide a starting point for visualising your O&M metrics, allowing you to quickly identify trends, track performance, and troubleshoot issues.
- Stack Monitoring: Get real-time visibility into infrastructure performance, including CPU usage, memory consumption, and disk space.
- Database Management: Monitor database performance, track metrics like active sessions, and tablespace usage.
- Application Performance Monitoring (APM): Gain insights into application performance, including Heap and Garbage metrics among other.
- Ops Insights (OPSI): Dive deeper into operational metrics, to figure out which entities are over and underutilised.
These pre-built dashboards provide instant insights into your OCI metrics, reduce the complexity of learning to building dashboards from scratch, and help you focus on customising and adding visualisations to meet metric requirements.
Customising Grafana dashboards to suit your needs
While the pre-built dashboards are useful, it’s easy to clone and edit the visualisations to tailor for your specific needs. In addition, you can create dashboards that visualise different data sources, metrics, and dimensions, allowing you to design a monitoring solution that aligns with your business requirements.
Deploying Grafana on OCI through the marketplace simplifies the process of setting up dashboards to visualise metrics. Quickly get up and running with its automated configuration of ports, security rules, policies and the availability of pre-built dashboards. The flexibility to customise these dashboards allows you to start monitoring your infrastructure and application immediately.
For a detailed step-by-step guide on deploying Grafana from the Oracle Cloud Marketplace, visit GitHub. In addition, you can view this video on deploying Grafana from the Marketplace and simplify your OCI O&M Monitoring and data visualiztion process.