With this release, Stack Monitoring now supports mission-critical Oracle Identity Manager (OIM) and Oracle Access Management (OAM) systems. Stack Monitoring is an Oracle Cloud Infrastructure (OCI) service that supports the discovery and monitoring of applications and their underlying tech stack components including Oracle Database. Stack Monitoring makes it easy to get started with monitoring mission-critical systems such as OIM/OAM.
Discovering either OIM or OAM is simple with UI
With the Stack Monitoring service enabled, discovering either OIM or OAM is simple using UI-driven discovery. Resources including OIM and OAM are created automatically as part of a WebLogic discovery, in the same way, Stack Monitoring discovers Oracle HTTP Server (OHS), Oracle Service Bus (OSB), and Service Oriented Architecture (SOA). Discovery of WebLogic will include WebLogic Cluster, Domain, and Servers as well as the OIM/OAM Cluster and servers. Simply, complete the fill-in-the-box discovery UI and click “Discover New Resource”. With the discovery complete, the next step is to relate the host the host to OIM/OAM servers that use it to complete the application’s topology.
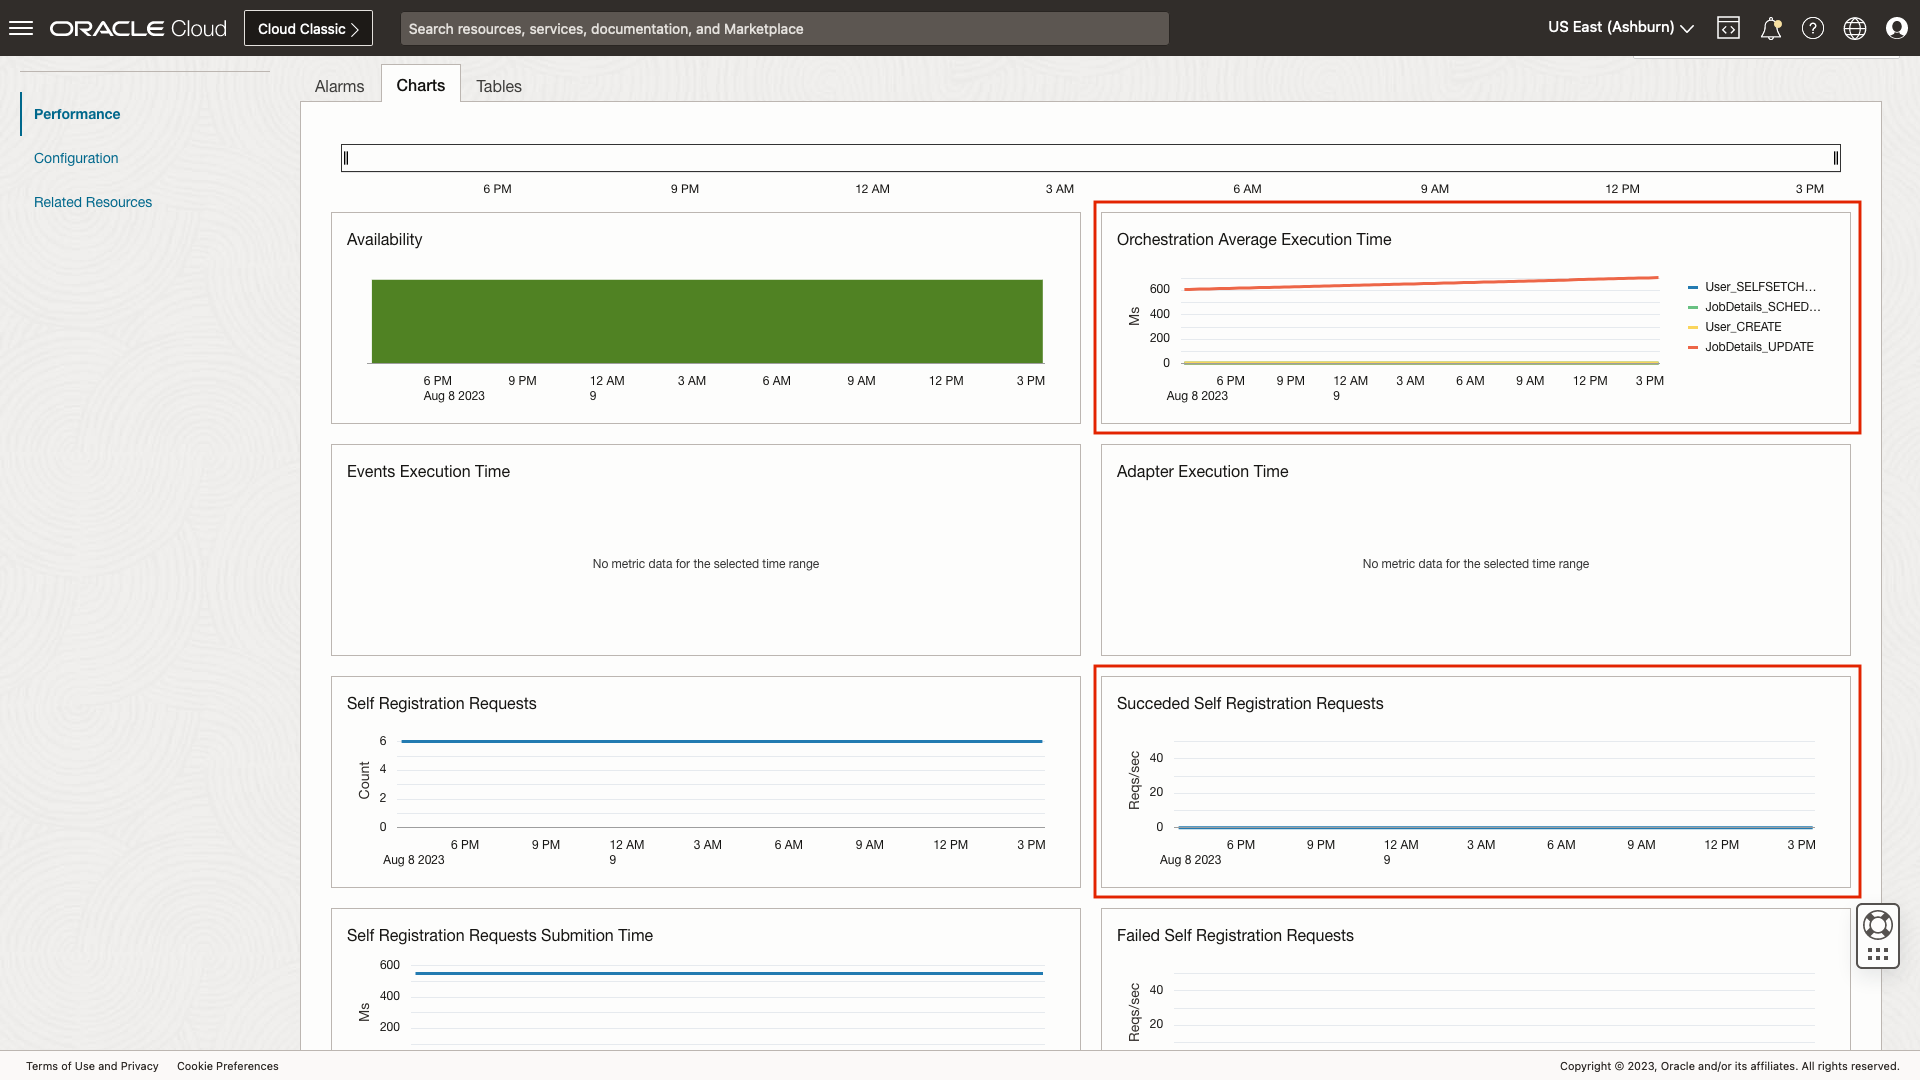
Oracle Identity Manager (OIM) home page provides insights into open alarms, health, and performance of operations
The Oracle Identity Manager homepage provides insight into any open alarms as well as the health and performance of the OIM operations. OIM operations typically complete multiple stages of orchestration. Stack Monitoring’s Orchestration Average Execution Time chart provides the ability to review the performance of orchestration over time. Or leverage the Succeeded Self Registration Requests to identify the rate of successful requests per second.
Oracle Access Management (OAM) homepage allows for quick investigation of performance problems
Using the Oracle Access Management homepage allows for a quick investigation into performance problems. Easily identify if there is an increase in Authorization or LDAP latency. Or review the authentication success rate to determine if there has been an increase in failed requests.

With Stack Monitoring’s guided discovery and simple onboarding, it’s easy to get started today monitoring Oracle Identity Manager and Oracle Identity Manager. Stack Monitoring’s auto-discovered topology provides a holistic view of the OIM/OAM application stack. To get started monitoring your OIM/OAM applications including the WebLogic Domain and servers see the documentation. Happy Monitoring!
Resources
- Getting Started with Stack Monitoring
- Stack Monitoring Blog Home
- Pricing (Application Performance Monitoring Service – Stack Monitoring – Enterprise Edition)