Author: Julian Cox, Cloud Infrastructure Manager, Redfaire Ltd
Back in early 2023, Oracle contacted Redfaire about their plans for a new monitoring solution, Observability and Management (O&M), designed to replace the existing Oracle Management Cloud (OMC). Oracle provided detailed timelines for the release of this new solution. At that time, Redfaire was monitoring over 30 customers’ systems with OMC.
With Oracle’s support and a clear transition plan as guidance, Redfaire documented the installation process and implemented O&M for each customer. It was essential for Redfaire to continue monitoring with OMC while O&M was being implemented. Oracle ensured this was possible, allowing visibility of customers’ systems during the transition by enabling both systems to work alongside each other. This seamless arrangement allowed Redfaire to resolve issues such as full disks and high CPU events without any break in service.
The implementation plan for O&M monitoring consisted of four stages, tailored to each customer’s JD Edwards system needs:
Implement with OCI Stack Monitoring and Logging Analytics:
1. The collection of standard metrics, provided by Oracle out of the box
2. The collection of application logs
3. The collection of metric extensions, coded by Redfaire and specific to a customer’s use case
And with O&M Availability Monitoring:
4. Call URLs to check the response and the timing of the response as health checks
The first three stages use the OCI Management Agent installed on the server being monitored. The fourth stage, availability monitoring, requires access to URLs in the JDE system. The locations initially provided by Oracle were either not appropriate for Redfaire’s needs or were too complex to implement. Oracle promised to review the options and return to Redfaire with a solution.
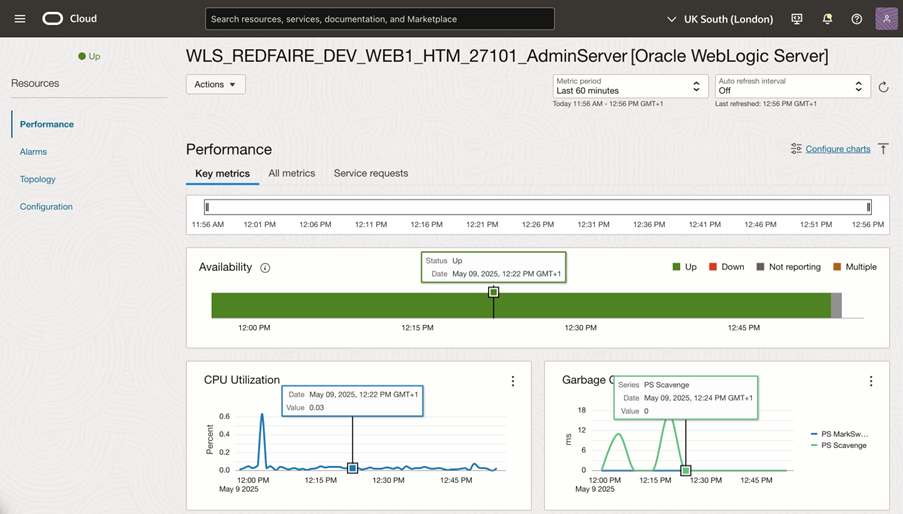
After some training, our Redfaire CNC team implemented the management agent installation process. Once completed, the hosts, web, and database server metrics began flowing in. This enabled Redfaire to create O&M Alarm Definitions, fine-tuned to each customer’s specific system needs. These alarms raise alerts based on metrics, notifying Redfaire of issues before they develop into system outages.
The logging analytics, which Redfaire uses to collect JDE system logs from enterprise and web servers, required additional time to configure properly. The flexibility provided by the numerous configuration options took some time to fully understand. Redfaire has now established best practices for implementation. Initially, we developed alerts for specific log entries, but now only maintain these for a few critical cases. Other log issues appear as warnings on dashboards—items of interest that require investigation but don’t threaten imminent system outages.
OCI Logging Analytics provides the Log Explorer, an excellent tool for quickly accessing JDE logs for a customer’s system. The log explorer includes tools that can filter logs for known issues with a simple checkbox selection. Searching is straightforward and returns lines across all log files for a selected period, with options to filter by server, log source, or specific log file. You can also generate summaries for each type of log entry, grouping similar entries together. This makes it possible to identify unique log entries among repetitive ones—a truly valuable capability.
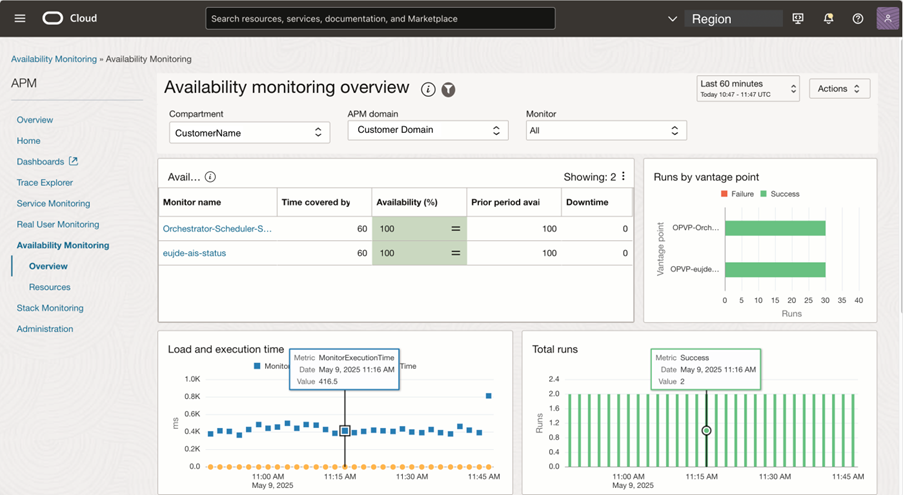
The implementation of Availability Monitoring, the fourth stage, became possible after Oracle provided On-premise Vantage Points (OPVP). An OPVP is created in the customer’s tenancy. Redfaire then defines availability monitors that check the status of solutions such as Redfaire Approval Connect. As an example, the OPVP uses the availability monitor details, including URLs, to check the status of each of the four Redfaire Approval Connect services. If any service is down, an alarm definition creates a ticket in our support system for follow-up by technical staff.
“By leveraging O&M’s deduplication features in our custom alert processing code, we’ve transformed how our teams manage alerts. This integration has enabled intelligent ticket handling—creating, updating, or automatically closing tickets based on alert states—resulting in an 80% reduction in open tickets. Complemented by our Active Alarm Definition dashboard, teams can now focus their efforts exclusively on critical active issues rather than managing ticket overflow.” Julian Cox, Cloud Infrastructure Manager
The transition from OMC to Observability and Management came with its challenges, but thanks to Oracle’s support and their responsiveness to our feedback—developing new solutions where needed—Redfaire now has a successful implementation of Observability and Management.
Today, Redfaire is in a strong position to benefit from this new monitoring solution as we fine-tune it to each customer’s configuration needs. Built into the Oracle Cloud Infrastructure solution, we’re confident it will continue to evolve and support our future challenges.
Resources
- Redfaire,the leading Oracle JD Edwards & Oracle Cloud Partner
- Oracle Stack Monitoring
- Oracle Log Analytics