As we prepare for many exciting new features to be released in early 2025, the Stack Monitoring team is thrilled to share an update on the incredible progress that has been driving our mission to enhance observability and monitoring capabilities. We’ve been hard at work, releasing a plethora of new features and support for new resource types to empower our users and ensure seamless Stack Monitoring. Here’s a rundown of the Top 12 exciting developments that took place in 2024:
1. Scheduled downtime made easy with topology-aware Maintenance Windows
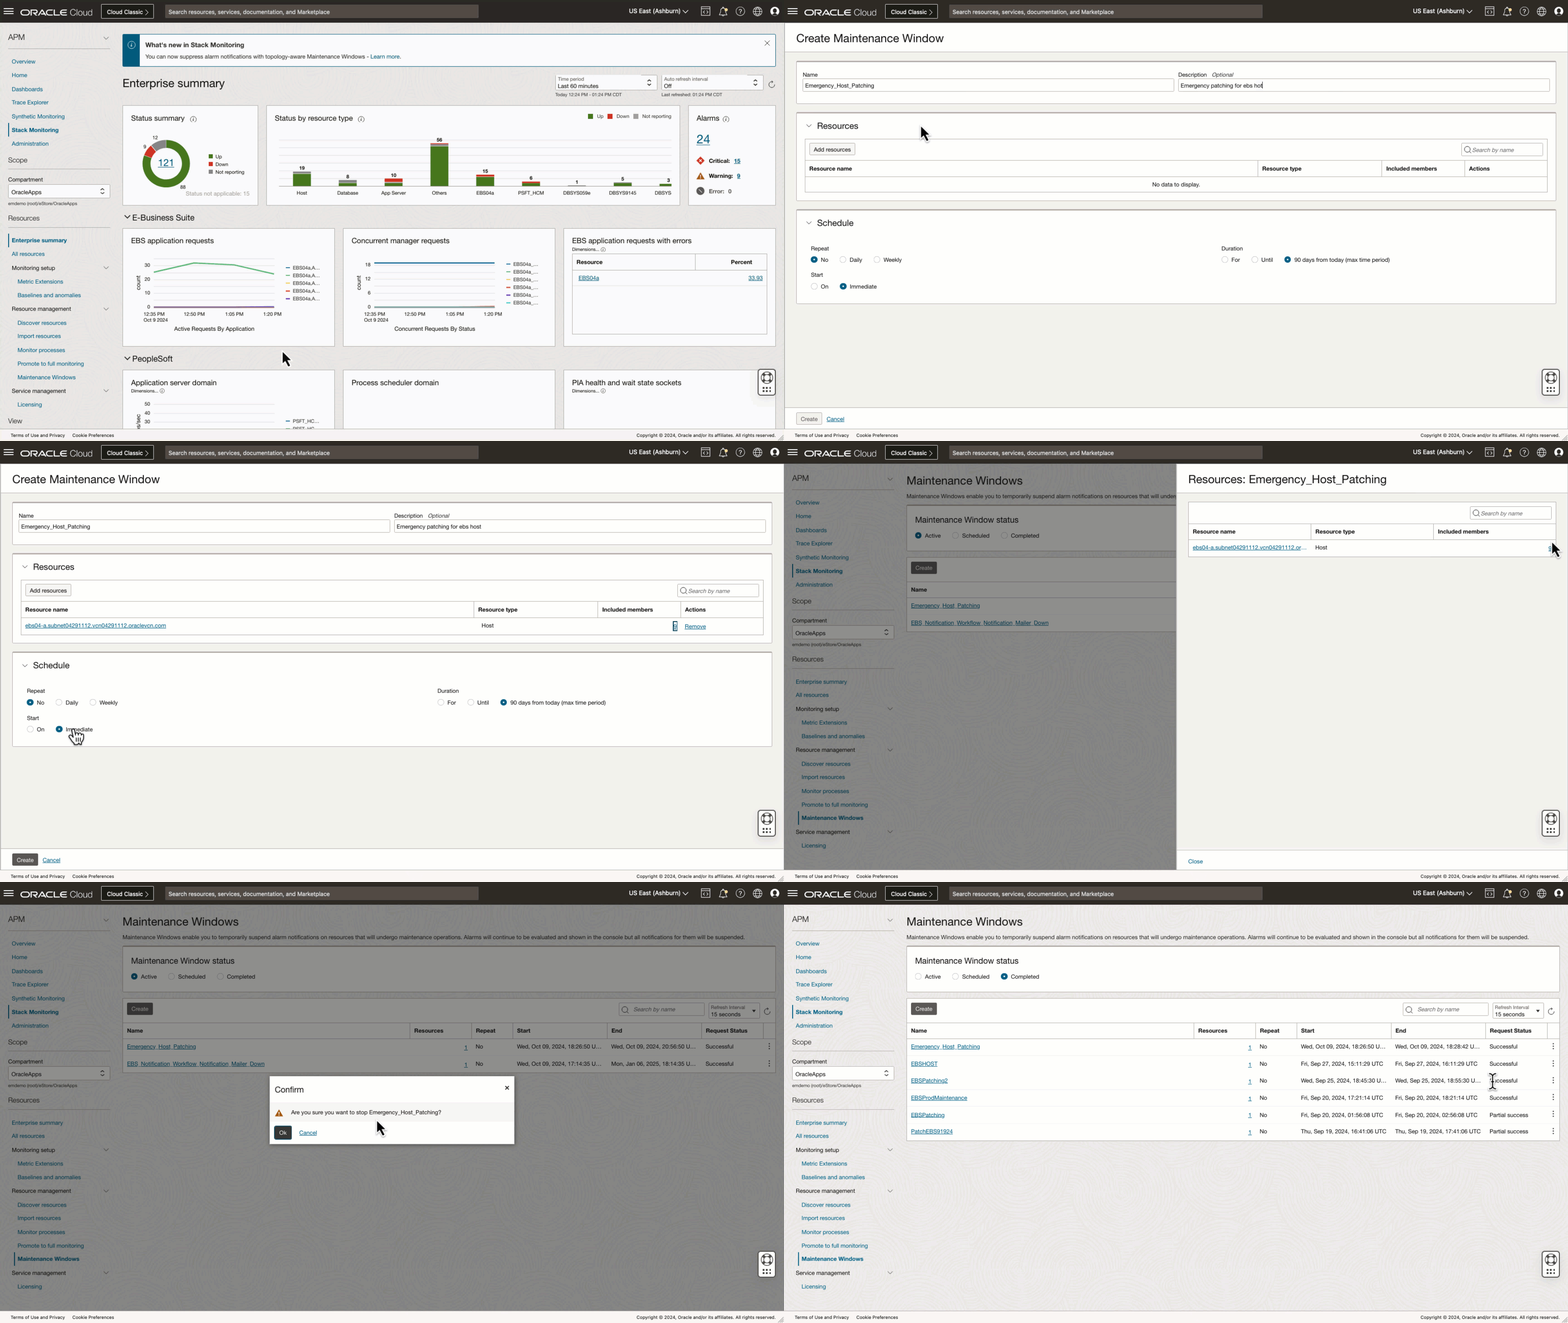
Suppressing alarms notifications when performing maintenance can help reduce alarm confusion to on-call teams and reduce alarm fatigue. Today when creating alarm notification suppressions operations teams must identify all alarm rules related to all the resources (host, database, app server, etc.) and create individual suppressions for each resource and all their respective alarm definitions. For example, when patching a fleet of hosts, identifying all the alarm rules for the hosts and resources running on the host can be time consuming and error prone. Maintenance Windows simplifies this process by placing the focus on identifying the resources under maintenance instead of individual alarm rules. Users can now focus on identifying the hosts under maintenance, including filtering the desired set of hosts using tags. Since Stack Monitoring is topology-aware, the Maintenance Window will automatically identify all the resources running on those hosts and include all the associated alarm rules across the entire set.
Creating a Maintenance Window for a host

2. Tailor monitoring for your unique environment with customizable baselines
Identifying performance problems becomes costly if not identified and resolved quickly. If users are reporting slowness, anomalies provide quick visual identification if a resource is performing outside its historical norms and helps to answer the question is this performance expected. Stack Monitoring uses Machine Learning to automatically calculate baselines on key performance metrics. If a metric performs outside of the baselines, Stack Monitoring flags these values as anomalous. Users can further extend the out-of-the-box metric set and enable baselines on the metrics and the resources most important to them. For example, users can now enable baselines on Metric Extensions, Oracle Database Systems (cluster, ASM, listener, etc), resources imported using Prometheus, as well as imported OCI services including load balance, block storage, and OCI MySQL database.
3. Fresh and intuitive interface with revamped resource home pages
The resource home pages have received a major facelift, offering a sleek and intuitive user experience. The new design allows users to configure performance charts to prioritize and hide/show metrics most important to you.
4. Windows Server environment Support for IIs
Expanding our reach, we added support for Microsoft IIS (Internet Information Services) on Windows Server. This enables monitoring of IIS-based web applications, providing critical insight into the health and performance of IIS environments including IIS website metrics. For example, identifying the current web request rate, number of open HTTP sessions, connection attempt rate and more.
5. Streamlined host monitoring with host auto-promotion
Automatically monitor every host in a compartment with host auto-promotion. Host auto-promotion will automatically monitor a host once a Management Agent has been installed. This significantly reduces the setup time and effort required by users to monitor a host running in OCI, on-premises, and other cloud providers. Watch for further process enhancements in this area in 2025!
6. Adding open-source monitoring Prometheus support
Stack Monitoring now integrates with Prometheus, the popular open-source monitoring solution. This integration greatly extends the variety of resources provided by Stack Monitoring out-of-the-box by importing Prometheus-based resources. Once the Prometheus-based resource has been imported, users can make use of all the features included with an out-of-the box resource. For example, home pages, baselines with anomaly detection, Maintenance Windows, and associating with other Stack Monitoring resources to complete the topology.
7. Monitor any host process as a resource with process-based resources
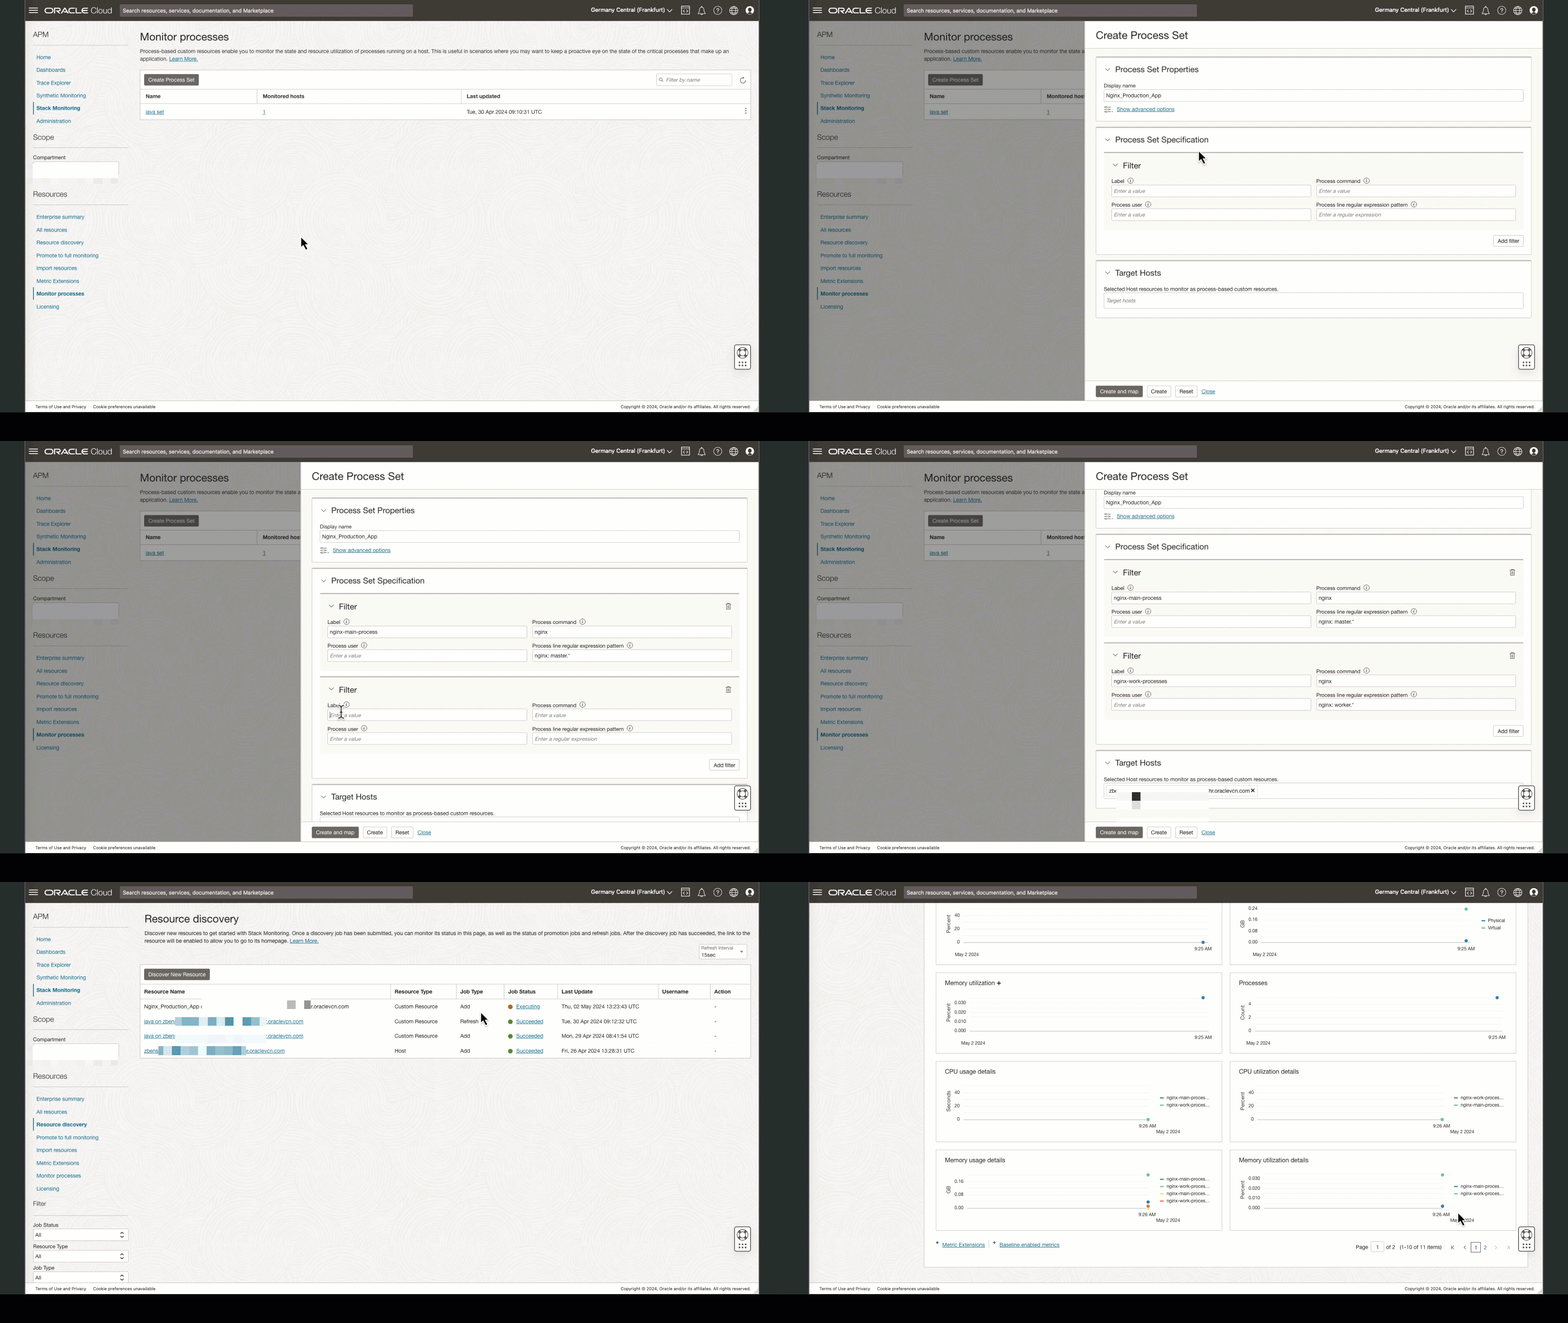
We introduced process-based resources. If your business has a requirement to monitor a unique application that is running on a host, Stack Monitoring helps you meet that need with process-based custom resources. Creating your process-based resource is easy using our UI driven workflow to define the processes that make up your custom application running on the host. Once you create a process-based resource, Stack Monitoring will create a home page and immediately begin monitoring the custom application for availability and performance.
Monitoring Nginx using process-base monitoring

8. Monitoring open-source web servers adding support for Apache HTTP Server
Apache HTTP Server users can now rejoice! We added support for monitoring Apache-HTTP Servers, to help answer questions like what the total number of idle and busy workers are, and what is my web request rate
9. Expanding enterprise capabilities with support for Oracle HTTP Server (OHS) and Oracle Service Bus (OSB)
Our focus on enterprise solutions continued with the addition of Oracle HTTP Server and Oracle Service Bus monitoring. These features cater to Oracle users, offering access to key health and performance metrics for these unique resource types. Regarding OHS, reporting the number of busy workers and processes, web request rate and throughput to name a few. When monitoring OSB, Stack Monitoring provides details into the throughput, response time, and errors to help ease troubleshooting.
10. Ensuring data replication excellence with new Oracle GoldenGate monitoring
Stack Monitoring can monitor both OCI GoldenGate and GoldenGate Microservices Architecture. Leveraging the single-click discovery UI, Stack Monitoring will discover the entire GoldenGate application stack, including admin service, receiver, extract, and replicat to name a few. Once discovery completes, Stack Monitoring will immediate begin monitoring availability and performance including important metrics such as monitor lag, I/O rates, etc. Using the GoldenGate Stack View, you can review the health and performance of the critical GoldenGate components in a single view.
11. Comprehensive directory monitoring of Oracle Unified Directory (OUD)
Stack Monitoring introduced comprehensive monitoring support for Oracle Unified Directory, covering all aspects of directory service performance. Additionally, users can benefit from multi-tab pre-built dashboards, which provide instant visibility into the health, load, and general metrics of their OUD service.
12. New HTTP/REST monitoring and more enhanced Metric Extensions
The year saw an enhancement of our Metric Extensions, including support for HTTP/REST, allowing users to monitor APIs and web services more effectively. This opens new possibilities for monitoring modern, service-oriented architectures.
As we start a new year’s journey, the Stack Monitoring team is grateful for the continuous support and feedback from our customers, partners, ACE’s and user communities. These new features and resources demonstrate our commitment to delivering best-in-class monitoring solutions, catering to a wide range of use cases and environments.
Stay tuned for an even more exciting 2025, as we continue to push the boundaries of observability and empower our users with innovative monitoring capabilities.
Happy monitoring!
