Whether you have one or many Exadata Cloud@Customer (ExaDB-C@C) deployments, administration tasks can be burdensome to ensure healthy, performant databases are providing the best foundation for running critical application workloads. The Oracle Cloud Infrastructure Database Management service (DBM) now provides native support of Exadata Cloud@Customer databases for monitoring and administering your entire fleet of databases running on Exadata systems. By combining powerful tools with enhanced visualizations, Database Management decreases the time and effort in managing databases for database administrators while increasing the productivity of application development for developers.
View all of your Exadata databases in a single performance overview
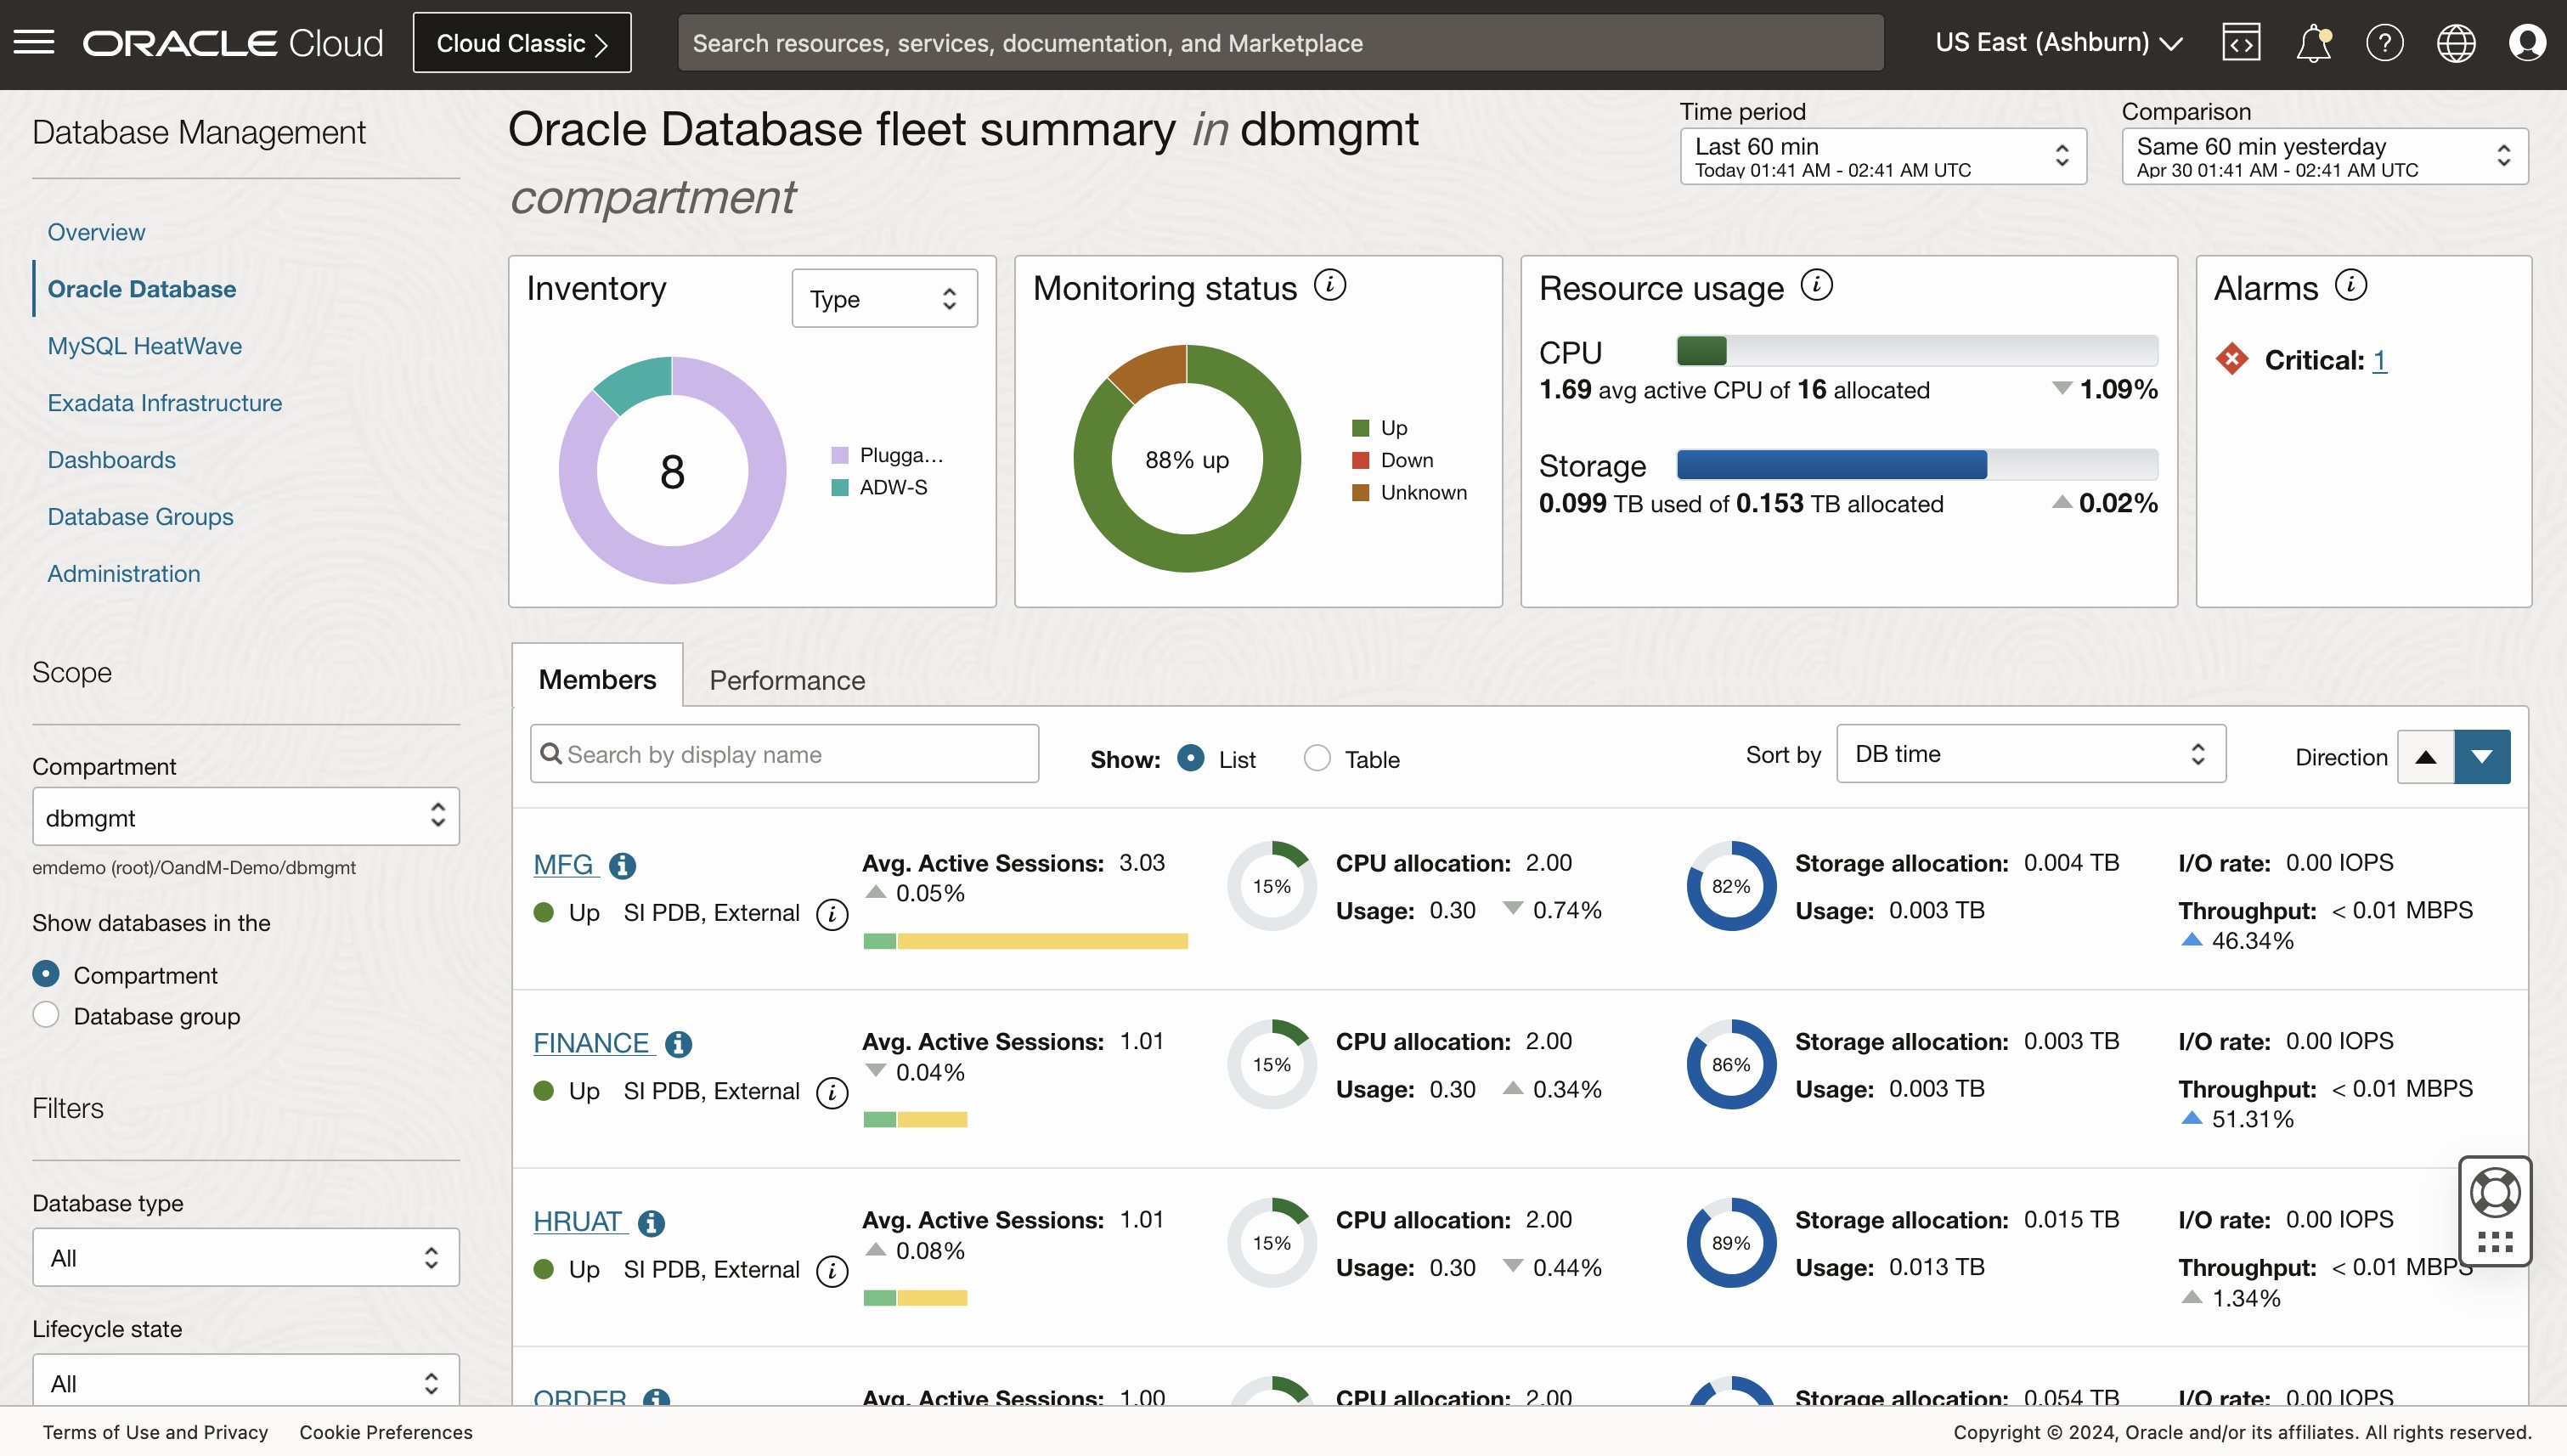
The fleet overview in Database Management provides a detailed analysis of resource utilization and short-term trend analysis for all of your databases deployed anywhere. Top metrics including Average Active Sessions, CPU utilization, storage utilization, and I/O are displayed through insightful visualizations to quickly assess the health and trends of resource utilization for all of your databases. You can quickly find top consumers and drill down to investigate performance spikes, degradation events, or soon-to-be bottlenecks, and a consolidated alarm view indicates any immediate concerns to address for your database fleet. A tree-map view will differentiate top consumers of resources on your Exadata hardware or highlight unexpected resource utilization trends for databases. Database group and tag filters provide ways to further narrow the scope of resources when evaluating resources. For example, you could group databases running on an Exadata rack or supporting a specific application or even by criticality.
Performance Hub provides in-depth, real-time analysis of database activity
Utilizing the Performance Hub tool for Exadata databases provides a real-time view of activity on your database over time. Individual analysis of SQL statement runs, including wait dimensions and session details, indicate top usage on the lowest dimension and provide key visibility into which users or applications are having the most impact on database performance at any given time. Drilling down to individual SQL execution details gives an analysis of how the query has been running over time and provides a platform for troubleshooting or tuning SQL statements. Additional tabs provide SQL Monitoring details, blocking sessions, ADDM report information, and detailed Exadata storage infrastructure performance statistics. To learn more about Performance Hub in Database Management read this blog.
Full circle performance tuning is easy in Database Management
Performance tuning has never been easier as Database Management provides a single console for improving the performance of your database. Rich visualizations and integrated features allow a user to quickly configure and view performance tooling for the database.
- SQL tuning set administration allows a user to create and alter SQL tuning sets for your database.
- Once created, the SQL Tuning Advisor can be invoked to assess the SQL plan for a query and further utilized to improve the performance of the query running on the database.
- The SQL Plan Management feature provides a detailed overview of SQL plans in the database. Individual details for profiles can quickly be seen and altered for granular control of how SQL statements are running in the database. Furthermore, [evolve advisor] can be configured and altered within the SPM feature to ensure constant evaluation of SQL plans and reduce the chance of degradation over time with stale execution plans.
- Finally, the Optimizer Statistics feature gives insights into the collection of Optimizer statistics in your database. Having a performant environment requires up-to-date and accurate statistics for SQL queries to choose the best plan for running against the database. The Optimizer Statistics Advisor can be used to gain suggestions for stats gathering and evaluate each object for best practices.
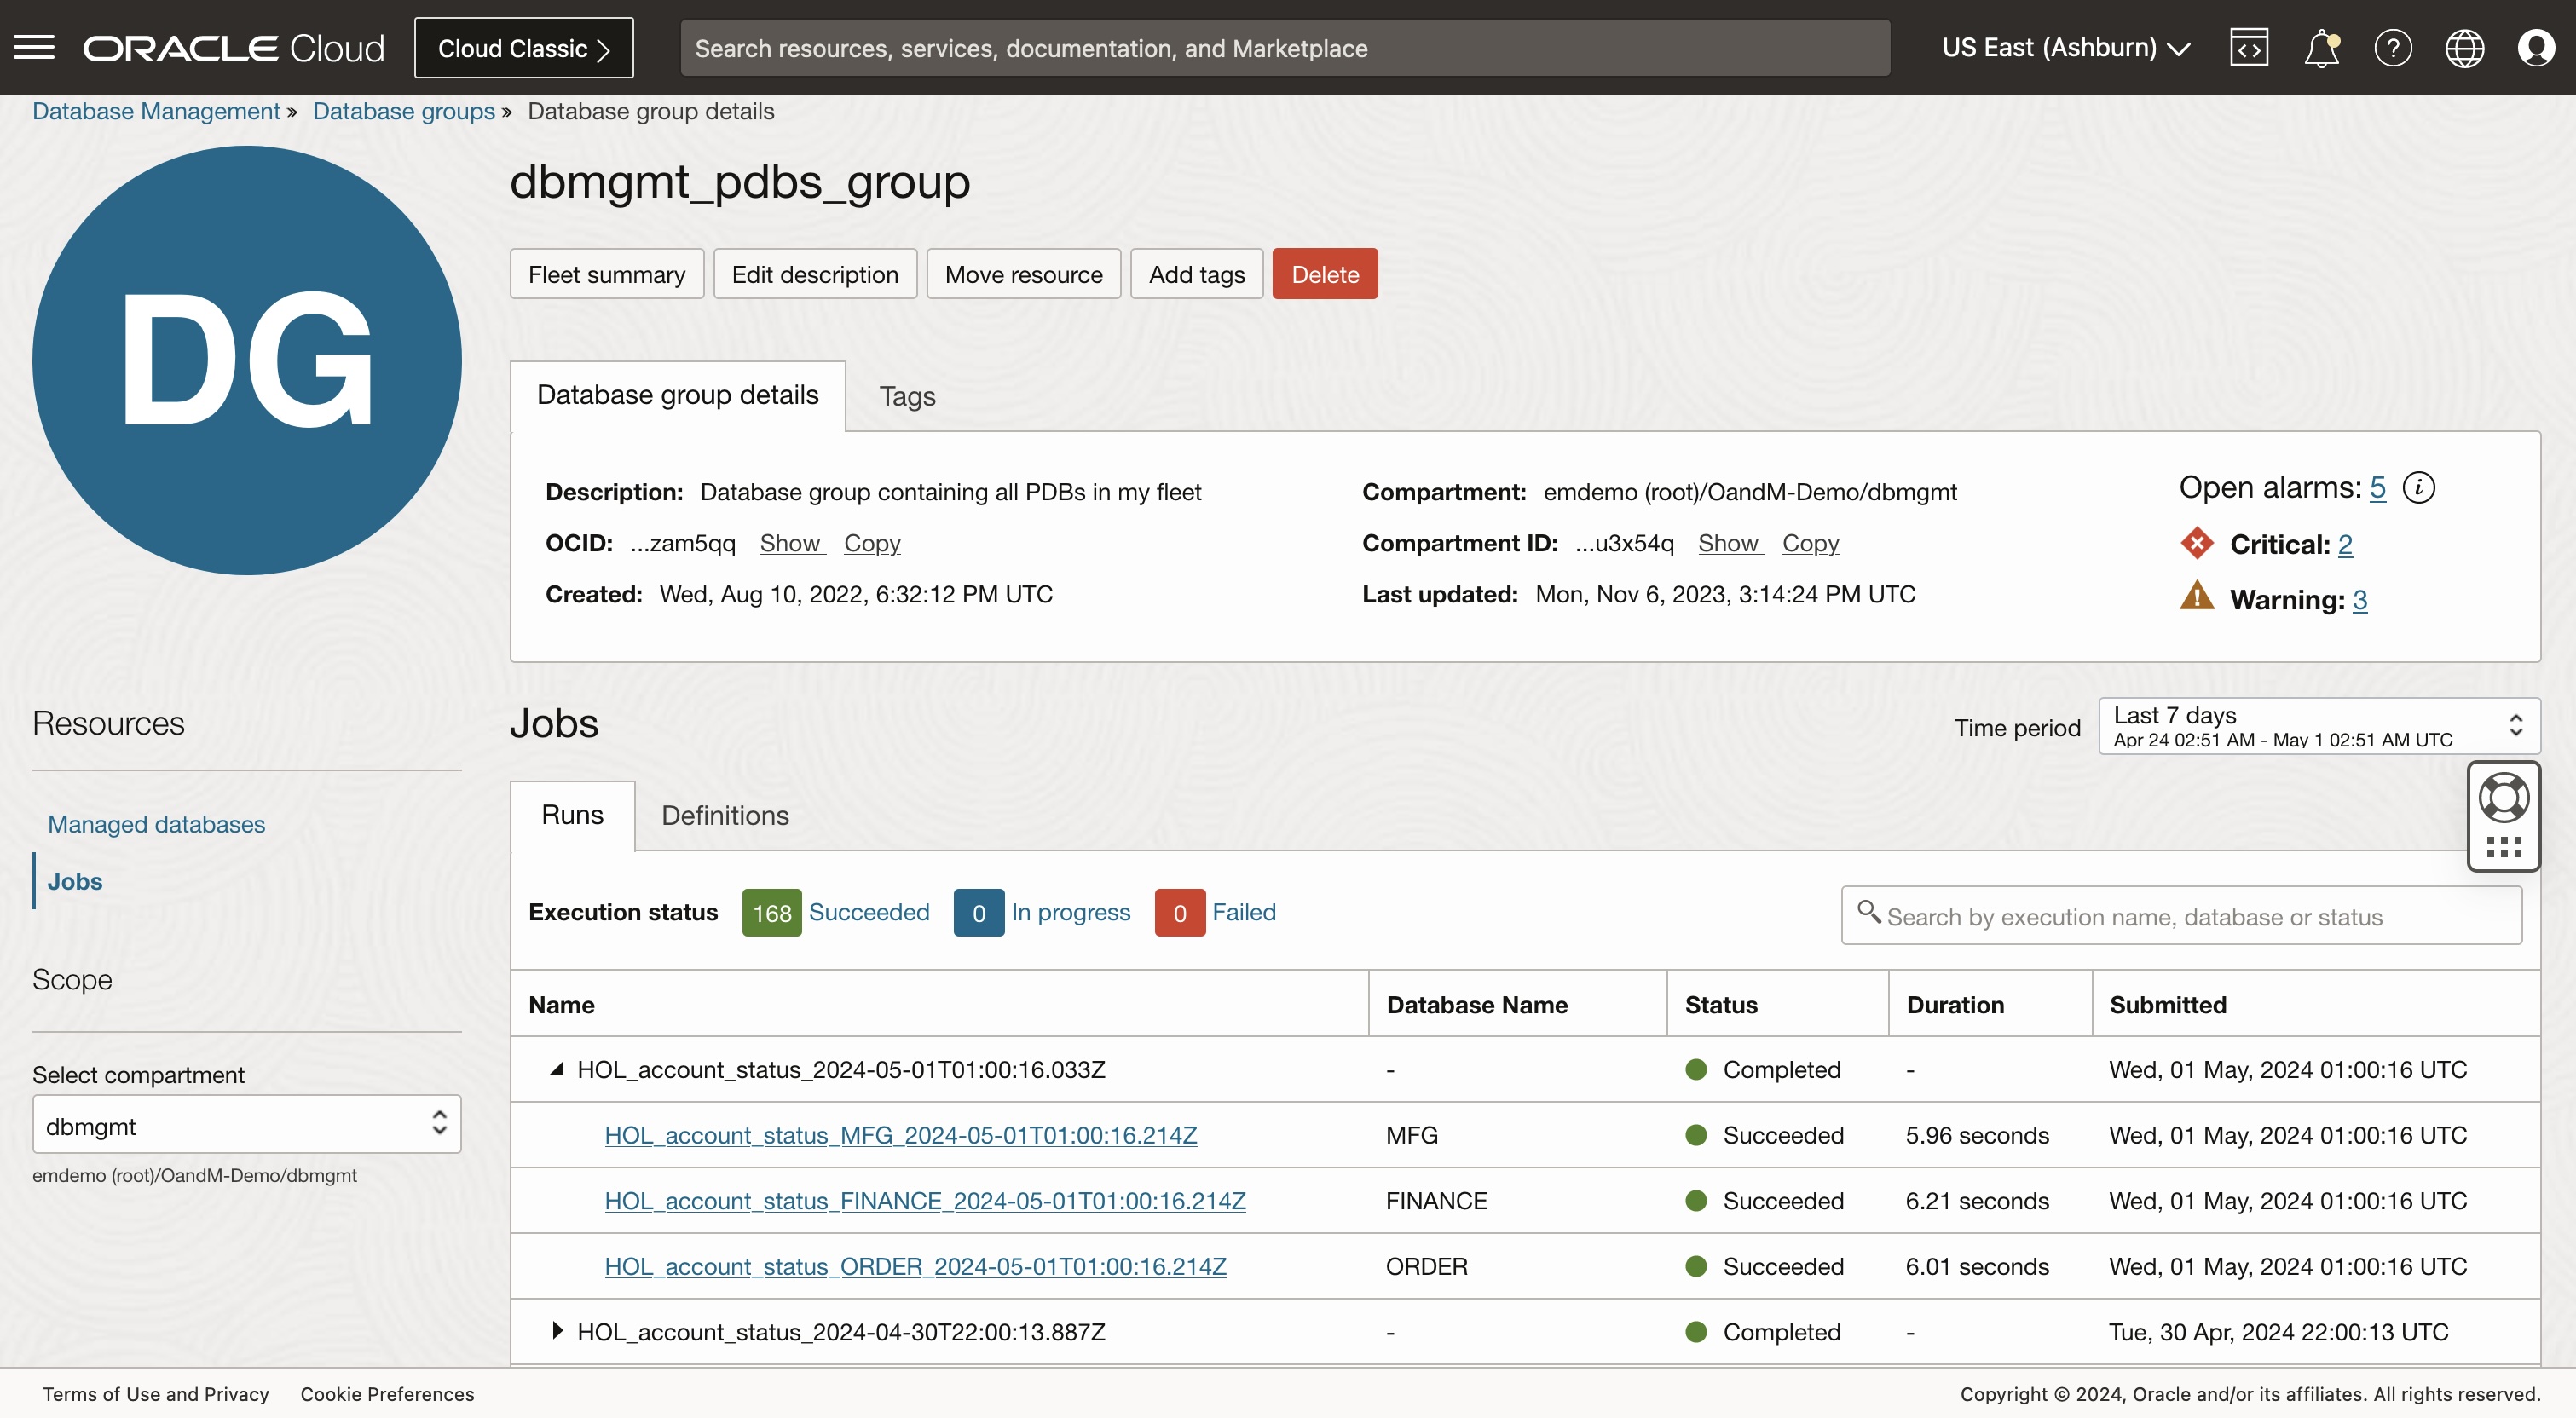
Database groups provide a means to scale administration and DevOps
Leveraging database groups in Database Management allows a DBA or developer to quickly operate against multiple database resources as a single entity. SQL can be run against a group of databases to collect information, run SQL jobs, perform administration tasks, collect environment details, or perform automated workflows at scale to minimize time and effort in ownership of your Exadata fleet.
Alarm definitions maintain monitoring consistency and ease the process of configuring monitoring
The Alarms Definition feature in Database Management enables an administrator to quickly view all associated alarms or configure alarms for a database resource. Integration with OCI Monitoring provides a streamlined means to configure out-of-the-box or custom alarms to ensure quick responses to performance degradation of database resources. The ability to apply alarms to a compartment will cover all databases running in the compartment. Also, cloning alarms from a single resource to many databases ensures consistent configurations for all databases running on your Exadata fleet.
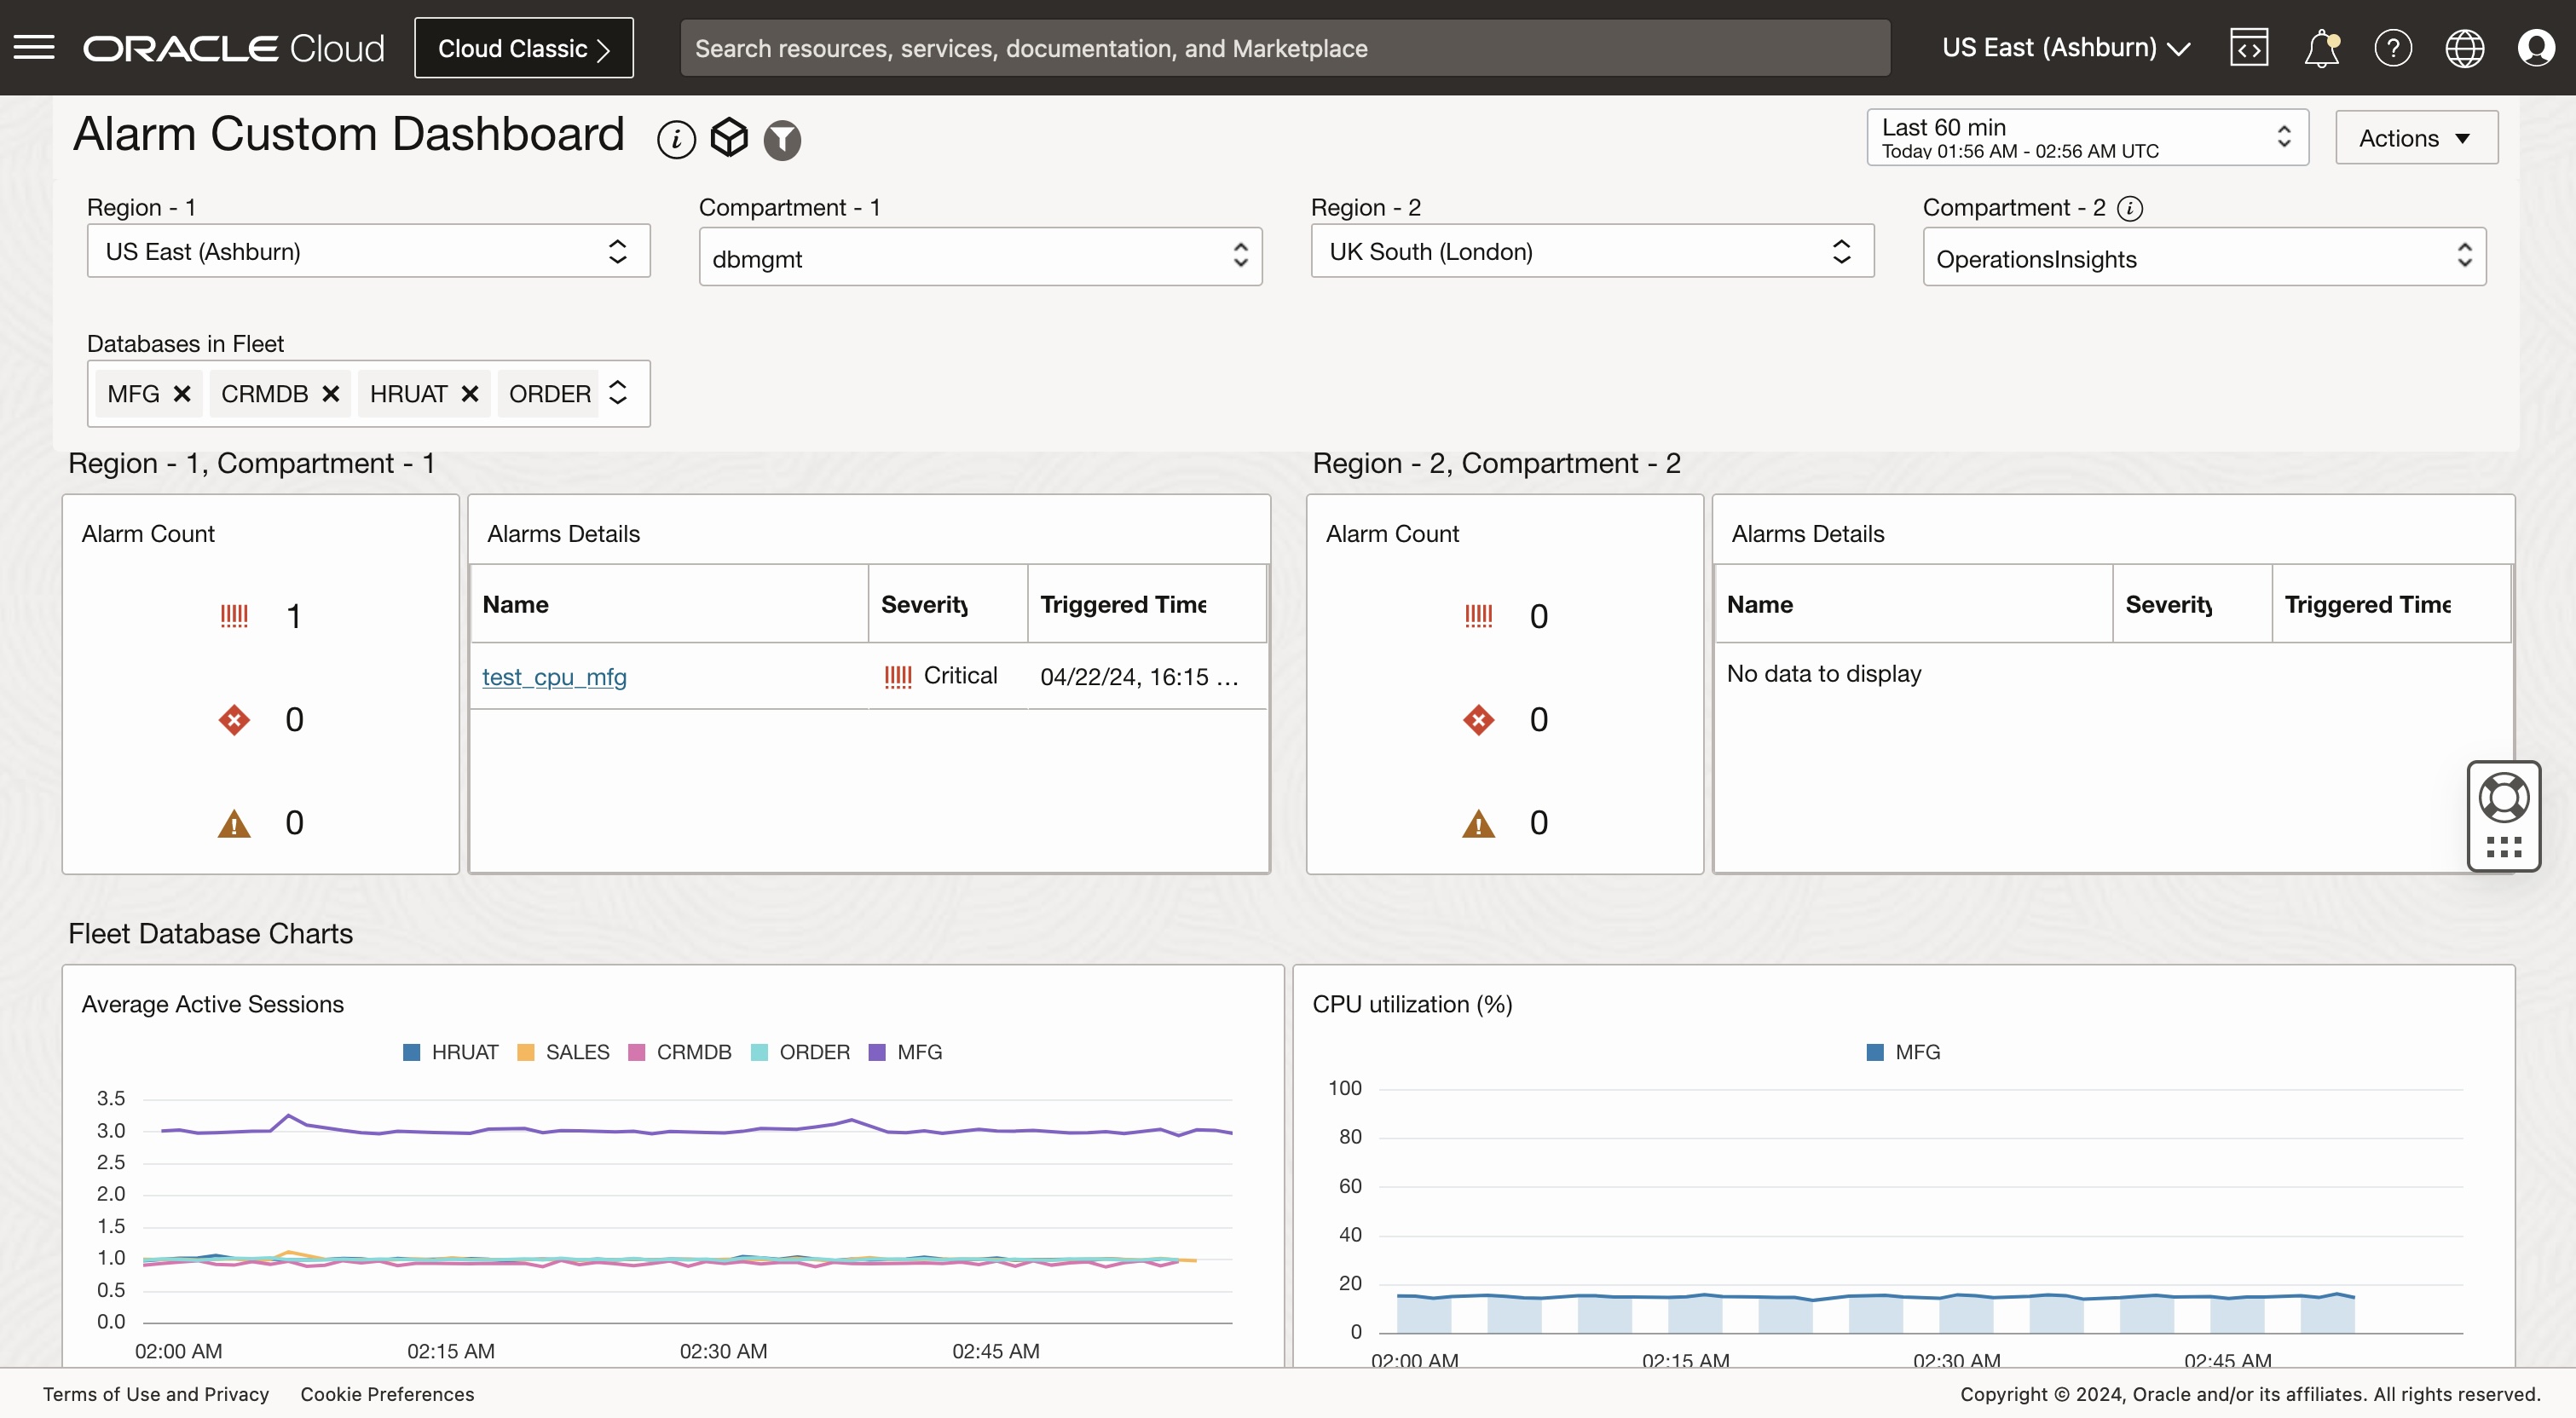
Easy-to-use dashboards reduce efforts in pinpointing performance issues
Database Management provides out-of-the-box performance dashboards to quickly assess the performance of your database. These also can be copied and edited to create custom dashboards tailored to an administrator or DevOps needs.
The Database Management service in OCI provides a top-quality monitoring and administration solution for your Exadata Cloud@Customer databases. You will be able to view the entire fleet of databases in a single console and quickly drill down to a single database resource for active monitoring and administration tasks. If you haven’t utilized the Database Management service in OCI, you can get started today!