Oracle Application Performance Monitoring (APM), an Oracle Cloud Infrastructure (OCI) native service, provides application observability through a distributed tracing service to help achieve best application experiences and improve DevOps efficiency. It also allows for proactive monitoring of any application and endpoint using our availability monitoring capabilities from any location.
What are the latest enhancements in Availability Monitoring?
This blog outlines key Availability Monitoring features released recently:
- Rebranding of Synthetics to Availability Monitoring
- New overview page
- New On-premises Vantage Points
- Support for Database SQL monitors
For a list of all features released for Application Performance Monitoring service please refer to the APM Release Notes.
Oracle Synthetic Monitoring becomes Availability Monitoring
We have rebranded Synthetic Monitoring to Availability Monitoring as it more accurately describes the functionality. This key feature area of the Application Performance Monitoring service is used to proactively monitor any resource, from a host, network device, up to full application interfaces and UI. You can determine if those resources are available, perform as expected, and set targets that can be used as Service Level Agreement parameters.
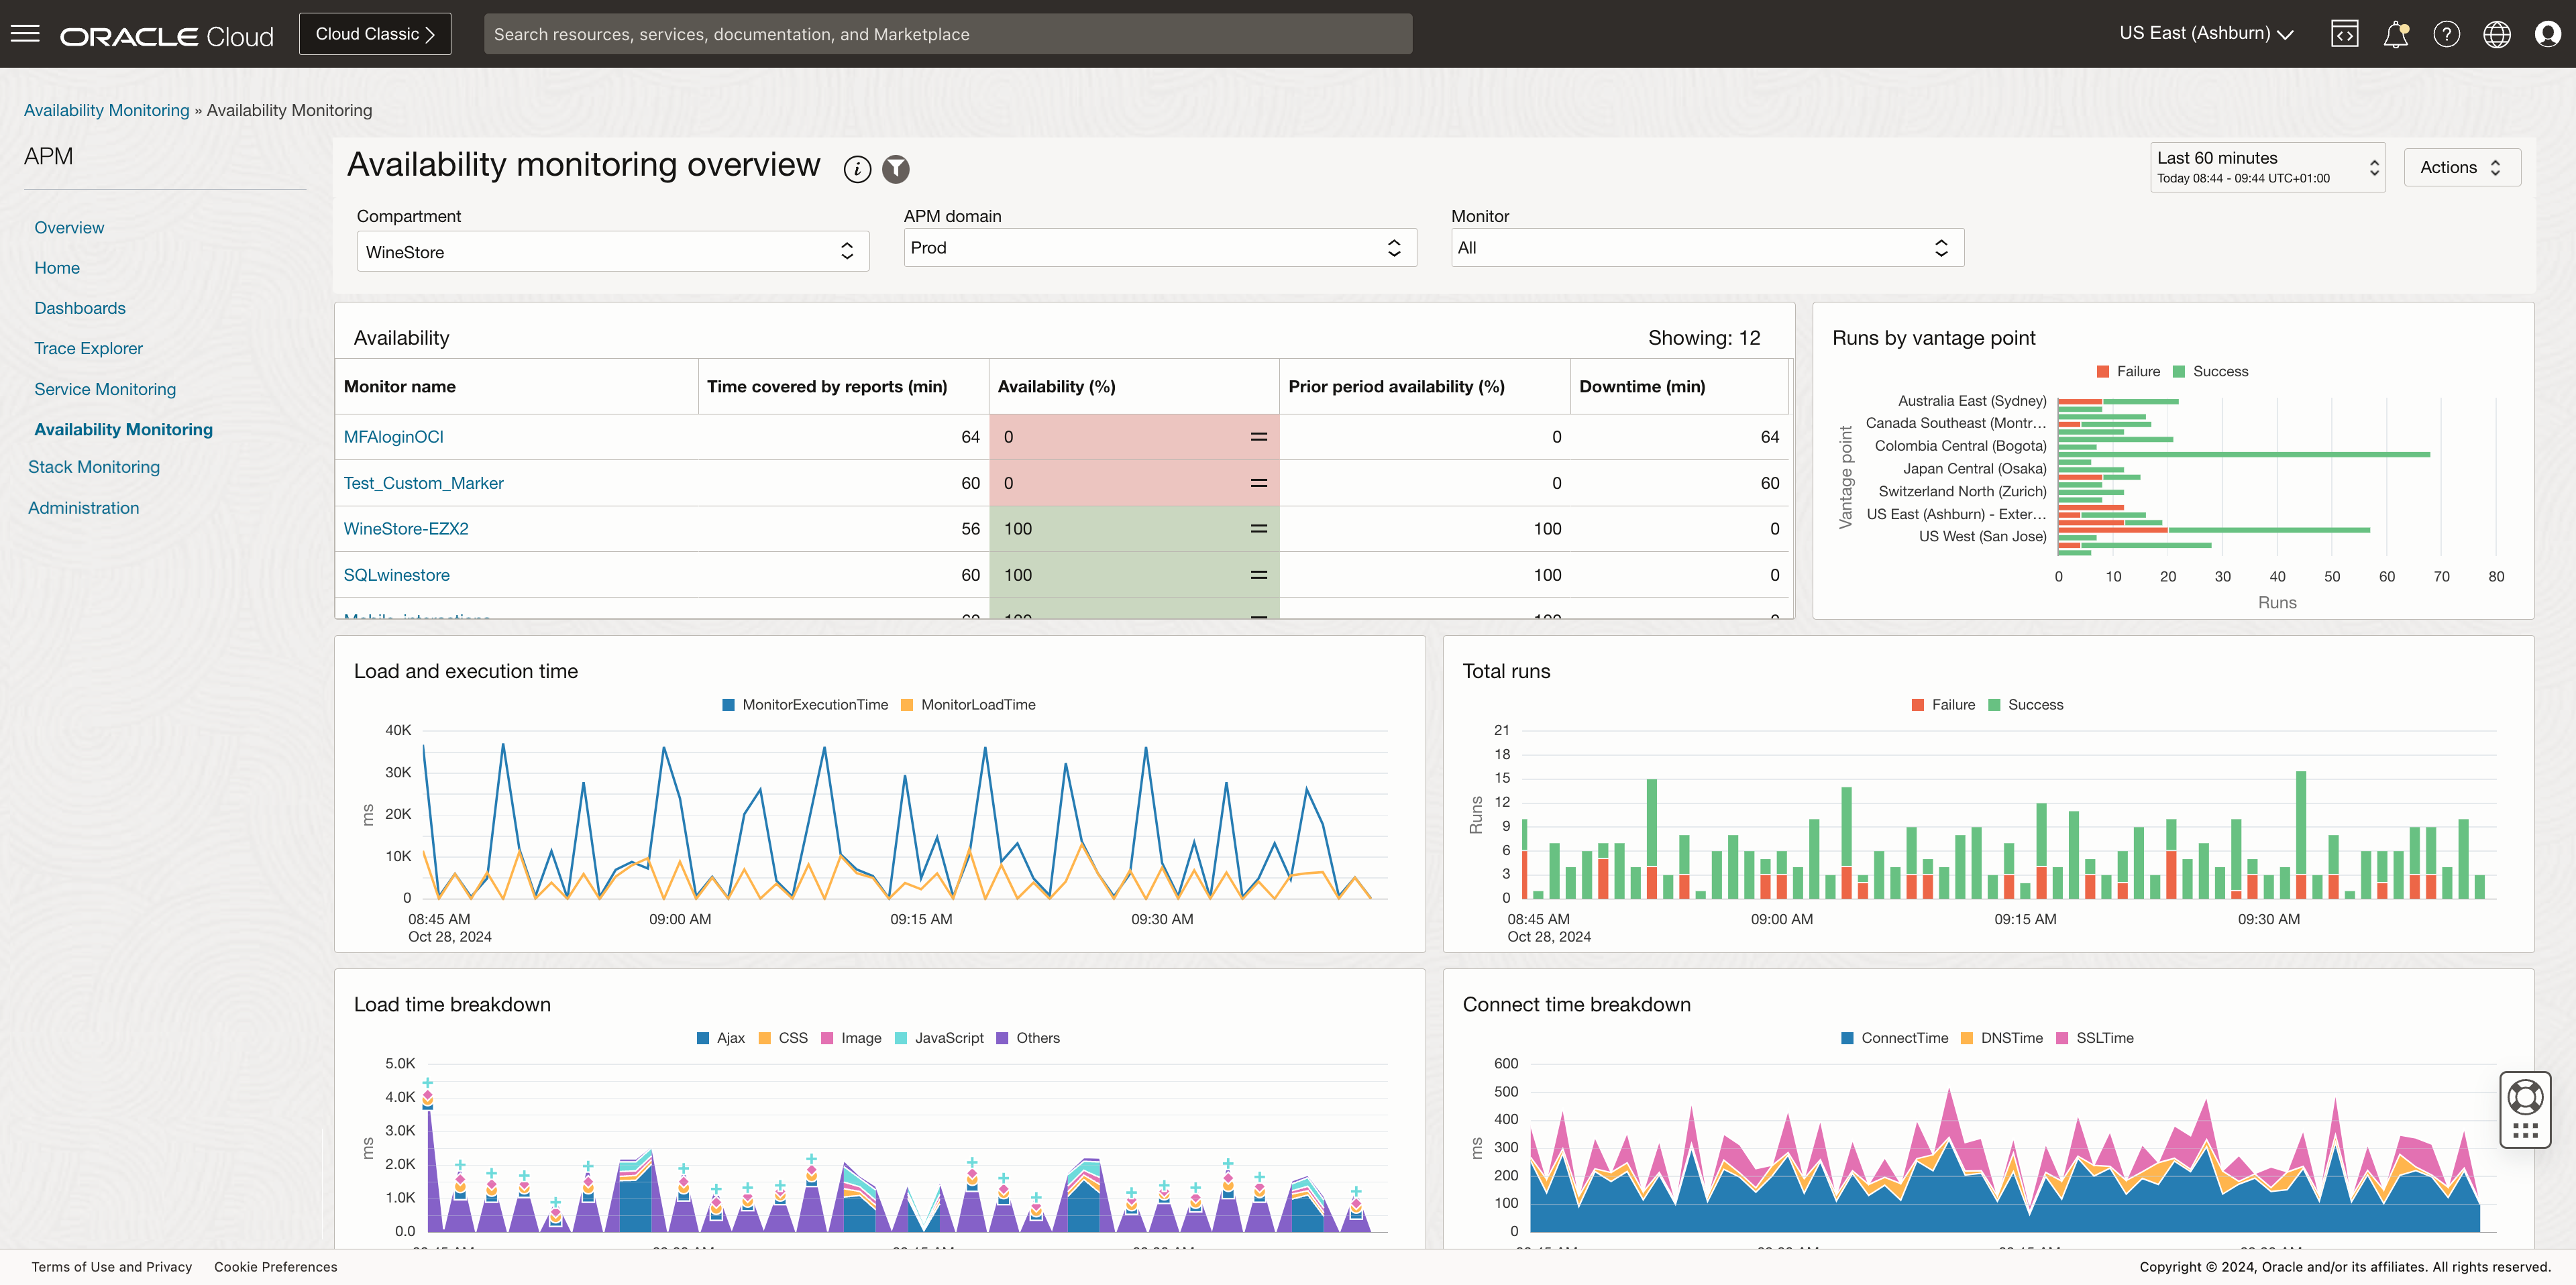
New “Availability monitoring overview” page
Many customers use Availability Monitors to determine if their applications are up and running for Service Level Agreement reporting. In such cases, it’s important that results can be quickly reviewed and navigated by users. We have introduced a new “Availability monitoring overview” page showing the results of all defined monitors right from the main APM menu, making it extremely easy to drill down to individual monitor run details. From this overview page, you can easily access all related resources like your monitor definitions, metric history, script resources and self-defined Vantage Points.
For more information, see View Monitor Availability.
OCI Application Performance Management On-premises Vantage Points
Application Performance Monitoring Service already allows users to schedule monitors to be run from our globally distributed Vantage Points, both from OCI datacenters and external datacenters.
We also introduced Dedicated Vantage Points that can easily be deployed within your OCI compartment and Virtual Cloud Network of choice so you can reach resources running within a secured environment. You can read about this in an earlier blog published on Dedicated Vantage Points.
In our current release, we went a step further to optimize your deployment choices. We released On-premises Vantage Points (OPVP). You can choose to download a fully pre-configured Vantage Point as a Docker image that can be deployed anywhere, running on your environment of choice such as Podman, Kubernetes, Ranger or Colima.
The picture below described the new deployment options and what type of Vantage Point to use in what deployment scenarios.
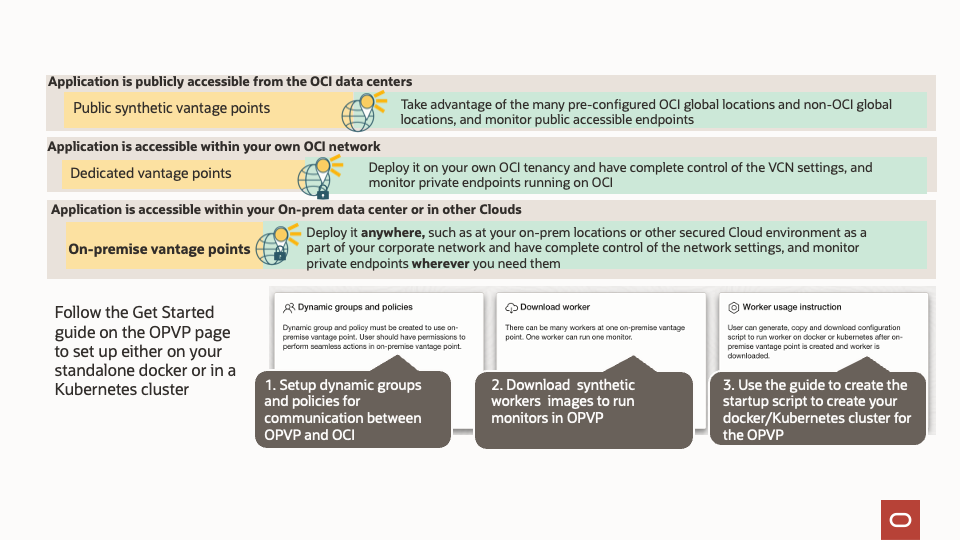
To make the deployment of an OPVP as easy as possible, we have added a guide in the UI that describes the three steps required to create an OPVP.
To ensure the OPVP is allowed to communicate with your APM tenancy, a dynamic group and policy needs to be created. The first step describes what group and policy need to be created. The group and policy can be created by you or a service admin. Simply copy the required new settings and share them with the service admin if you want them to be created for you.
Once the group and policy are created, you can create a name for your new vantage point so it’s a known resource for your APM tenancy.
The second step is to download the required Docker image that you want to install. This can be done right from the OPVP resource page.
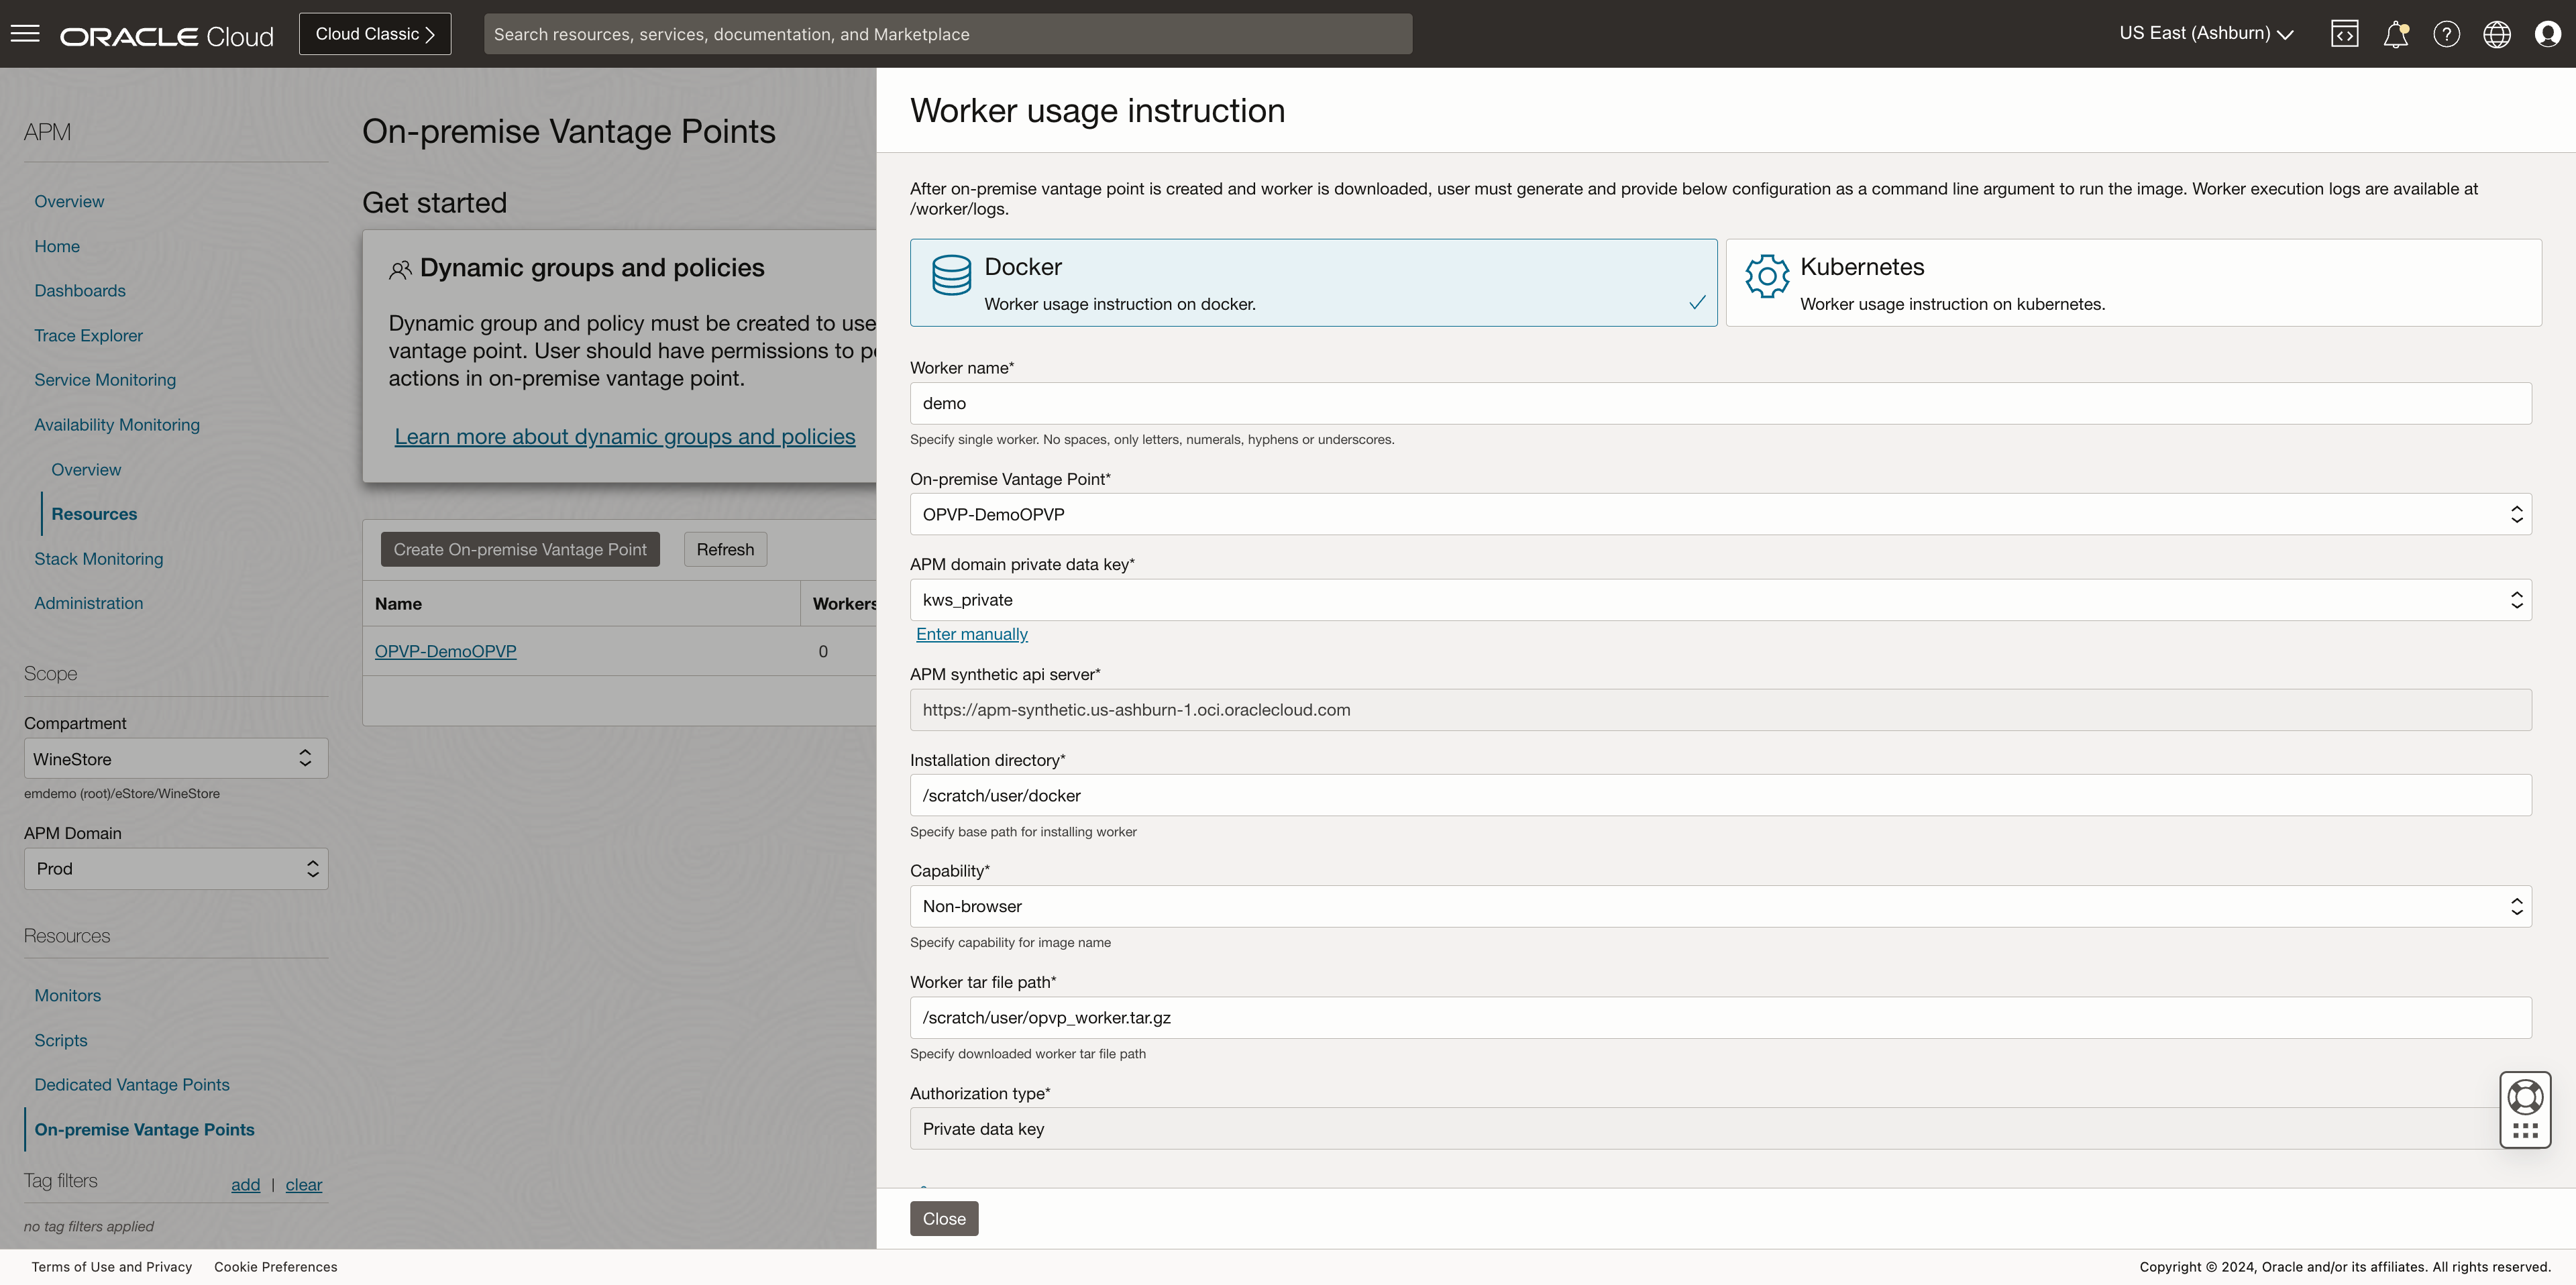
The final step is to deploy your downloaded image. The wizard can assist you with creating the correct set of commands to setup the docker image on your target environment.
You’ll be asked for a couple of inputs that are then used to create the set of commands used to deploy the docker image.
Following the UI wizard, the set of commands is generated and can simply be copied over to your environment.
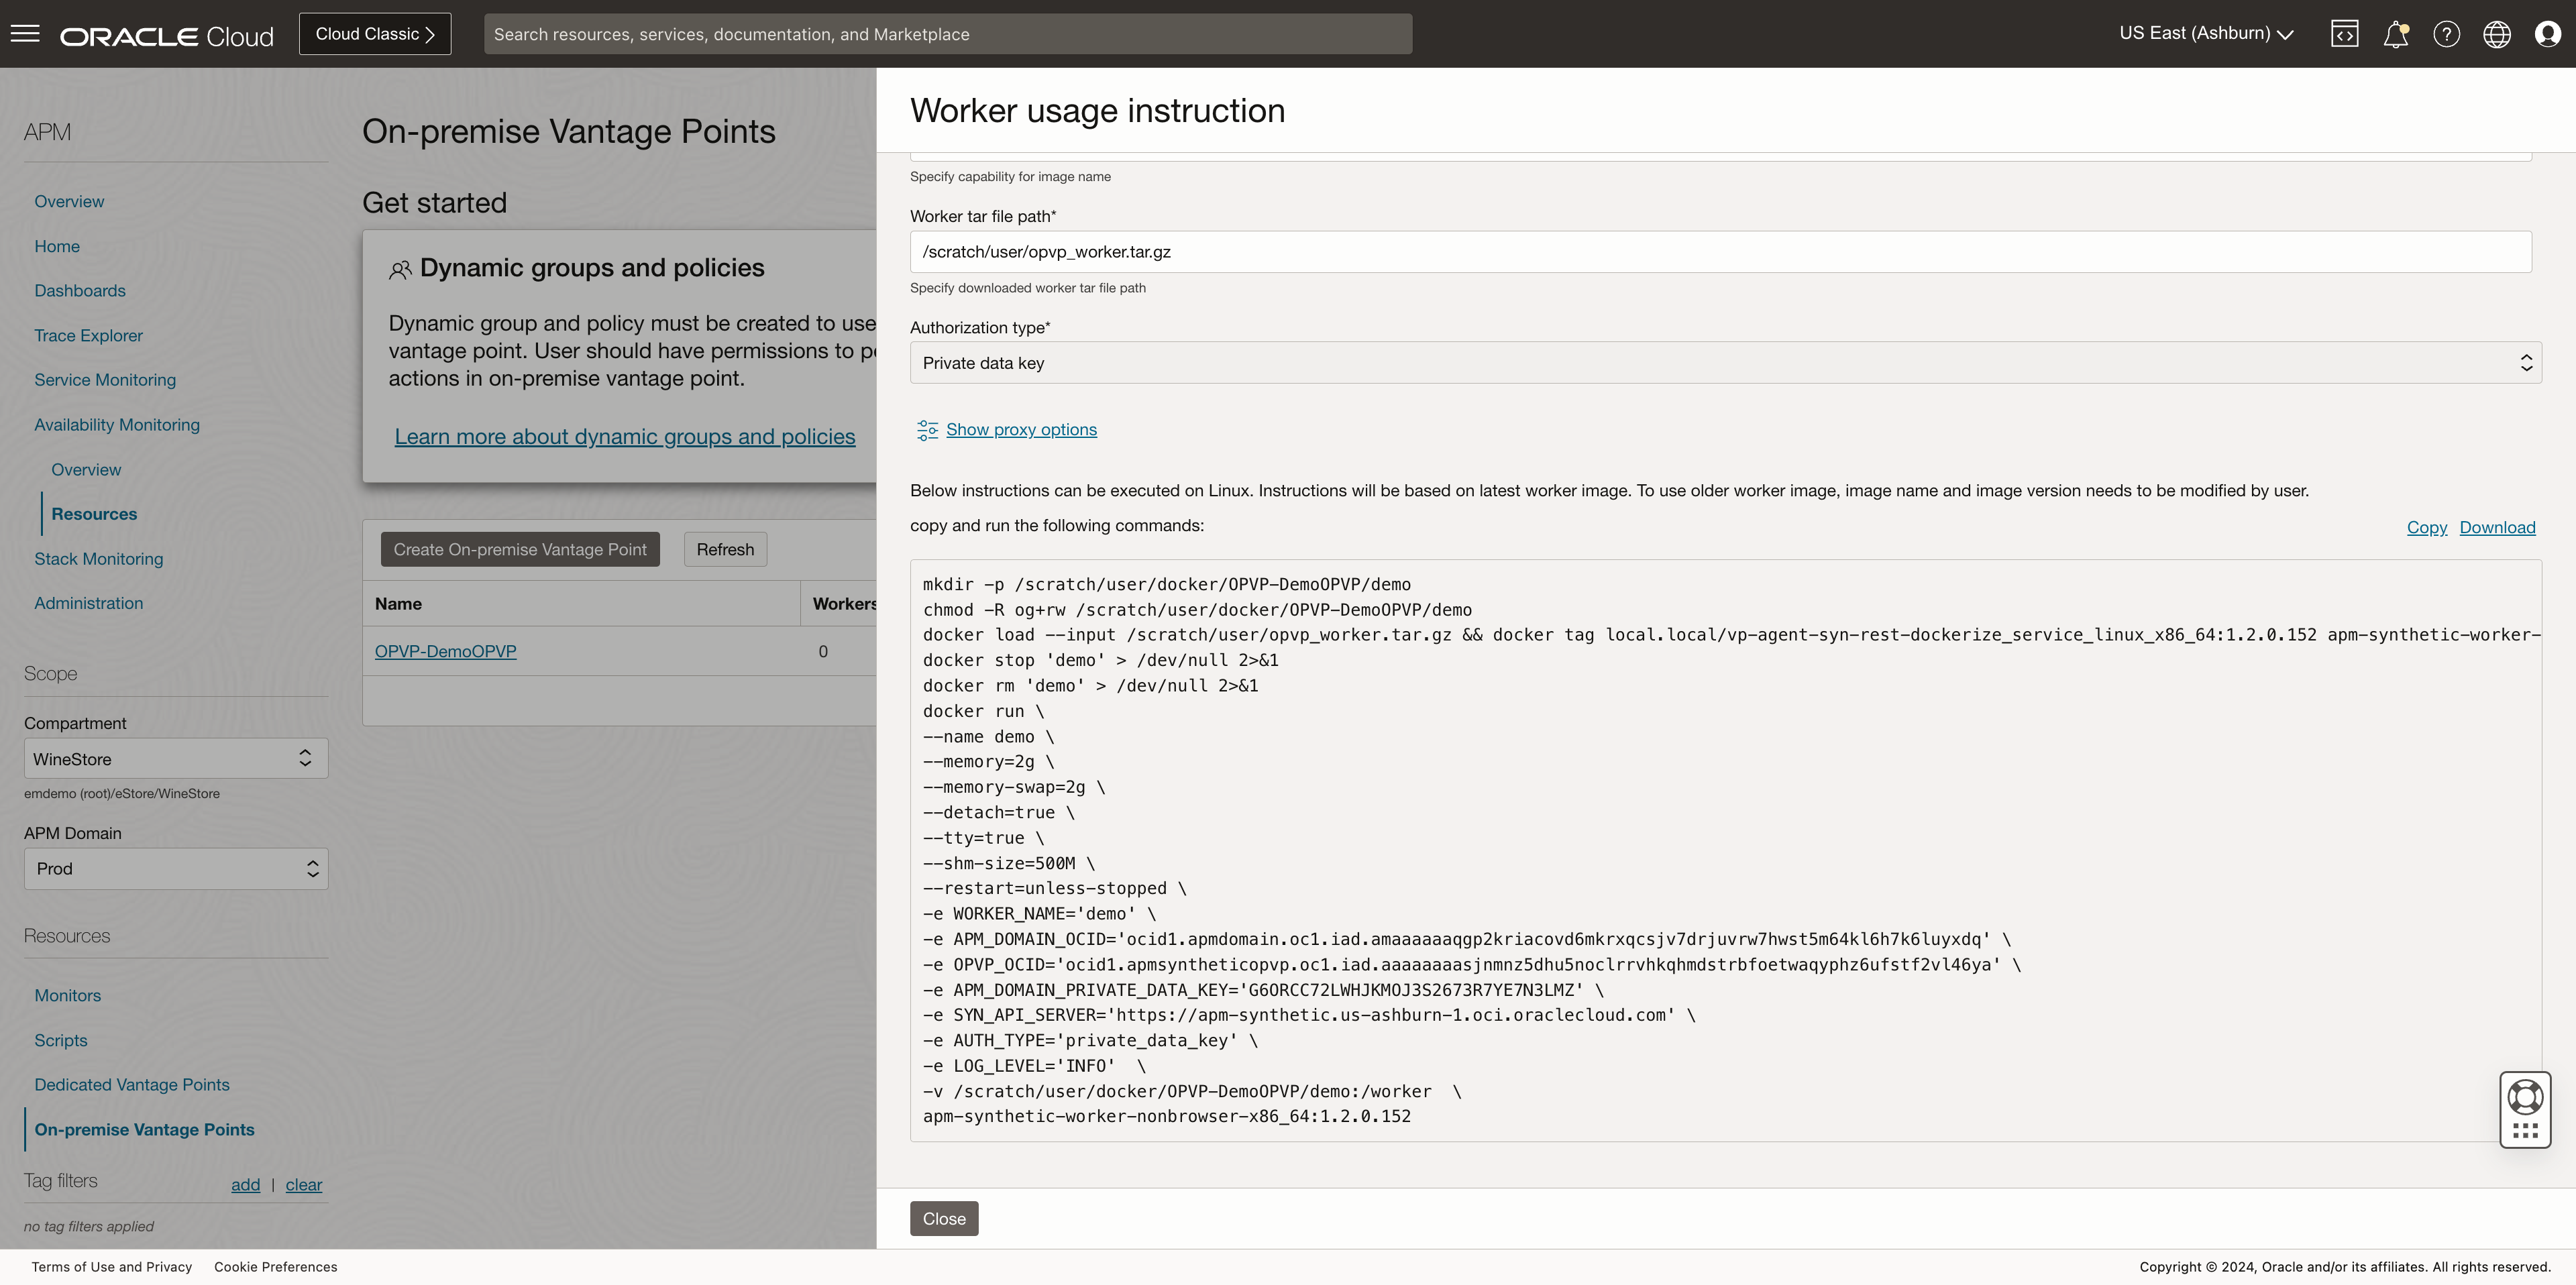
Once the setup is done, your new On-premises Vantage Point is created, can immediately communicate with your APM tenancy, and can be used to run any monitor.
For more information, see Using On-premises Vantage Points.
SQL Monitor proactively checks database performance
In today’s applications landscape, a database connected to an application might not always run alongside the application logic. You might have databases still running on-premises while the application is running on a cloud environment, or you are utilizing multiple cloud services from different vendors all connected to the same database.
For a DBA this means additional pressure to ensure that the database is always reachable and performing as expected.
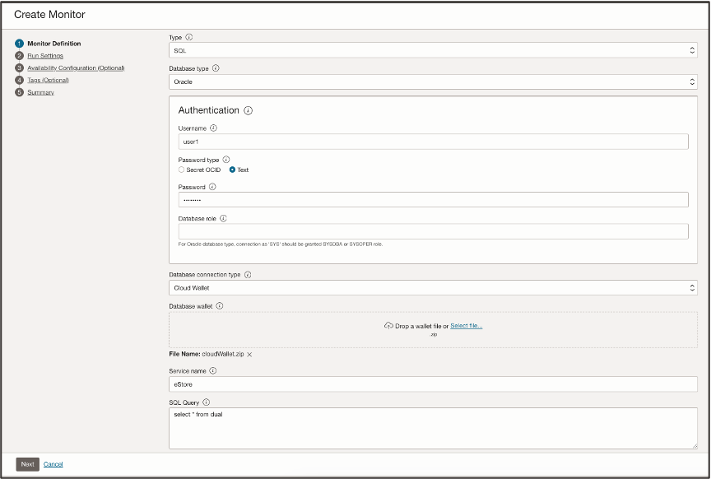
Using the Availability Monitoring features of the OCI Application Performance Monitoring service, you can now choose to run proactively scheduled monitors to check if your databases are available, check performance of connectivity, SQL execution performance, or monitor the expiration date of a cloud wallet, for example. All of this is done by choosing the new monitor type: SQL Monitor.
Setup of such monitors is very easy and supported for all flavors of Oracle Databases and MySQL Databases.
A wizard guides you through a sequence of simple steps where connection details and access parameters are defined, then you specify what actual SQL query you want to monitor.
Then, select the locations you want the monitor to be executed from. Most likely you will want to use an On-premises Vantage Point as described above for this use case, but if your database can be accessed over a public network, then any Vantage Point offered by Oracle can also be selected.
The next steps are to schedule how often you want such a monitor to check for availability, if you want to calculate an SLA based on success/failures, and you are done! The creation of a new SQL monitor can be done within a minute and allows you to set alarms on failures, such as connection time or or SQL execution taking over a certain set threshold.
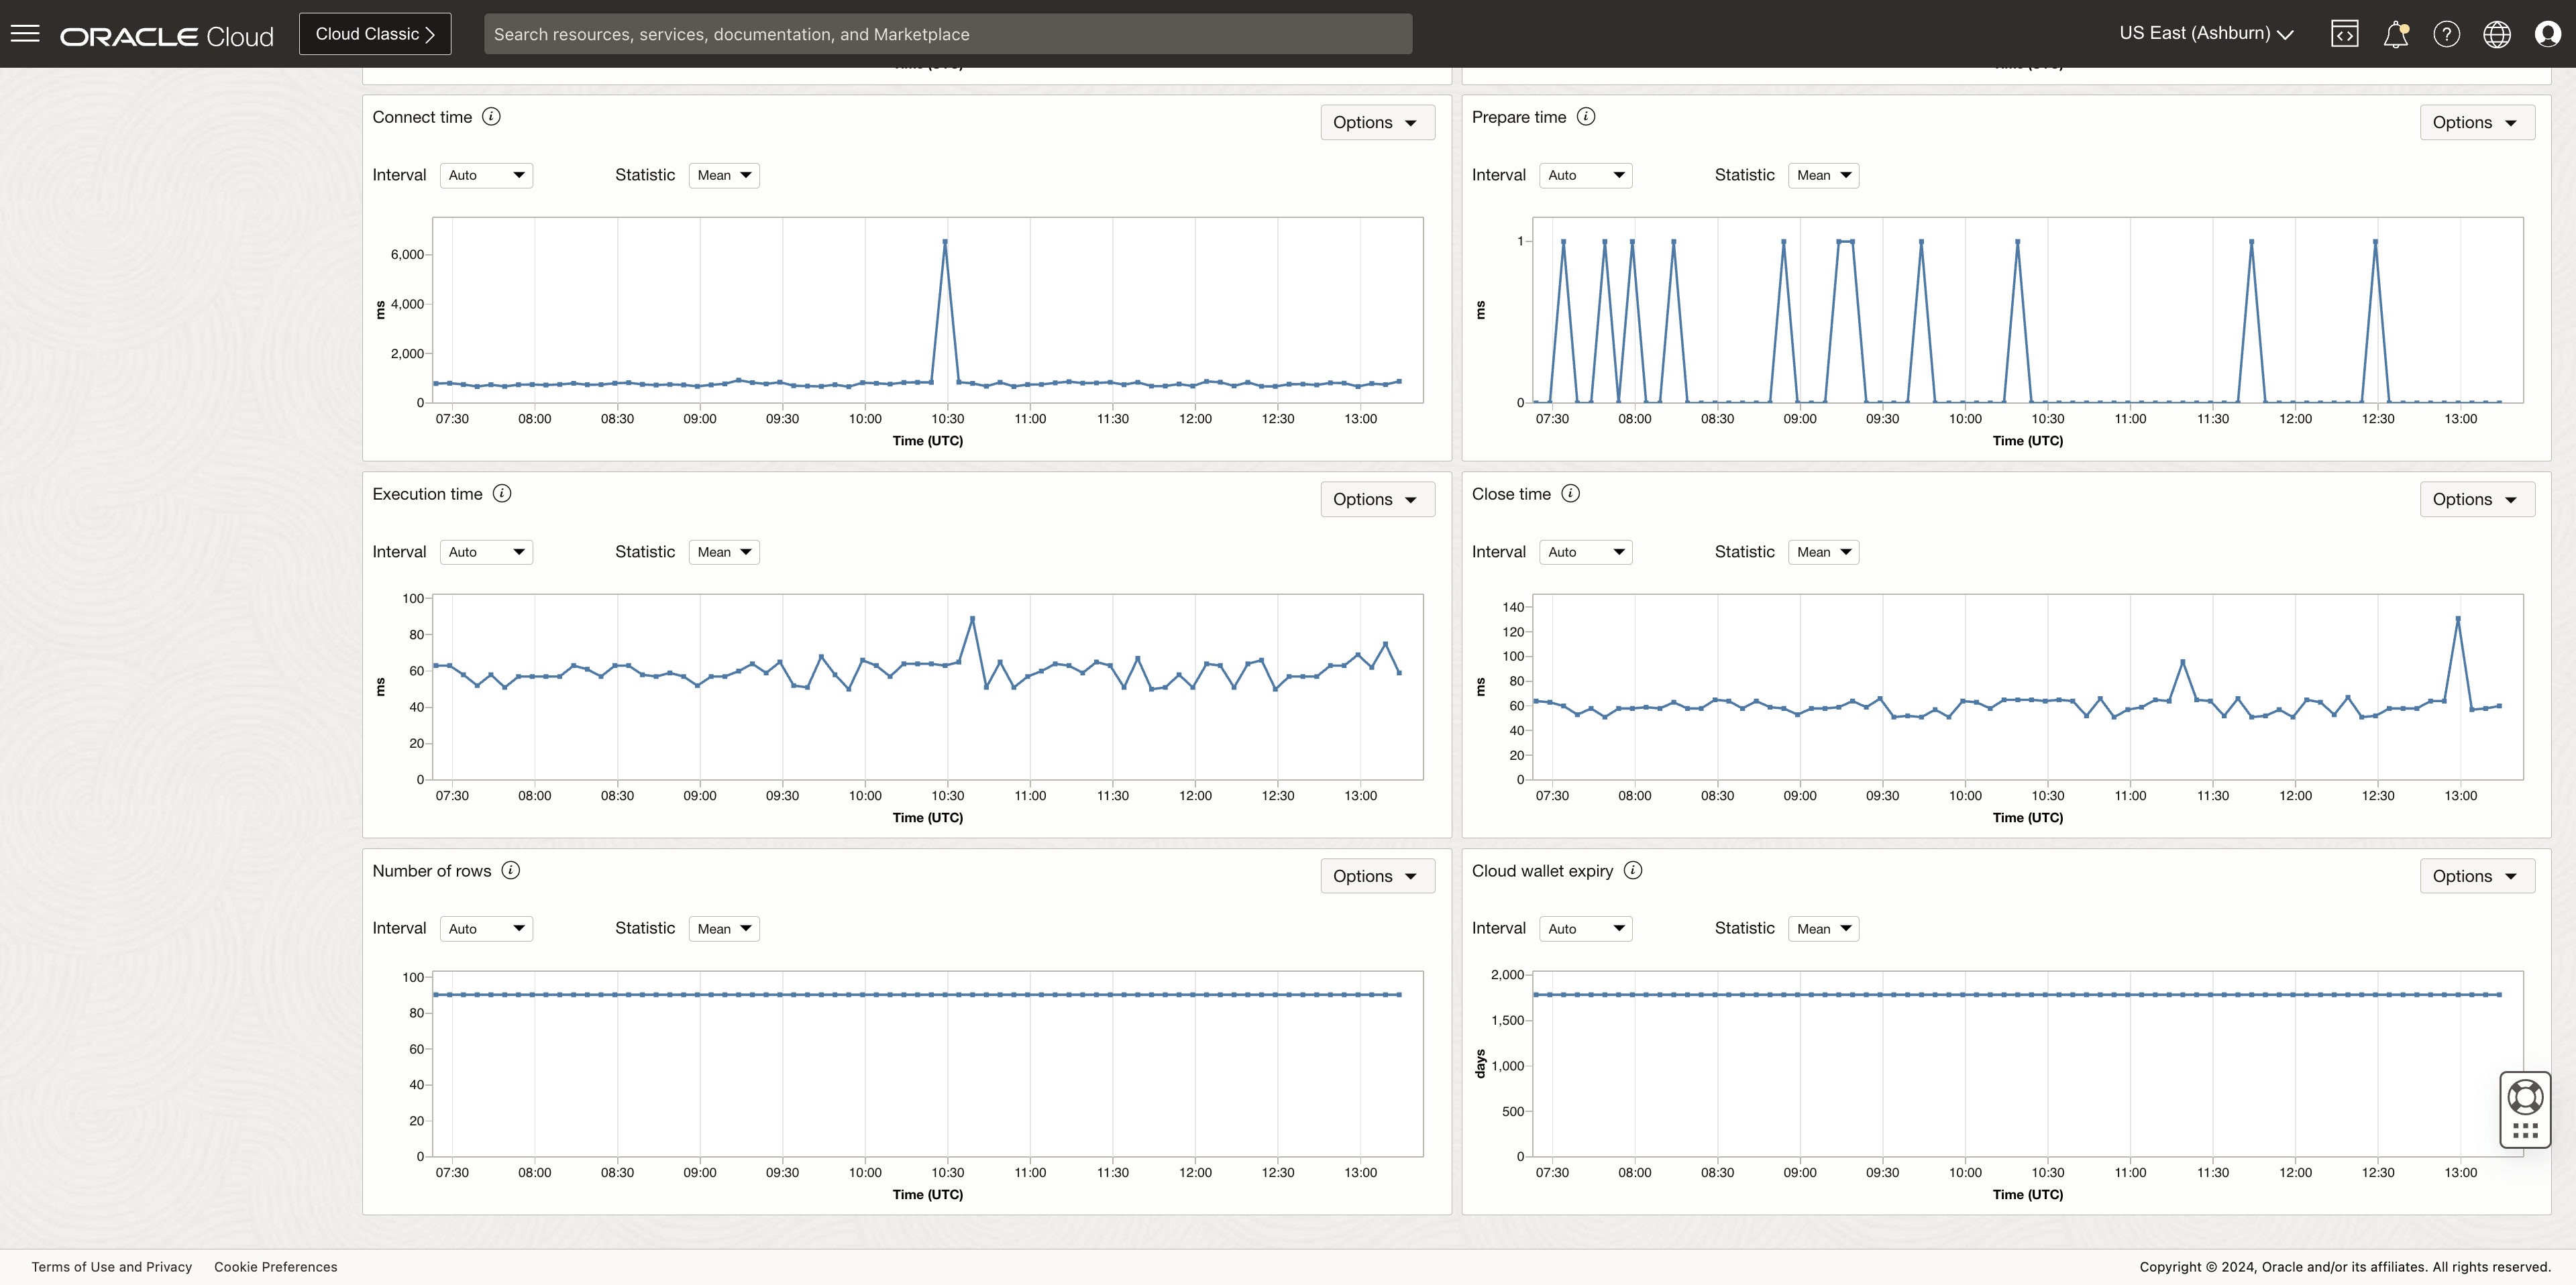
Using the SQL monitor on your environments means you’ll be aware of issues before your customers start complaining about application delays and/or failures, in on-premises, cloud, or even multi-cloud deployments.
Watch this video for a demo on this functionality. For more information on Availability Monitoring features, see Use Availability Monitoring.
Resources
To learn a lot more about Application Performance Monitoring visit: