Share Insight In New Ways Using Grafana and EM
Team members in DevOps, Development, and Application owners roles are often interested in the rich data collected by EM, but don’t have access to EM directly or are not interested in using EM’s full functionality. Using the EM App for Grafana, EM customers can display data from their managed targets into another tool already in use, like Grafana. Enabling this capability also helps organizations reduce collection overhead and finger-pointing. The app is available to EM customers at no additional cost. Check that you have the applicable EM Management Packs licensed that provide the data before using.
Once the EM App has been enabled in your Grafana environment and connected to an EM instance, you can create custom EM-based Grafana dashboards. You can do that by browsing and selecting the EM metrics of interest, or by creating direct SQL queries against the well-established EM Repository’s SDK (MGMT$) Management Views or other target databases.
Key Updates in the EM App for Grafana v3.0.0
This update introduces new features designed to enhance the value and overall customer experience for customers using Oracle Enterprise Manager. Here are two of them:
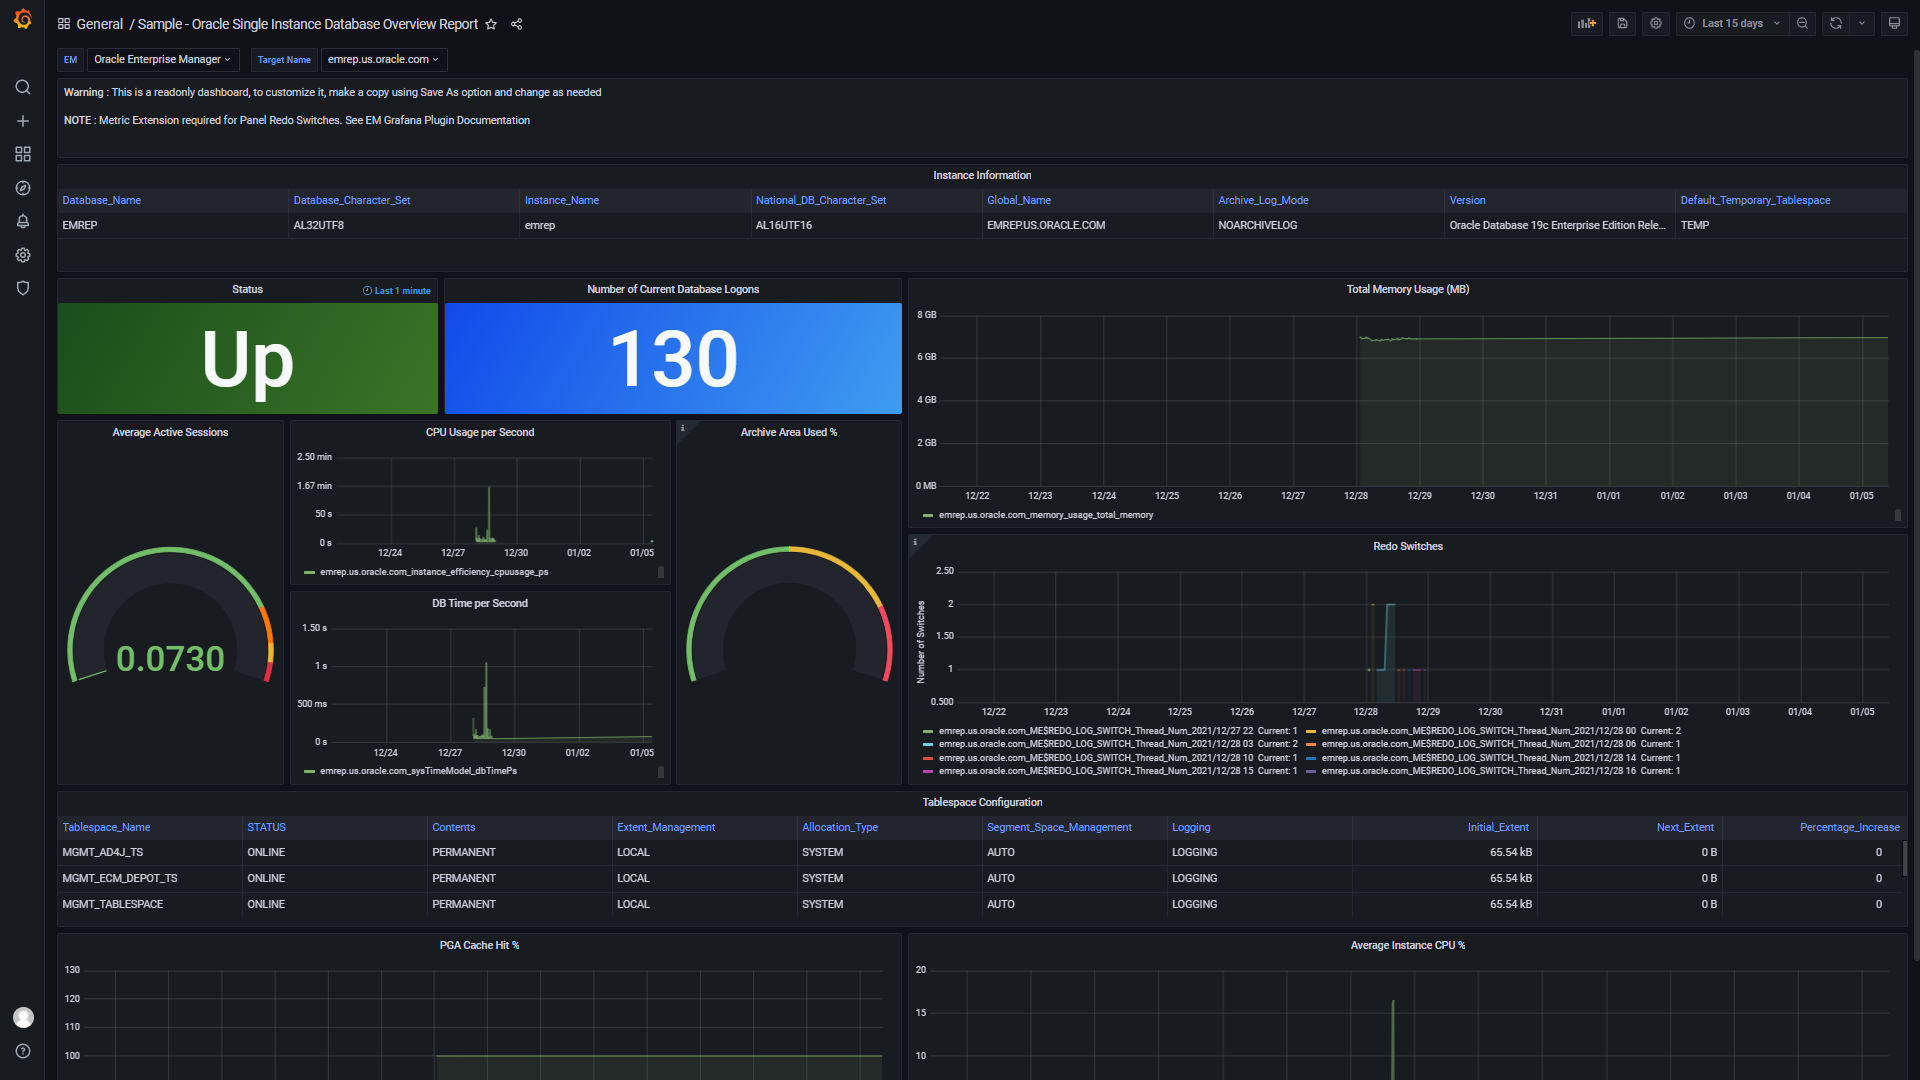
Oracle Single Instance Database Dashboard: Sample – Overview Report
The metric list for the Oracle Single Instance Database Dashboard includes:
Instance Information: For the database instance selected, this panel enables a user to quickly view a summary of key database details. This can be useful when checking the health of a database or configuration detail for planning. It is built on a custom query to get details from the EM repository database:
SQL Query:
select o.database_name "Database_Name",
                 o.characterset "Database_Character_Set",
                 o.instance_name "Instance_Name",
                 o.national_characterset "National_DB_Character_Set",
                 o.global_name "Global_Name",
                 o.log_mode "Archive_Log_Mode",
                 o.banner "Version",
                 o.default_temp_tablespace "Default_Temporary_Tablespace"
           from sysman.mgmt$db_dbninstanceinfo o
          where o.target_guid = (select target_guid from sysman.mgmt$target where target_name= $oem_gf_target_name )
NOTE: Variable $oem_gf_target_name is a feature of the EM Grafana App Plugin. See the EM App for Grafana Documentation for details and usage.
Status Information (Database Status in the Enterprise Manager console): This panel provides a quick snapshot of the status of a database. Being able to quickly view if a database is up or down can help inform users and determine what decision or action needs to be performed next. It is built on a custom query to get details from the EM repository database:
SQL Query:
select sysdate as time_sec, c.availability_status_code AS Status, c.availability_status as metric
 FROM sysman.mgmt$availability_current c
 WHERE c.target_name = $oem_gf_target_name
 AND c.target_type = $oem_gf_target_type;
NOTE: Variables $oem_gf_target_type and $oem_gf_target_name is a feature of the EM Grafana App Plugin. See the EM App for Grafana Documentation for details and usage.
Number of Current Database Logons: This panel shows the current number of database logins and is available out-of-the-box in the EM console for database targets. This metric can help a user when performance issues are encountered or explore if the database is configured for the load that it is processing.
Total Memory Usage: This panel shows the current memory usage of the given instance and is an out-of-the-box target collected in the EM console for database targets. This metric helps to monitor performance and load for the database.
REDO Switches: This panel shows the number of REDO Switches for the given instance based on the metric collection period as defined and built in the Custom Metric Extension ($ME) in the EM console. A high rate of REDO Switches can lead to database performance issues. Being able to quickly view the number of REDO Switches helps users decide on what to do next.
SQL Query:
select *
 From (SELECT to_char(first_time,'YYYY/MM/DD HH24') day_hour, count(*) "#"
 from v$log_history
 GROUP by to_char(first_time,'YYYY/MM/DD HH24')
 order by 1 DESC)
 where rownum=1;
Average Active Sessions: This panel displays the average active sessions on the given database and how busy a database is at the current time. It is a key metric for helping users understand performance and load and is an out-of-the-box metric collected in the EM console for database targets.
CPU Usage per Second: This panel shows the CPU usage per second as an out-of-the-box metric that is collected in the EM console for database targets. This metric represents the CPU usage per second by the database processes, measured in hundredths of a second. A change in the metric value can indicate a change in the workload mix or workload throughput performed by the database.
DB Time per Second: This panel shows DB time per second, which is an out-of-the-box metric collected for database targets in the EM console. DB time is the total time spent by user processes actively working or actively waiting in a database call and is a fundamental gauge for database performance. Having a quick snapshot helps users better understand and remedy performance issues.
Archive Area Used %: This panel shows how much archive area has been used and is built using an out-of-the-box metric. When a database is in ARCHIVELOG mode and recovery of a database is required, the archive log location must not be full. A database must be in ARCHIVELOG mode to make use of the panel. For Real Application Cluster (RAC) databases the metric must be enabled from EM.
Tablespace Configuration: This panel shows the basic tablespace configuration information for tables in the given database. Database data is stored in tablespaces, which are a unit of database storage. Users can use the tablespace configuration information to verify the status and standard tablespace configuration. This panel was built using a custom SQL to gather information already collected in the EM Repository.
SQL Query:
select o.tablespace_name as "Tablespace_Name",
 o.status as Status,
 o.contents as "Contents",
 o.extent_management as "Extent_Management",
 o.allocation_type as "Allocation_Type",
 o.segment_space_management as "Segment_Space_Management",
 o.logging as "Logging",
 (NVL(o.initial_ext_size,0)) as "Initial_Extent",
 (NVL(o.next_extent,0)) as "Next_Extent",
 (NVL(o.increment_by,0)) as PERCENTAGE_INCREASE,
 DECODE(o.max_extents,null,'UNLIMITED',TO_CHAR(max_extents)) as MAX_EXTENT,
 o.min_extents as MIN_EXTENT,
 (NVL(o.min_extlen,0)) as MIN_EXTEND_LENGTH,
 o.block_size as BLOCK_SIZE,
 TO_CHAR(NVL(o.bigfile,'NA')) as BIGFILE
 from sysman.mgmt$db_tablespaces o
 where o.target_name =  $oem_gf_target_name
 and o.target_type = $oem_gf_target_type
 order by tablespace_name asc;
NOTE: Variables $oem_gf_target_type and $oem_gf_target_name is a feature of the EM Grafana App Plugin. See the EM App for Grafana Documentation for details and usage.
PGA Cache Hit %: This panel shows the PGA Cache Hit% which is a metric collected in the EM console for database targets. The metric is the total number of bytes processed in the Program Global Area (PGA) versus the total number of bytes processed plus extra bytes read/written in extra passes. It helps an administrator monitor proper sizing on the database for better performance and tuning.
Average Instance CPU%: This panel shows the Average Instance CPU % and allows an administrator to see how much host CPU is being used by the given database instance. This panel is built from an out-of-the-box metric that is collected in the Enterprise Manager console for database targets.
USE CASE: PERFORMANCE TRIAGE
“Fred receives several phone calls from users stating that the production database ORCL is slow in responding. The users can run SQL queries but the return is much too slow for the query type. Fred has several options to review this issue. He can run an AWR report to review the stats and workload, he can log in to EM and review the Performance hub for this database, and he can review quickly the Grafana Dashboard for Oracle Single Database Overview Report. All are good options to review the issue noted by the users. Our out-of-the-box Database Dashboard allows for a quick way to get an overall view to review this database performance issue. In the dashboard, he can see if the instance is using too much CPU or memory. The dashboard can be quickly used to determine how many users are currently logged into the production database and what the workload may be. He can also see if there are too many redo switches causing the performance issue. The dashboard can allow Fred to determine the next steps quickly in how to diagnose and resolve the slow performance in a one-page view.”
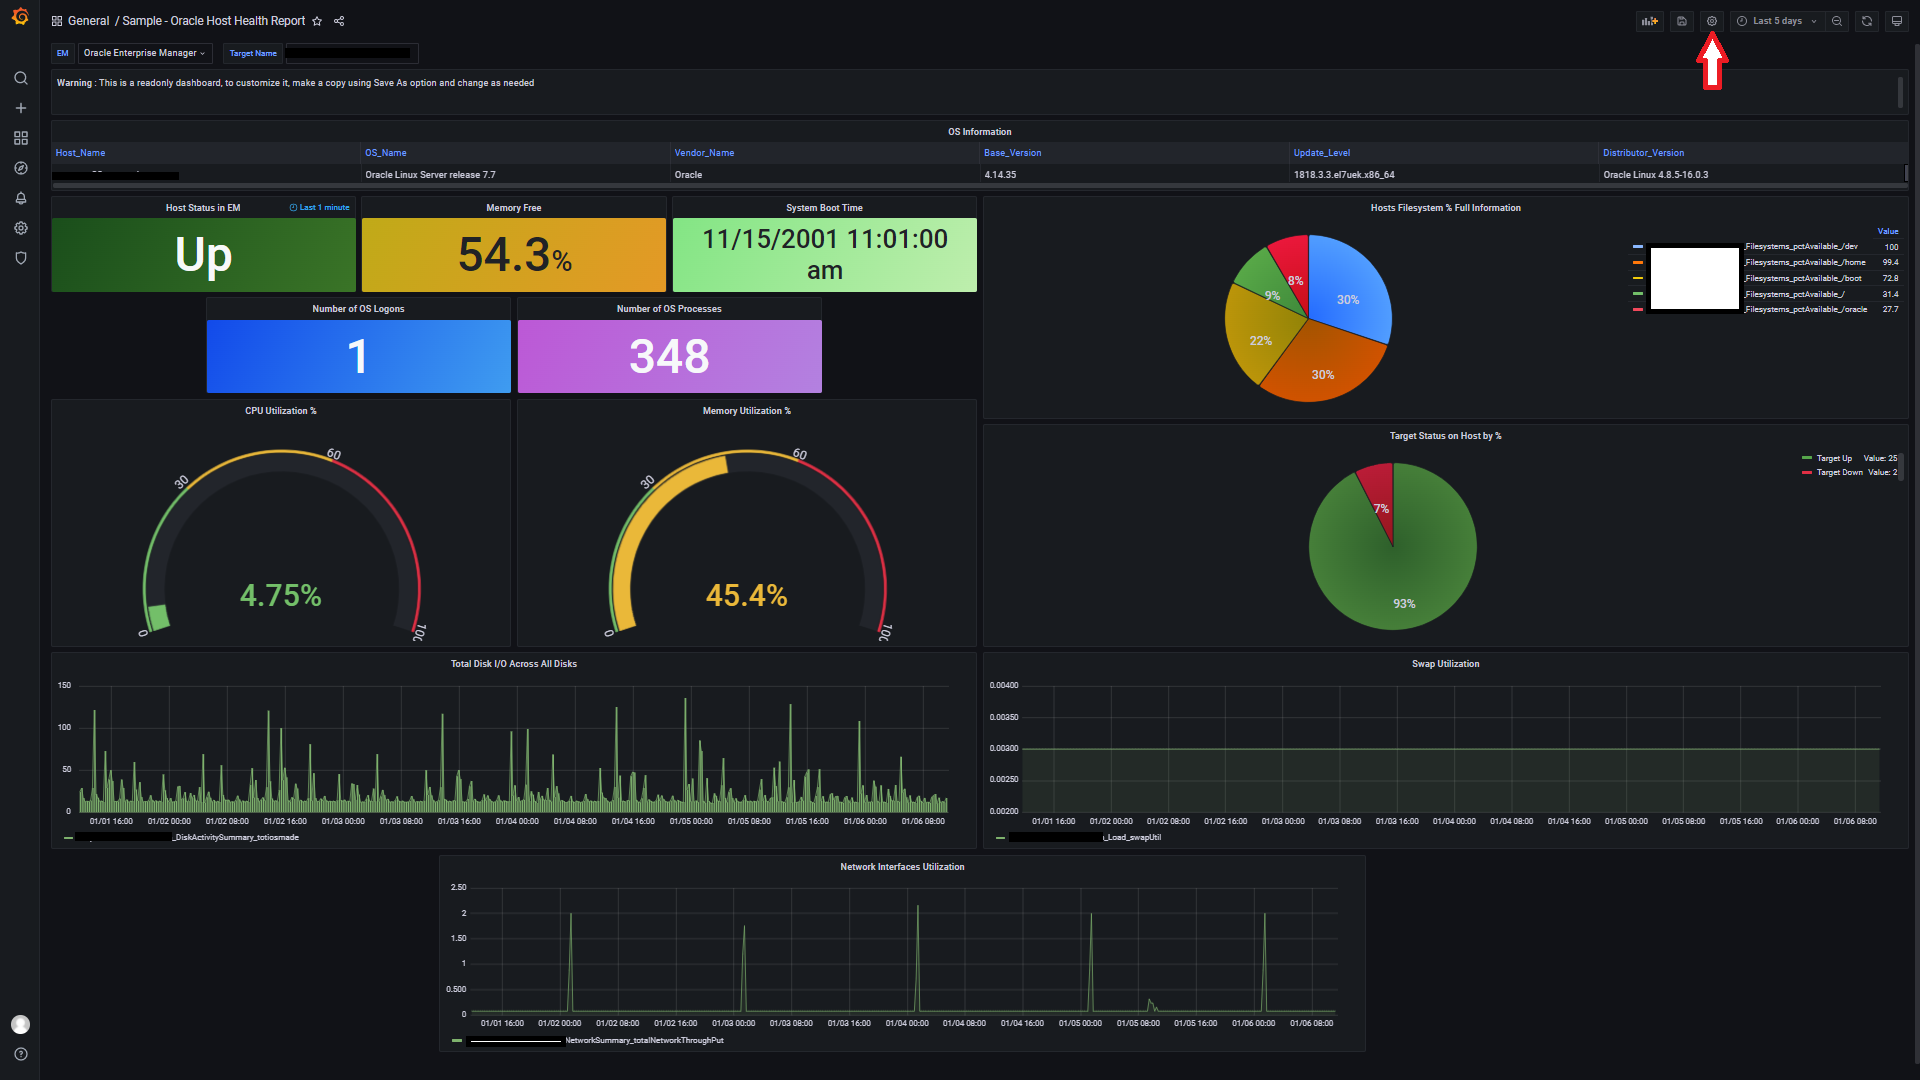
Oracle Host Health report dashboard: Sample – Oracle Host Health Report
This out-of-the-box dashboard gives a snapshot view of the overall health of a host target that is discovered within the EM Console.
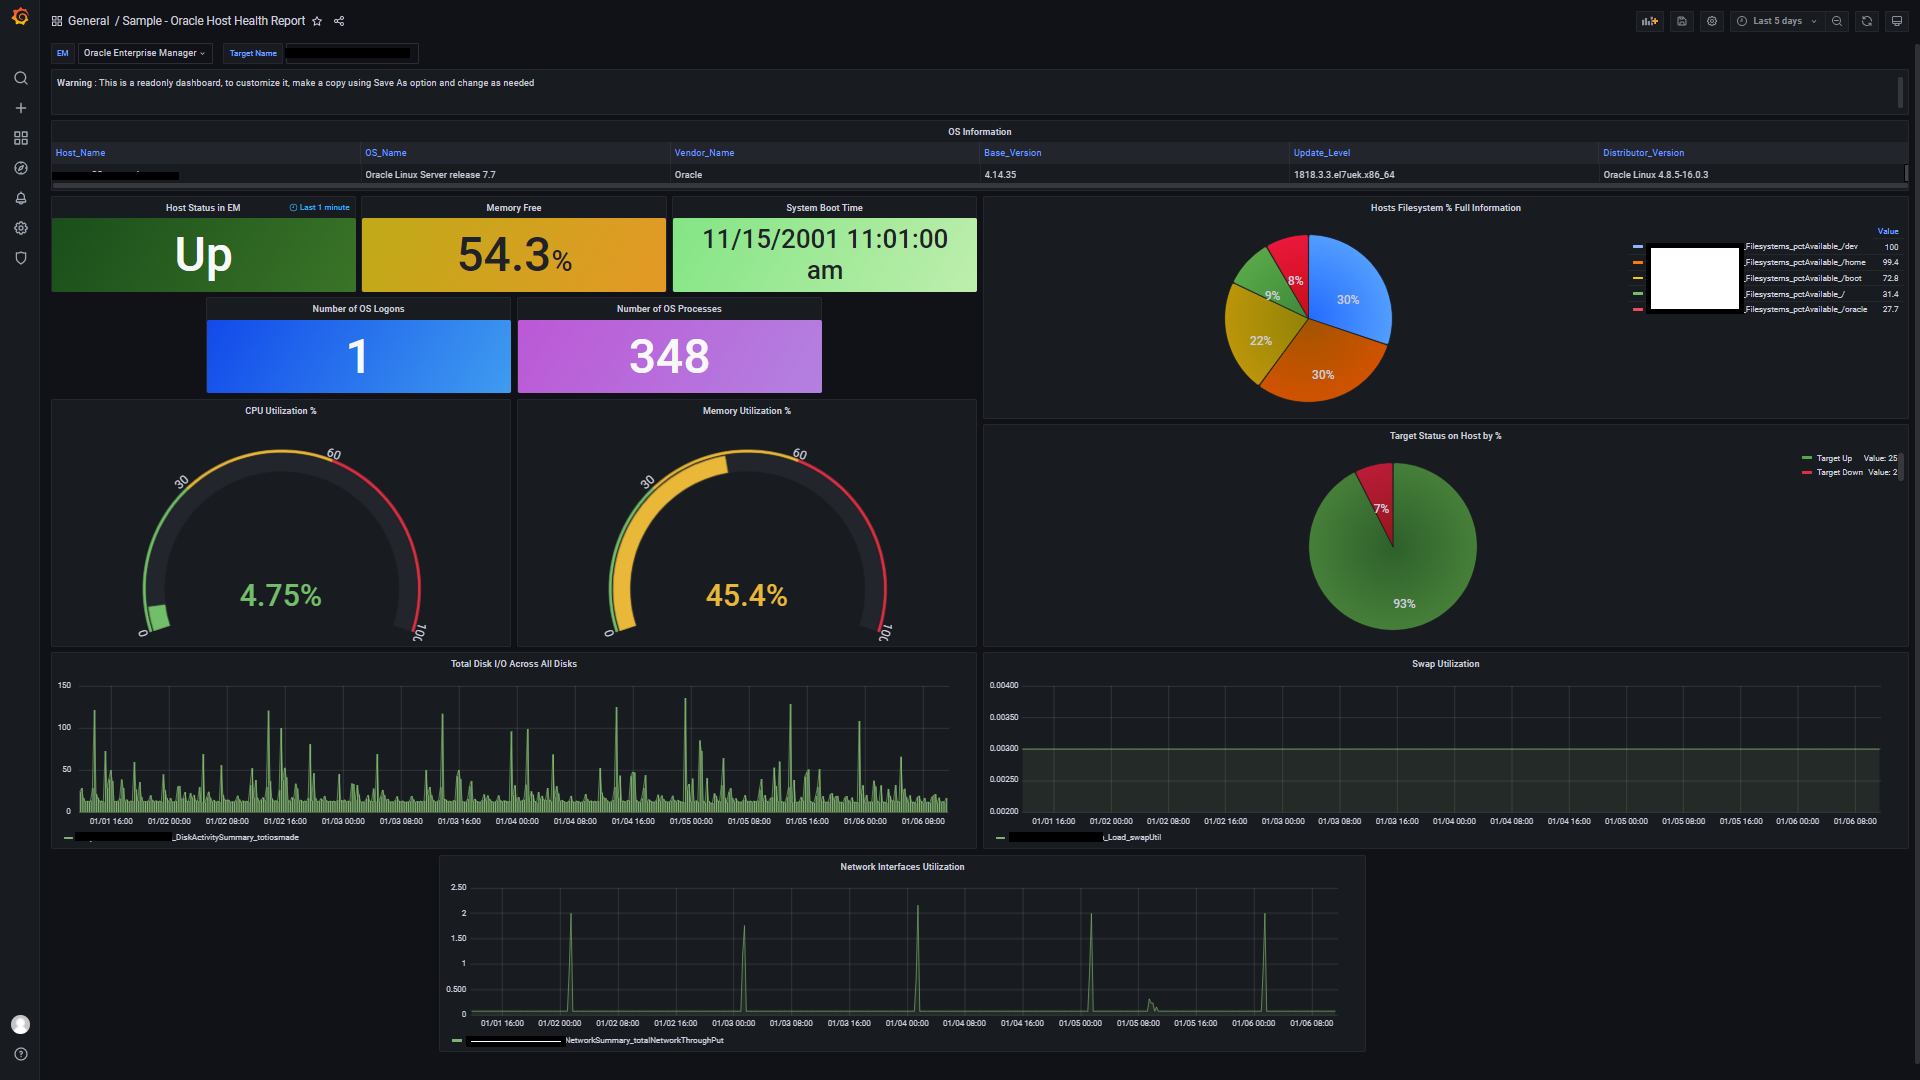
The metric panels list for the Host Health Report dashboard
OS Information: This panel displays the target host Operating System in the EM console for monitoring. This panel is built using a custom SQL query to get details stored in the EM repository database:
SQL Query:
select o.host "Host_Name",
 o.name "OS_Name",
 o.vendor_name "Vendor_Name",
 o.base_version "Base_Version",
 o.update_level "Update_Level",
 o.distributor_version "Distributor_Version"
 from sysman.mgmt$os_summary o
 where o.host = ($oem_gf_target_name)
NOTE: Variable $oem_gf_target_name is a feature of the EM Grafana App Plugin. See the EM App for Grafana Documentation for details and usage.
Host Status in EM: This panel shows the status of a target host that is discovered in the EM console. Being able to quickly view if the host is up or down helps users determine the next steps needed. This panel is built on a custom query to get host status from the EM repository database.
SQL Query:
select sysdate as time_sec, c.availability_status_code AS Status, c.availability_status as metric
 FROM sysman.mgmt$availability_current c
 WHERE c.target_name = $oem_gf_target_name
 AND c.target_type = $oem_gf_target_type;
NOTE: Variables $oem_gf_target_type and $oem_gf_target_name is a feature of the EM Grafana App Plugin. See the EM App for Grafana Documentation for details and usage.
Memory Free: This panel shows the free memory available on the host target and was built on an out-of-the-box metric collected in the EM console for host targets. This panel enables a user to see if there is still memory available on a host. It can be used to help a user isolate if there is a lack of memory on the host impacting an application or workload.
System Boot Time: This panel displays the last system boot time for the host. Quick access to this information can be useful to see if a host was rebooted recently or running for some time. It is built using a custom SQL query to the EM repository database to get the system uptime for the host:
SQL Query:
select c.value value
 from mgmt$metric_current c
 where metric_name='SystemTime'
 and metric_column = 'SystemBootTime'
 and c.target_name=($oem_gf_target_name)
 and c.target_type=($oem_gf_target_type);
NOTE: Variables $oem_gf_target_type and $oem_gf_target_name is a feature of the EM Grafana App Plugin. See the EM App for Grafana Documentation for details and usage.
Number of OS Logons: This panel shows the current number of OS logons. Without having to log in to a host, a user is quickly able to see if there are no users on a host or a lot of users on a host impacting its performance. The following metric must be enabled for the host target to see this information: Once on the Host homepage, use the following navigation: Host Dropdown> Monitoring > All Metrics > In the Search box enter Users > Click on Users from the list returned > On the right pane, click on the pencil icon to edit the metric > Click on “Enable” and OK to save.
SQL Query:
select sysdate -(5/24/60) time_sec, SUM(c.value) value, c.metric_column metric
 from mgmt$metric_current c
 where metric_name='Users'
 and metric_column = 'numLogons'
 and value > 0
 and c.target_name=($oem_gf_target_name)
       and c.target_type=($oem_gf_target_type)
 group by c.metric_column;
NOTE: Variables $oem_gf_target_type and $oem_gf_target_name is a feature of the EM Grafana App Plugin. See the EM App for Grafana Documentation for details and usage.
Number of OS Processes: This panel displays the current number of Operating System processes running on a host and is an out-of-the-box metric collected in the EM console for host targets. Being able to see this information aids users in isolating and diagnosing host issues faster.
Host Filesystem % Full Information: This panel displays in a percentage, how full a host file system is and is a metric collected from the EM console for host targets. This enables a user to quickly see if a host filesystems are close to 100% and have the system administrator add space to prevent an outage.
Target Status on Host by %: This panel shows the number of each target_type discovered in the EM console, by host and its current status. This is useful for users to verify the status of a host without having to log in to it and allows for faster action on issues encountered. This panel is built with a custom SQL query to the EM repository database to gather the status of all targets on the host in EM by percent:
SQL Query:
select sysdate -(5/24/60) time_sec, COUNT(*) value, c.availability_status metric
 FROM mgmt$availability_current c, mgmt$target t
 where c.target_guid = t.target_guid
 and t.host_name = ($oem_gf_target_name)
 GROUP BY c.availability_status;
NOTE: Variable $oem_gf_target_name is a feature of the EM Grafana App Plugin. See the EM App for Grafana Documentation for details and usage.
Total Disk I/O Across All Disks: This panel displays the Total Disk I/O across all disks for a discovered host in the EM console. With access to this information, users can isolate performance issues or bottlenecks faster that are caused by excessive host and/or database I/O processing. This panel was built on an out-of-the-box metric that is already collected in the EM console for host targets.
Swap Utilization: This panel shows the current swap utilization for a target host. Users use this information to help identify timeouts, poor performance, and instance evictions, caused by low memory or memory oversubscription issues. This panel was built on an out-of-the-box metric that is already collected in the EM console for host targets.
Network Interfaces Utilization: This panel displays total network throughput interface values for a host. Users use it to monitor network interface efficiency and help isolate if a target host has an interface introducing network errors or if there is a broader network issue impacting a host. This panel was built on an out-of-the-box metric that is already collected in the EM console for host targets.
USE CASE: RESOLVE ISSUE ON A HOST
“Akash, a Developer, needs the help of IT to help install a new database home on a host used for QA. However, the DBA replied to his IT service request saying there is a problem with the OS on the host and they were not able to create a new directory structure for the installation of the files. As Akash already uses Grafana, he has another option available; he displays the Host Health Report Dashboard (enabled by the EM App plugin for Grafana) to see if he can resolve the issue so QA testing can be completed on schedule. Using that dashboard he sees the host has a file system almost full and then contacts DevOps who can add space that same day.”
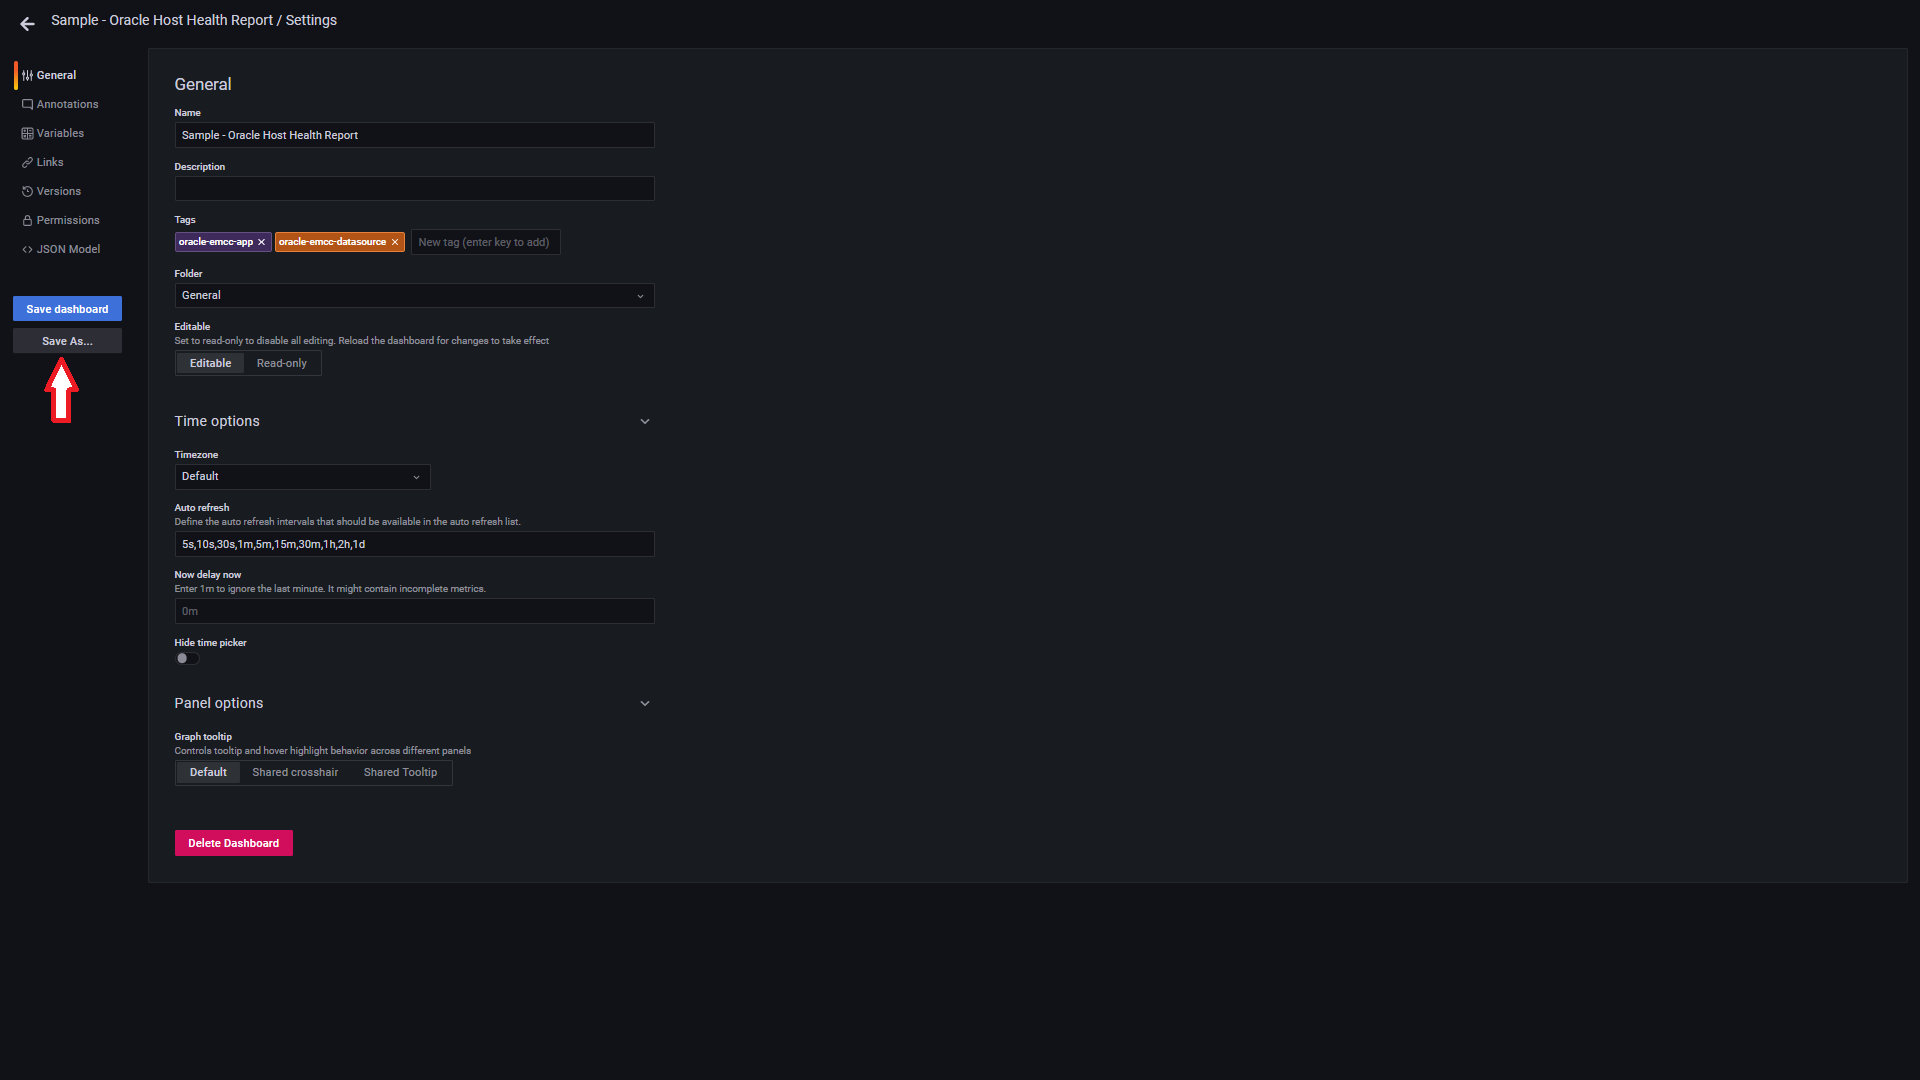
Dashboard Post Install Configuration Best Practice:
As with all out-of-the-box dashboards, a copy should be made for usage and customizations. To copy the Dashboard:
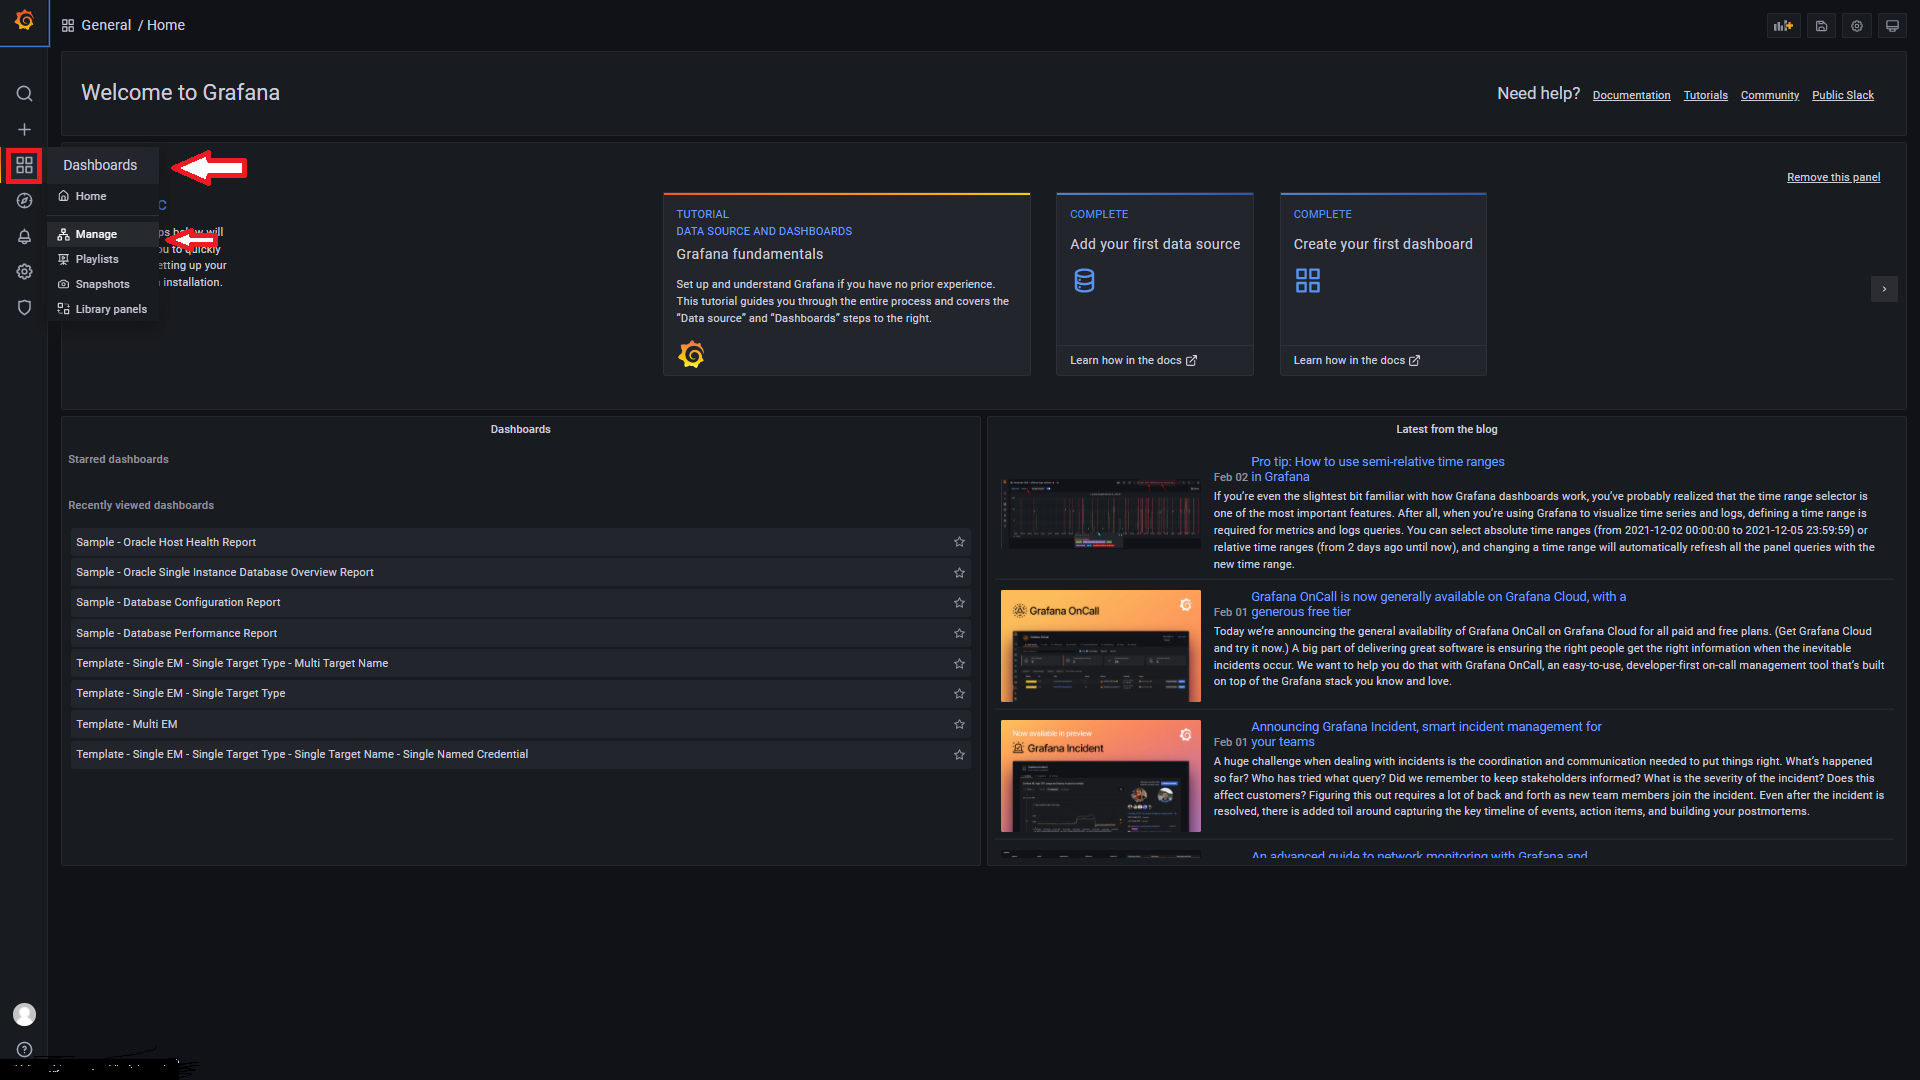
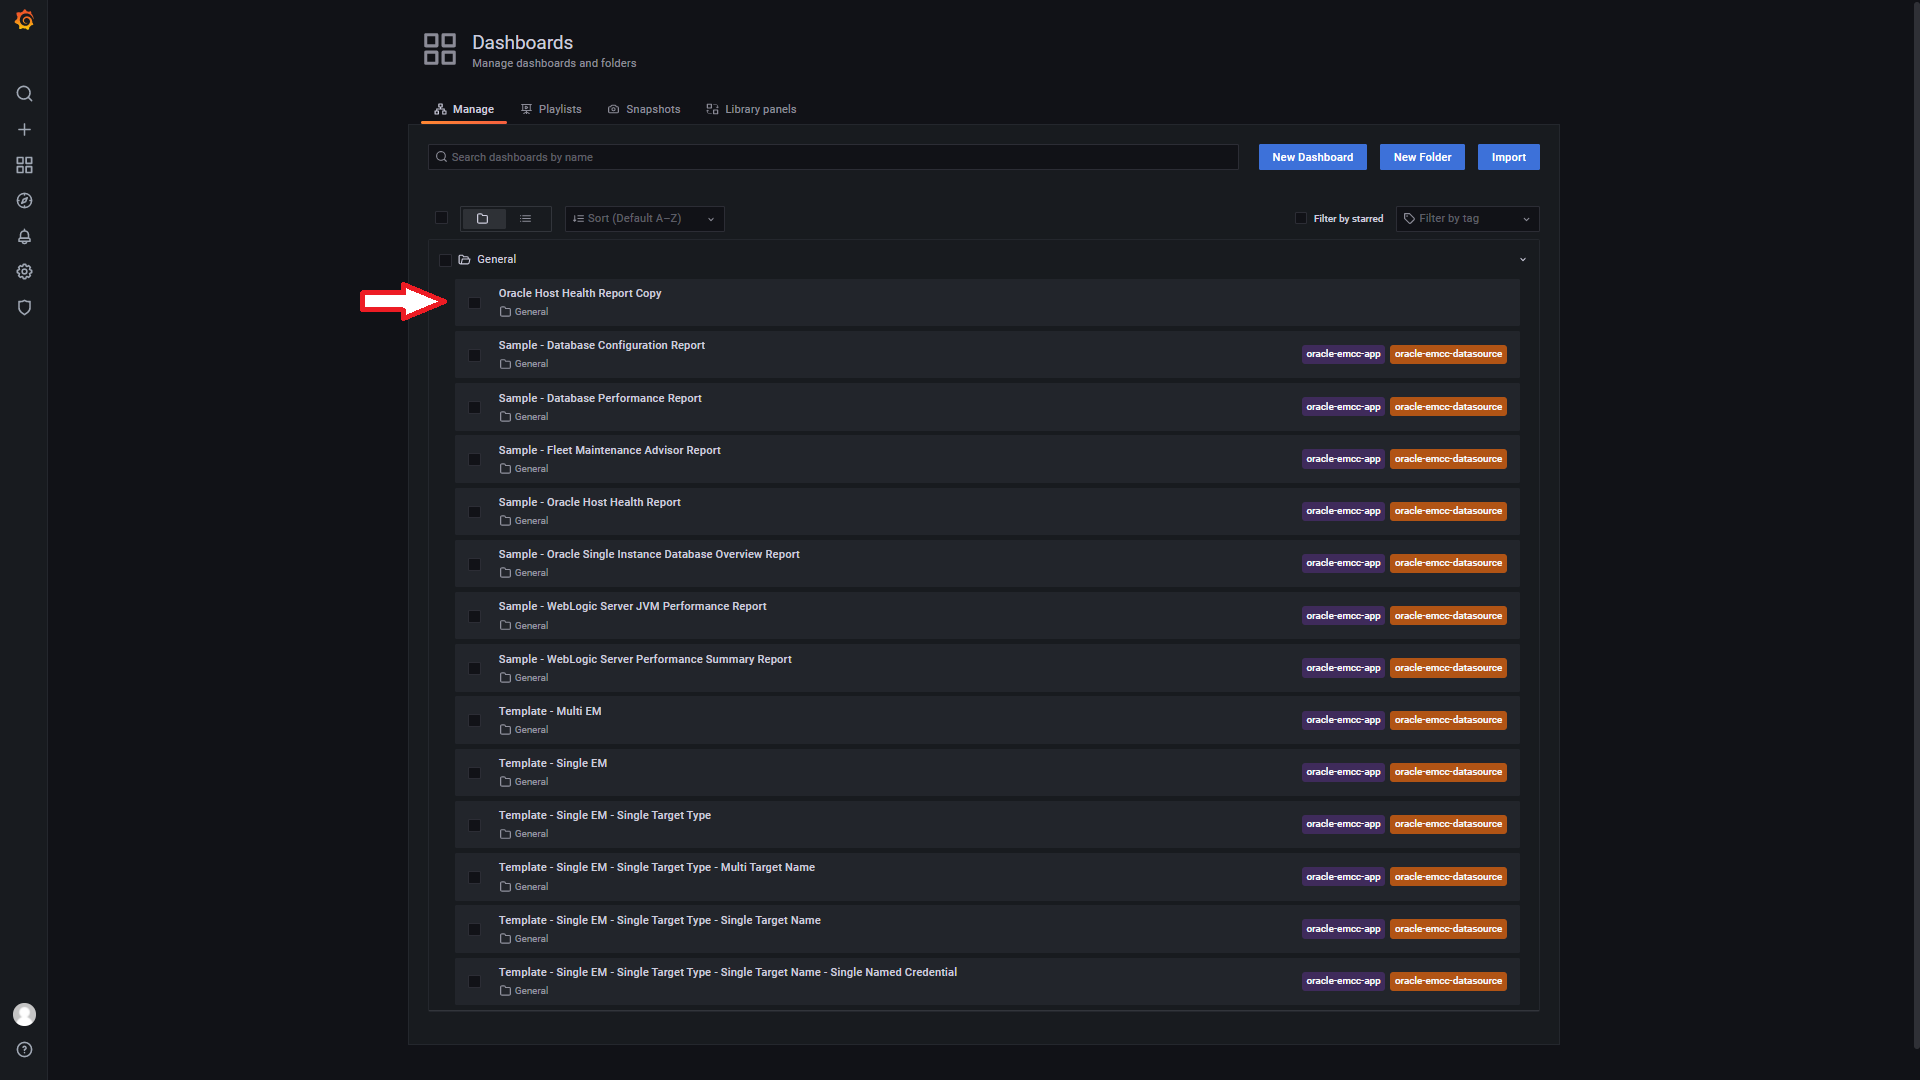
1. In the Grafana Server UI, click on the Dashboard icon on the left (4 squares icon). Select Manage from the list. This gives a list of all the dashboards for this Grafana server, both out of the box and any custom.
2. Click on the Dashboard that needs to be copied. For example Sample – Oracle Host Health Report.
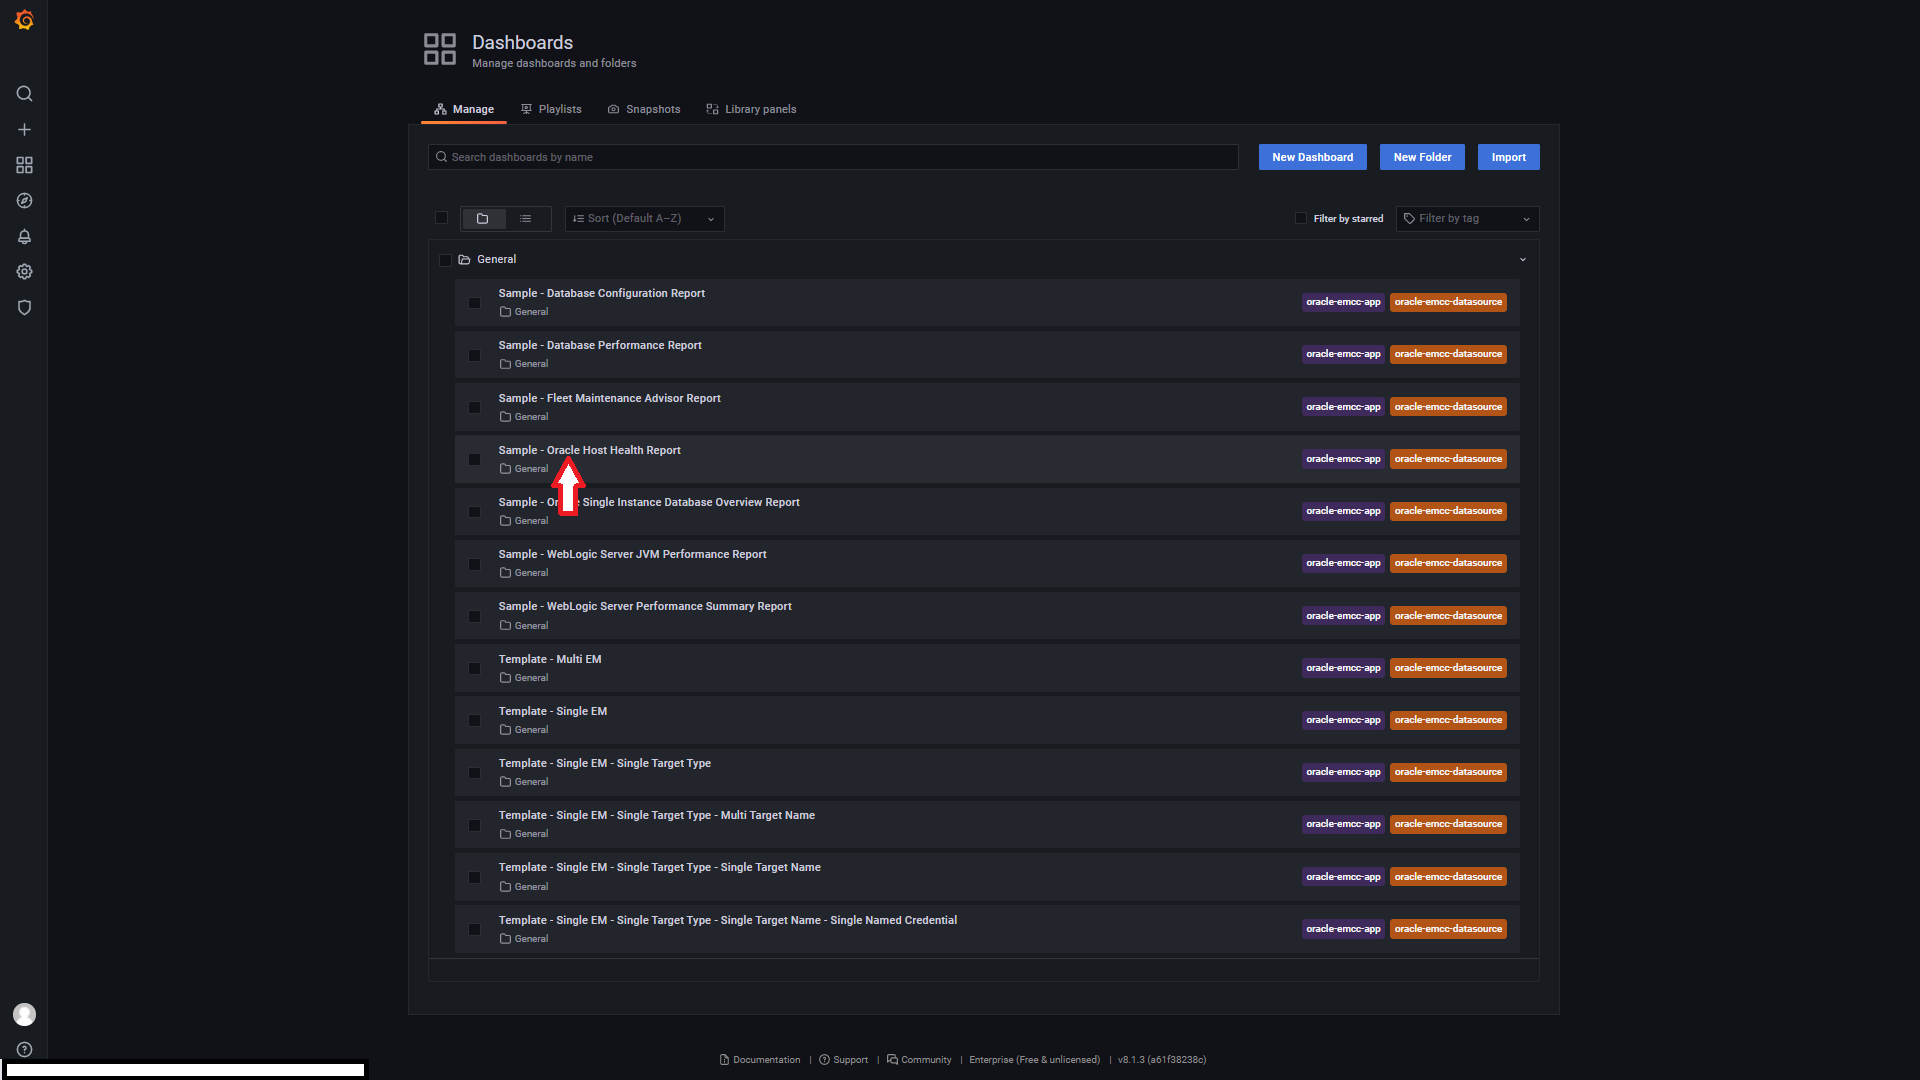
3. Once in the Dashboard, click on the gear icon in the upper right of the dashboard. This opens up the Settings for the Dashboard.
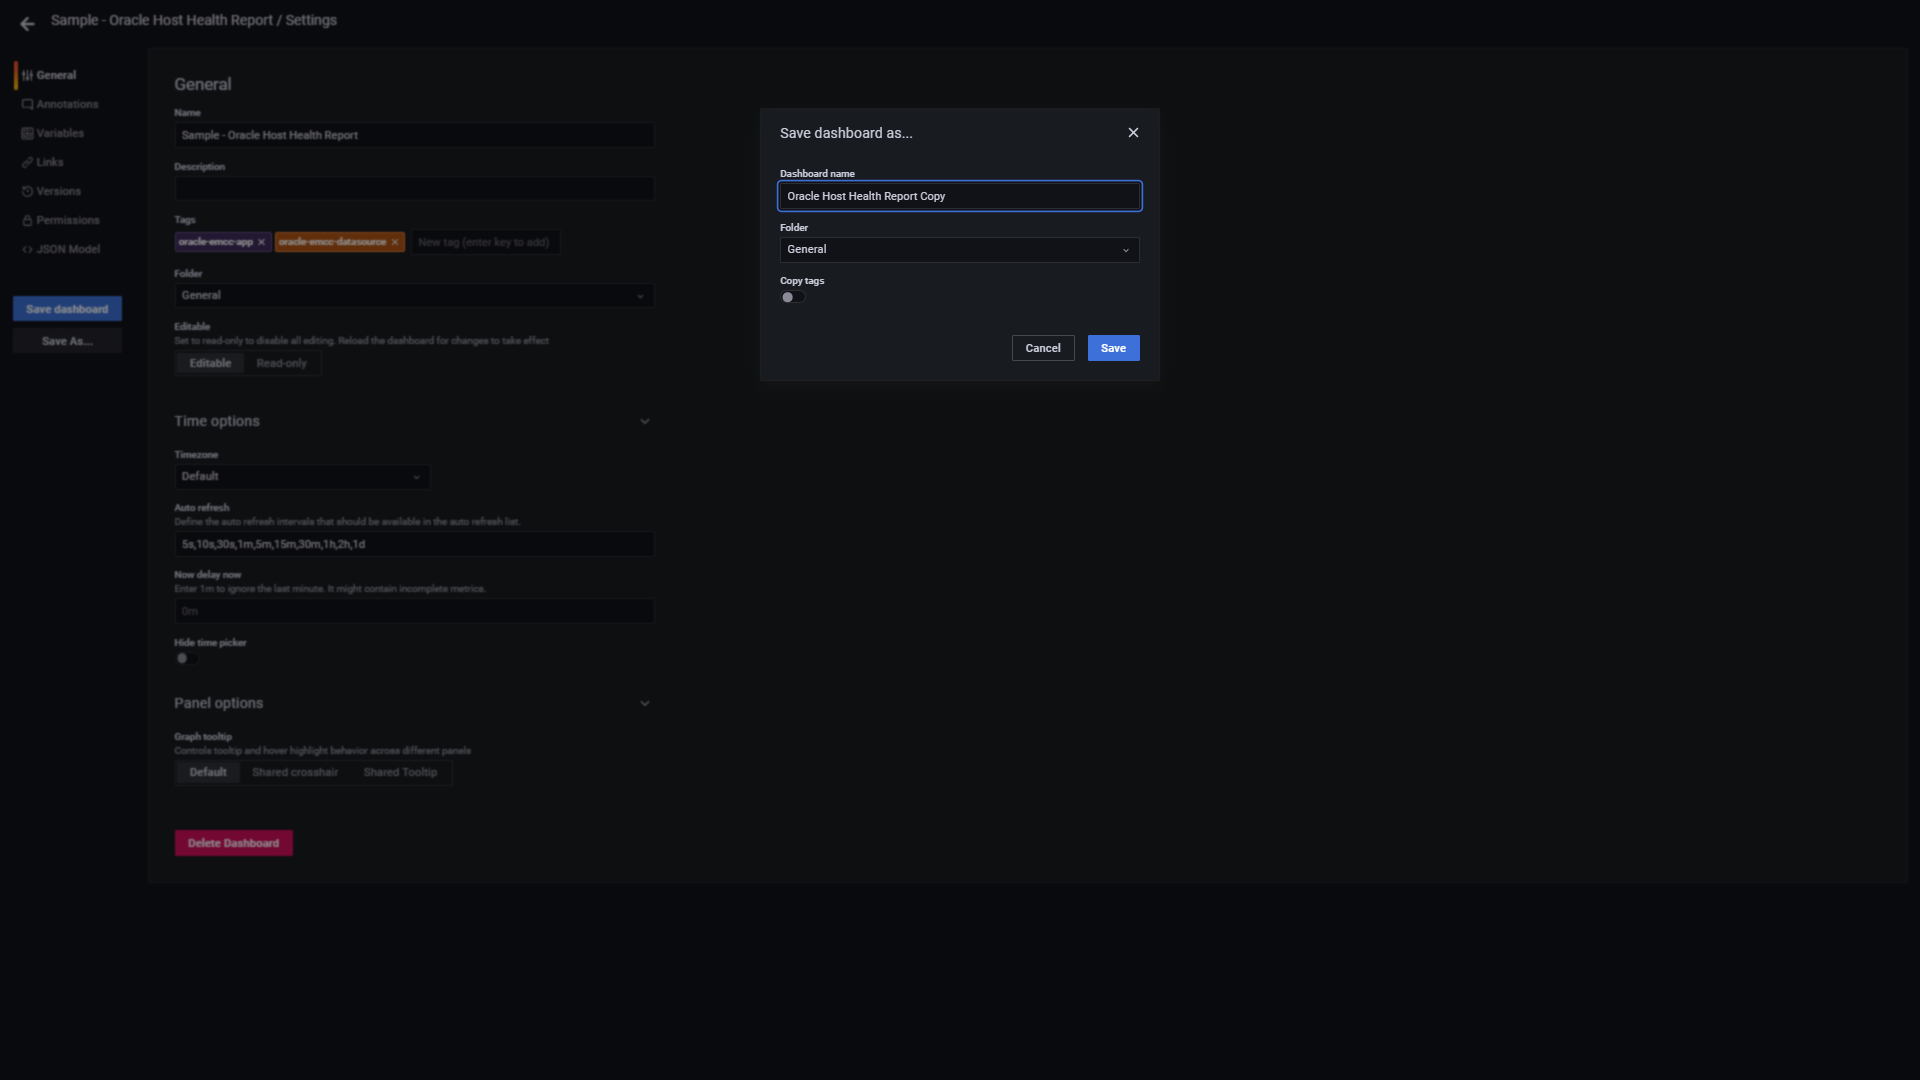
4. On the far-left pane, at the bottom, select “Save As”. Update the Dashboard name for custom use. Hit the “Save” button.
The new copy of the out-of-box Dashboard is ready for use under the Dashboards > Manage.
For further post-install configurations, please see the EM App for Grafana Documentation for details and usage.
Connecting Oracle Enterprise Manager to Grafana using the EM Grafana App Plugin enables more users to gain insight from data already collected by EM so they can help isolate problems and make decisions faster.
Refer to the Oracle Enterprise Manager App for Grafana User’s Guide
