Kubernetes has found acceptance as the solution of choice as it offers a highly robust platform with automated software deployment and auto-scaling of containerized work loads. As more and more applications are deployed in Kubernetes clusters, there is a need for acquiring insights into the performance of applications both through logs as well as metrics. Oracle Management Agent is now available to be deployed in a Kubernetes cluster as a StatefulSet or a DaemonSet and offers out-of-box monitoring of that Kubernetes Cluster. The Management Agent enables Observability and Management services to collect logs, metrics and database collections. The Management Agent can also be used to scrape metrics from applications that emit metrics in Prometheus format.
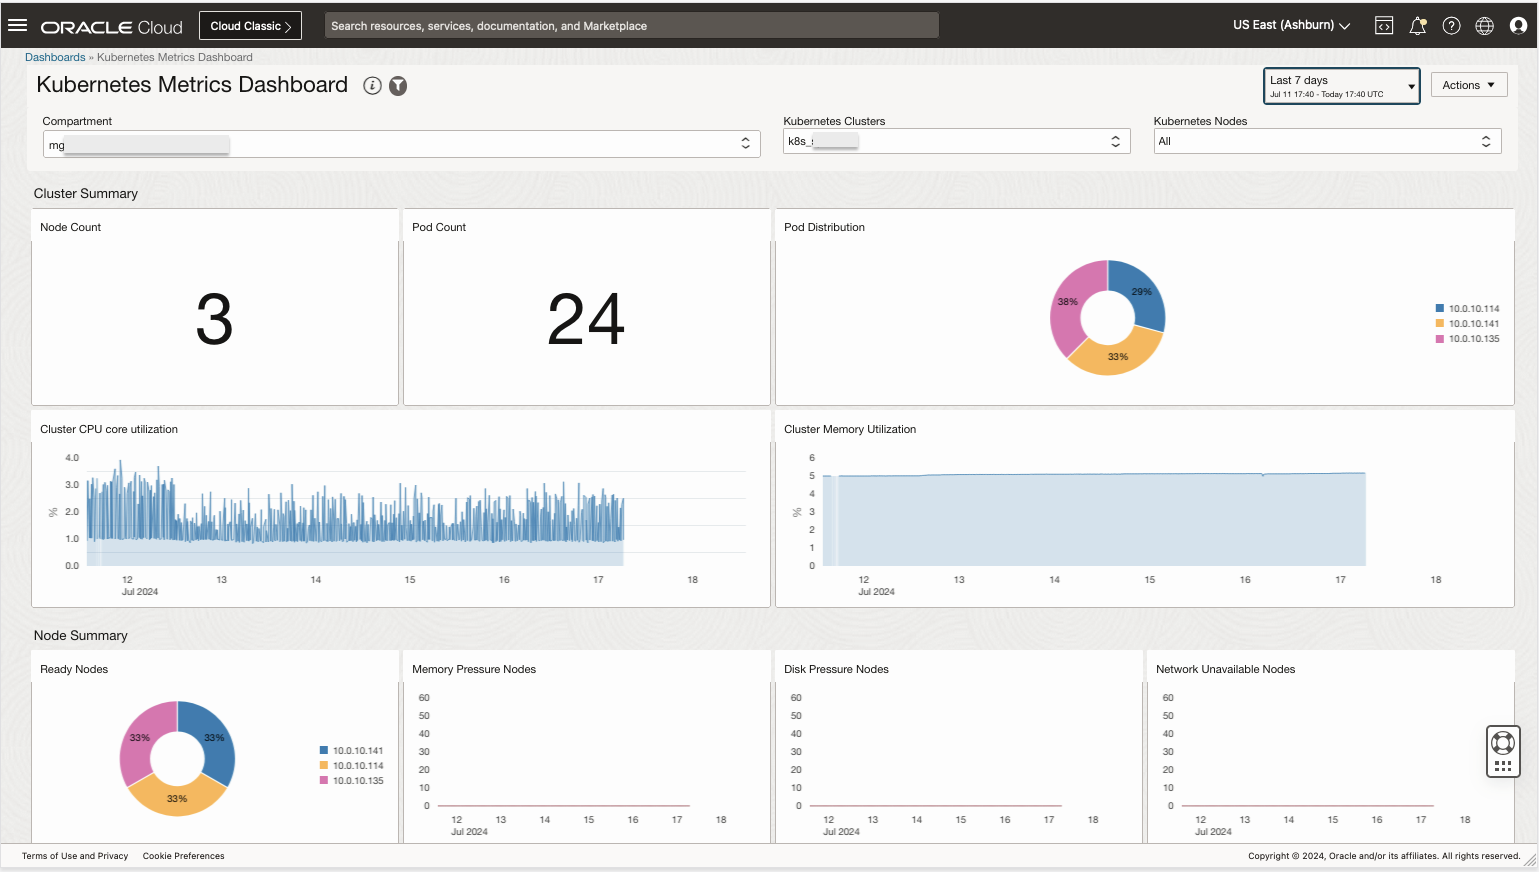
This blog describes how Management Agent can be deployed using Helm charts and then visualize metrics in an O&M Dashboard. When this configuration is complete, you will be able to see a dashboard as shown below, the Kubernetes Metrics Dashboard:
Perform prerequisites for monitoring the Kubernetes Cluster using Management Agent
This blog assumes you are familiar with Management Agent and O&M Dashboards and the following have been set up:
- oci-cli installed and configured with the right user principal to communicate with OCI services
- kubectl installed and configured with a Kubernetes cluster
- Helm installed and configured with a Kubernetes cluster
- Kubernetes Cluster set up where the Helm charts for Management Agent need to be deployed
The References section contains the documentation for all of these.
Gather the following required Helm charts information to deploy the Management Agent:
| Kubernetes Cluster Name | The name of the Kubernetes cluster |
| Kubernetes Namespace | The monitored Kubernetes cluster namespaces names – If not specified, by default all of the namespaces will be monitored. |
| Container Image URL | The Oracle Container Registry default URL – Version 1.4.0 of the container image is required for this. |
| Management Agent Install Key | The input.rsp file required for Management Agent registration |
| Compartment OCID | The compartment OCID where the metrics will be ingested |
Set up the Dynamic Group and Policies that allow the Management Agent to emit Kubernetes metrics to OCI Monitoring
Create a Dynamic Group and set up the following policies:
# Dynamic Group for Management Agent
# The compartment OCID should match the compartment of the Management Agent

ALL {resource.type='managementagent', resource.compartment.id='<management_agent_compartment_OCID>'}

# Policies required to allow the Management Agent Dynamic group to post metrics to OCI Monitoring
#  The DG-Group-Name should match the name that you give to the Dynamic Group that you create in the above step.
#  This compartment should match the name of the compartment that you have specified in the values.yml for the metrics

ALLOW DYNAMICGROUP <DG-Group-Name> TO USE METRICS IN COMPARTMENT <metrics-compartment-name> WHERE target.metrics.namespace = 'mgmtagent_kubernetes_metrics'
Set up the agent to emit metrics and import the dashboard to view the metrics
Here is a summary of steps:
- Download the Helm charts
- Generate the Management Agent install key
- Install the Helm Chart
- Verify that the Agent pod is running
- View the Dashboard in an O&M Service
These are described in detail here:
1. Download the Helm charts
Create a directory to hold the Helm charts and extract the package.
For this blog, we will be using the oci-onm-3.4.4 release of the Helm charts. Use the latest released version that is available here.
The Helm charts for version 3.4.4 are hosted here.
mkdir /tmp/helm
cd /tmp/helm
tar -zxvf oci-onm-3.4.4.tgz
2. Generate the Management Agent Install Key
Follow the documentation here to create a Management Agent install key. Be sure to create the key in the correct compartment. Download the key to a file and name the file input.rsp.
Generate a base64 encoded representation for input.rsp:
$ base64 -w 0 input.rsp
[...]
IyMj... Y29tCgoKCg==
This shows the command to generate a base64 encoding of the entire input.rsp file along with a partial output of the command. Make sure you copy only the base64 encoded content. It should end with “==”. Do not include the command prompt at the end.
3. Install the Helm charts
The Management Agent Helm chart contains templates that require user input values.
The values.yaml should be available under the oci-onm directory that was created in step 1.
Update oci-onm/values.yaml with the values indicated with the arrows.
Notes:
- This file contains snippets of the actual file. Please modify only the lines indicated with the arrows.
- oci-onm installs and sets up all the Observability and Management components.
global:
  # -- Kubernetes Namespace in which the resources to be created. Set oci-kubernetes-monitoring-common:createNamespace set to true, if the namespace doesn't exist.
  namespace: oci-onm
  # -- Prefix to be attached to resources created through this chart. Not all resources may have this prefix.
  resourceNamePrefix: oci-onm
  # -- OKE OCID for an OKE cluster or an unique ID for other Kubernetes clusters.
  kubernetesClusterID:
  # -- Provide a unique name for the cluster. This would help uniquely identifying the logs and metrics data at OCI Logging Analytics and OCI Monitoring respectively, when monitoring multiple clusters
  kubernetesClusterName: NameOfYourCluster  <------------------ ENTER_VALUE_HERE

[...]

oci-onm-mgmt-agent:
  oci-onm-common:
    enabled: false
  namespace: "{{ .Values.global.namespace }}"
  serviceAccount: "{{ .Values.global.resourceNamePrefix }}"
  kubernetesCluster:
    name: "{{ .Values.global.kubernetesClusterName }}"
  mgmtagent:

    # Provide the base64 encoded content of the Management Agent Install Key file (e.g. cat input.rsp | base64 -w 0)
    installKeyFileContent: "IyMj...Y29tCgoKCg=="  <-- ENTER_BASE64_VALUE

    # Follow steps documented at https://github.com/oracle/docker-images/tree/main/OracleManagementAgent to build docker image.
    image:
      # Replace this value with actual docker image URL for Management Agent
      url: container-registry.oracle.com/oci_observability_management/oci-management-agent:1.4.0
      # Image secrets to use for pulling container image (base64 encoded content of ~/.docker/config.json file)
      secret:
Verify the templates as follows:
helm template /tmp/helm/oci-onm/
Now, install the Helm chart in the default namespace:
helm install mgmtagent-monitoring /tmp/helm/oci-onm/ -n default
4. Verify the installation
Verify that the StatefulSet for the Management Agent is ready and running:
$ kubectl get pods -n oci-onm
NAMESPACE     NAME                                  READY   STATUS    RESTARTS   AGE
oci-onm       oci-onm-mgmt-agent-0                  1/1     Running   0          26h
6. View the Dashboard in O&M Service
Kubernetes metrics can be visualized in the sample dashboard. This dashboard contains the visualization for some of the metrics that the agent is emitting.
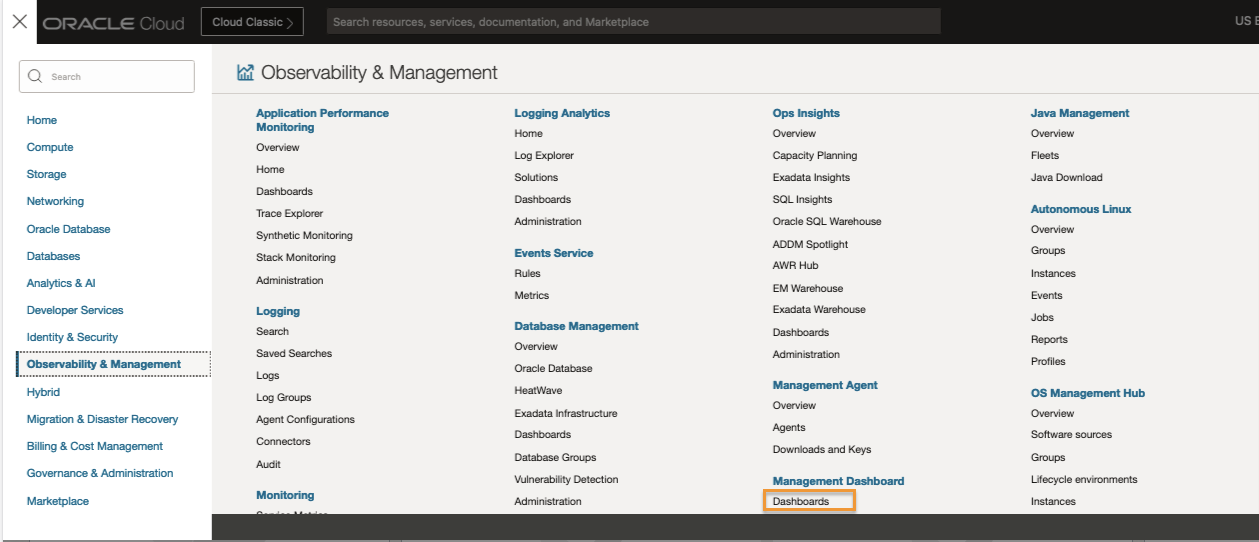
Navigate to OCI Console menu, Observability and Management, Dashboards.
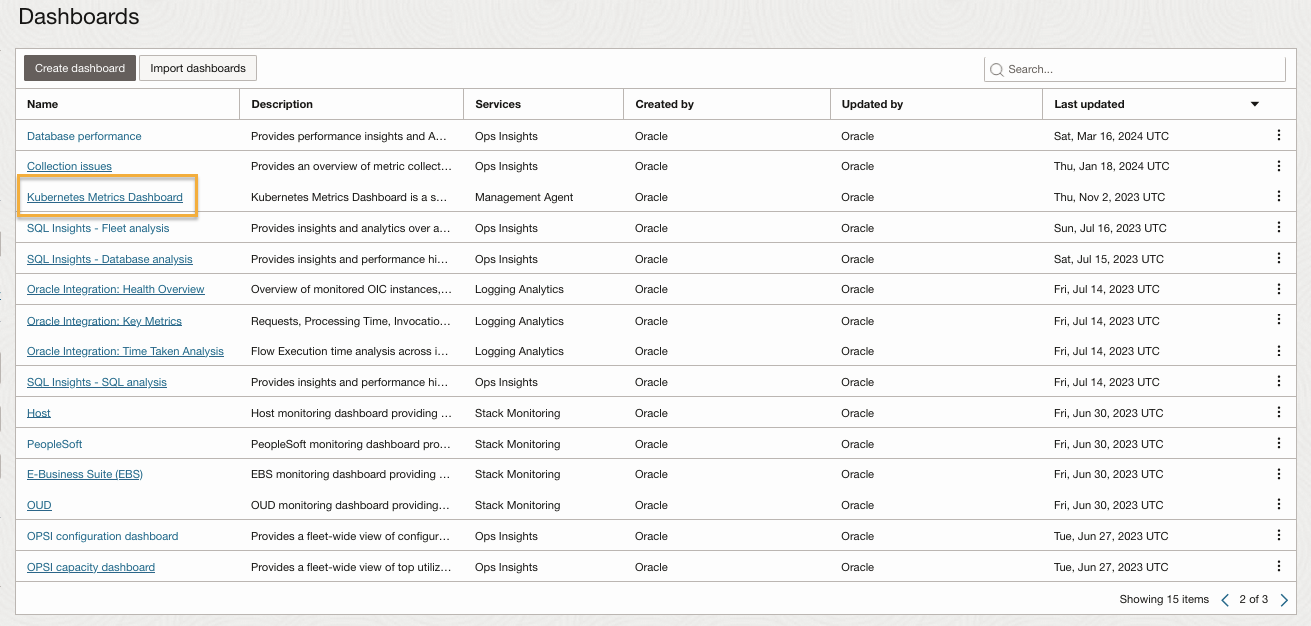
Search for the dashboard named: Kubernetes Metrics Dashboard after clicking on the highlighted menu option.
Click on the Kubernetes Metrics Dashboard to bring up the dashboard. Select the right compartment and the right Kubernetes Cluster and see the metrics visualization for some of the typical metrics. The Kubernetes Metrics Dashboard is now ready – enjoy your monitoring using Mangement Agent!
References