In addition to Database Management’s comprehensive database performance diagnostics and management capabilities for Oracle Databases, Database Management now supports the monitoring of Oracle Exadata Storage Infrastructure!
As a database administrator, you can use Database Management to discover and monitor the on-premises Exadata Infrastructure. We have included new capabilities to monitor Oracle database systems located on premises along with the Exadata Storage components. The effort required to discover the components separately has been greatly reduced. Database Management provides a single-pane-of-glass view of the components and enables identification of availability and performance issues before they impact the database.
Database Management supports Exadata System Software version 20.1 and later.
Post-discovery of the on-premises Exadata Infrastructure capabilities:
- Monitor the key performance and configuration metrics of the Exadata infrastructure at the fleet level.
- Drill down from the fleet view to a specific Exadata infrastructure.
- Monitor the performance and availability of the storage servers and the storage server grid.

Database system discovery process in the on-premises Exadata Database machine.
As a first step, you need to discover the Database System in the on-premises Exadata Database Machine. Next, discover the associated Exadata infrastructure, then register and connect to the storage servers. Utilize the same Management Agent used to discover the database system.
The Exadata infrastructure discovery process includes the following main operations:
- Select a previously discovered database system residing in the same Exadata Database Machine.
- Configure the connectors to the storage servers that you want to monitor using Database Management.
- Review the associated database system and the storage servers that will be monitored using Database Management and creating the Exadata infrastructure resource.
Key features of Exadata fleet summary monitoring
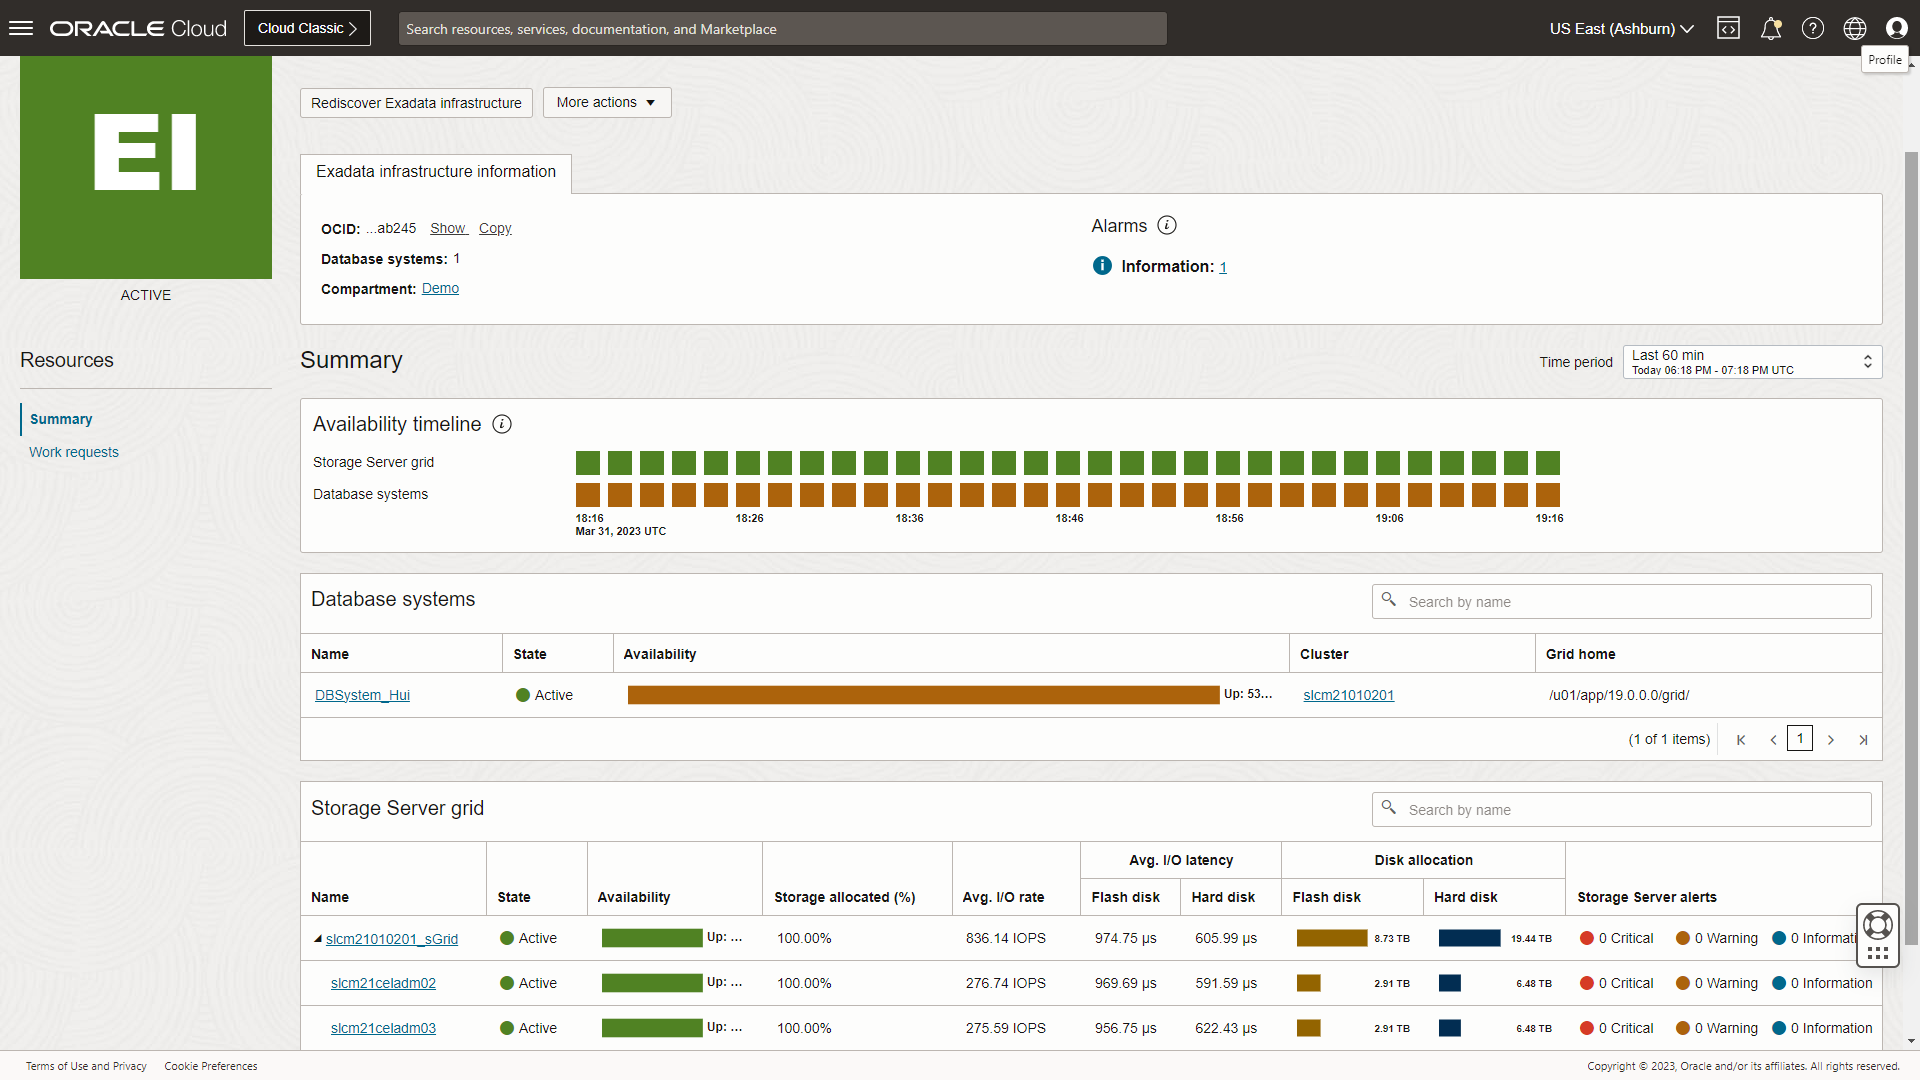
After discovering the Exadata Infrastructure, resource usage and open alarms can be monitored across the fleet with a master detail layout on the Exadata fleet summary page. From the Exadata fleet summary page, the Exadata infrastructure details page filters to obtain additional insights into specific Exadata infrastructure resources. Important details such as availability and key storage metrics of the infrastructure comprising the DB systems and the storage server grid components are readily available.
Monitor database systems for component performance
From the Exadata infrastructure details page navigate to the Database system details page and view detailed information about the various components of the DB system.
- Clusters
- Databases
- ASM
- Listeners

Monitor Exadata storage infrastructure components
The Exadata infrastructure details helps monitor the status, availability, and resource usage details of the storage servers in the storage server grid. Exadata infrastructure details provide a fine-grained performance summary of the flash disks and hard disks in the storage server grid and the alerts sent from the storage servers. The detailed performance summary represents events of importance occurring within the storage servers.
The Exadata infrastructure details page filters to a Storage Server grid: The Storage Server grid details page helps monitor the alarms that are firing on key storage metrics and navigates to the OCI Monitoring service to set and modify the various metric and alarm thresholds. The monitoring service enables alerts sent from the storage servers and represents events of importance occurring within the storage servers. The storage server grid helps you visualize the availability and health of the storage servers, key storage performance characteristics, and resource utilization of storage by individual databases.

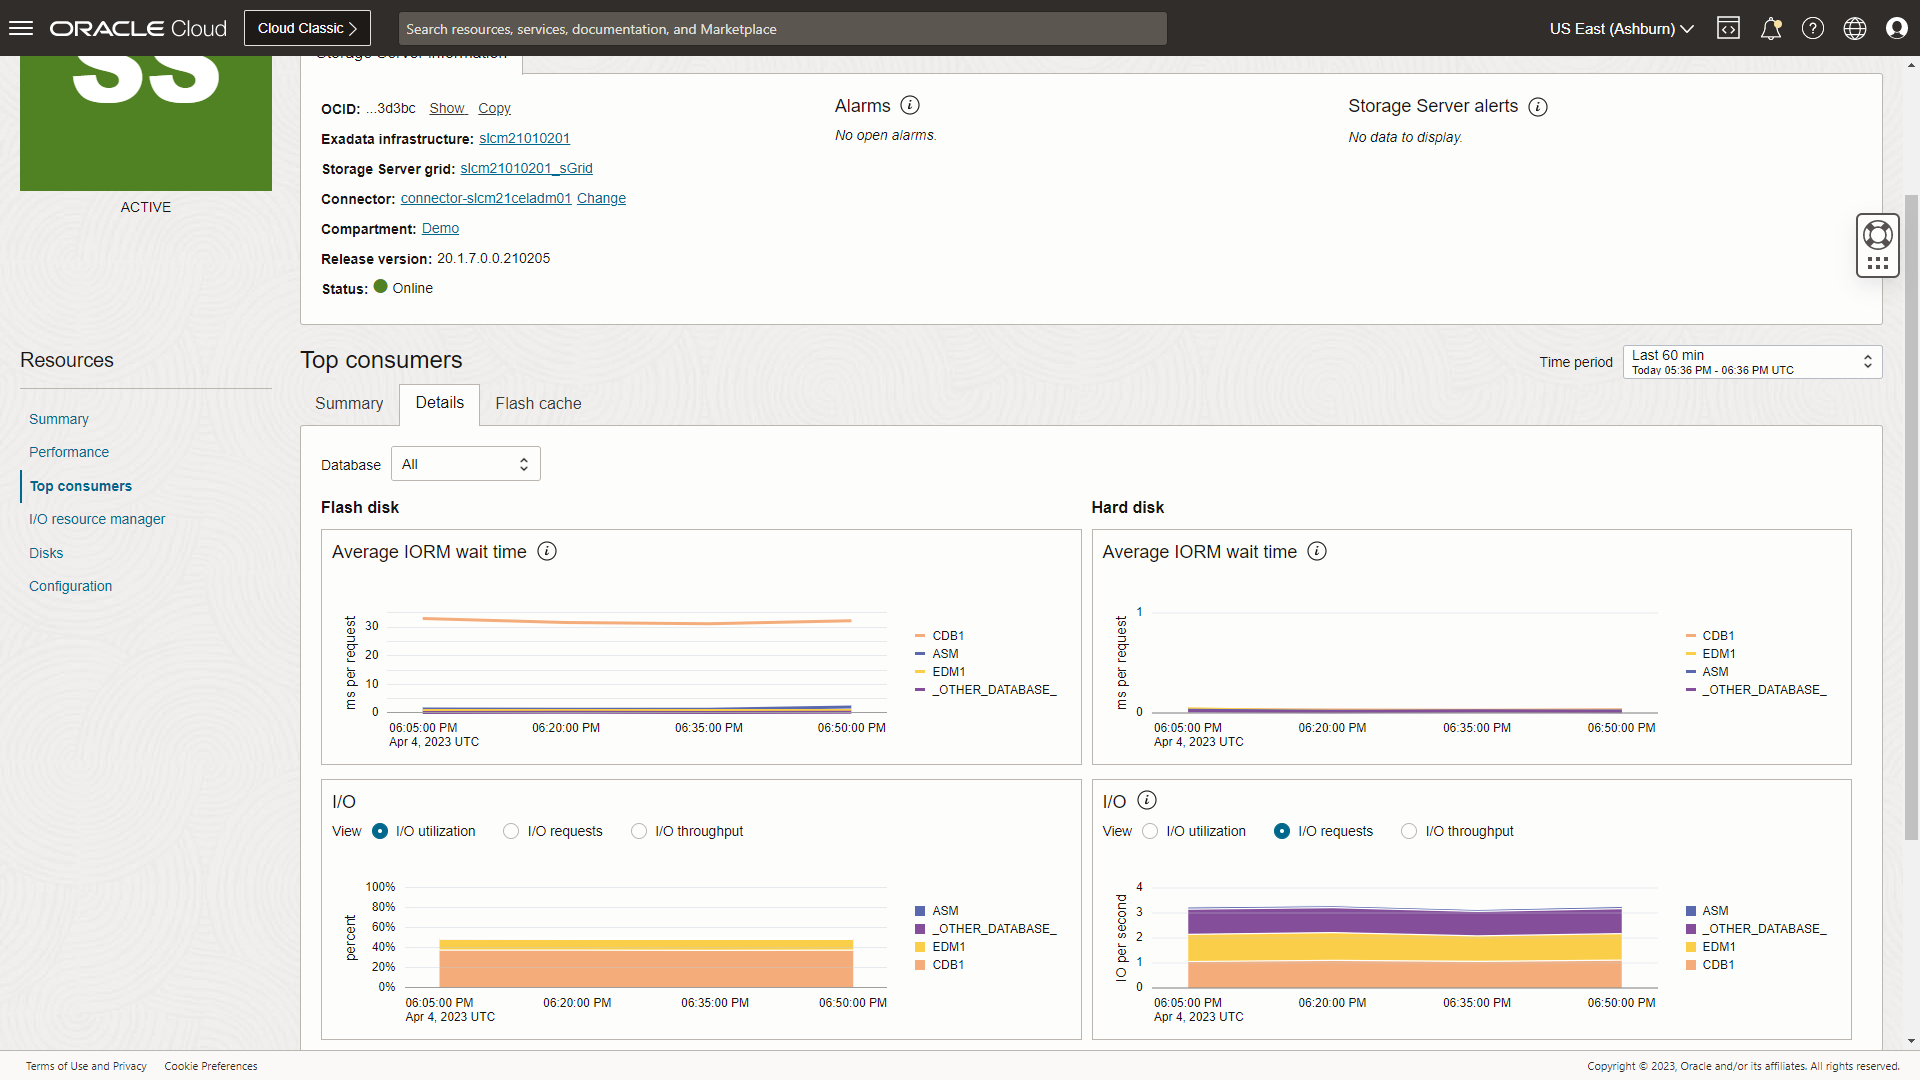
The Storage Server grid filters to obtain insights by clicking on the left “Resources” pane: This new feature provides a holistic view of I/O distribution across databases, top I/O consumers, and flash cache usage by the top five databases, and disk configuration. One of the new capabilities of this feature is the ability to list the top activity by SQL statement inside the storage cells, which can be used for detailed performance troubleshooting.

Key monitoring capabilities include:
- Track throughput usage and utilization percentage
- Review flash latency, IORM, and disk latency wait times
- Relate metrics with the performance charts to compare the I/O distribution across databases.
Storage server details include:
- Availability, flash and disk latency, and IORM waits of individual cell disks
- Metrics with performance charts to compare the I/O distribution across databases at cell level.

Get started today!
In summary, the Storage Server grid details and Storage server details pages can be used to:
- Spot I/O bottlenecks
- Instrument small I/O vs large I/O requests
- Understand I/O correlation to database single block reads
- Instrument I/O resource load per database, resource consumer group, or resource category
Review or alter IORM settings and monitor SQLs for smart scans and offload efficiency, etc.to gain valuable insights into the performance of the database workloads running in your Exadata system.
Try out this feature set the next time you use Database Management. Find Database Management under the Observability and Management menu in the Oracle Cloud Infrastructure Console. The service is accessible through the Console, CLI, and REST API and is already available in all commercial regions, with Government regions coming soon.
Sign up for an Oracle Cloud Infrastructure trial account!
Related resources
- Hands-on lab: Get Started with Oracle Cloud Infrastructure Database Management
- Database Management Videos
- Database Management Blogs
- Database Management Technical Content