

Summary: FinOps in a multi-cloud environment is inherently complex, because fragmented, and inconsistent cost data makes it difficult for business leaders to control spending, compare cloud economics, and establish clear accountability across teams. Using the FOCUS standard, Oracle Log Analytics provides a centralized and consistent view of cost and usage data across cloud providers, accounts, services, regions, resources, and tags. This enables organizations to identify key cost drivers, detect unusual consumption, prioritize optimization and migration opportunities, and improve chargeback and showback. With Logan AI, users can also explore trends and opportunities through natural-language questions, supporting stronger financial governance, faster decision-making, and reduced cloud waste.
Monitoring FinOps data across multicloud is a two-tier challenge. First, FinOps data is scattered across billing files, tags, accounts, regions, and service hierarchies. Second, each cloud provider has his own rules, policies and different agreements which makes comparison, investigation, and accountability harder than it should be.
That is where Oracle Log Analytics helps. It gives you a central, searchable and visual layer for FinOps monitoring, so you can turn cloud cost data into something you can investigate, trend, and act on.
Additionally, FOCUS, the FinOps Open Cost and Usage Specification, provides a common schema for cloud billing data for the majority of Cloud providers, making it easier to compare and analyze cost across providers, services, accounts, regions, resources, and tags.
Why Use Oracle Log Analytics for FinOps?
Oracle Log Analytics can index, enrich, aggregate, search, visualize, and monitor operational data. When you load cloud cost and usage data into Oracle Log Analytics, you can treat cost signals like operational telemetry and bring FinOps monitoring into OCI observability. This enables questions such as:
- Which cloud provider is driving the highest monthly growth?
- Which compartment, account, project, or tag is consuming the most budget?
- Which workloads are good candidates for optimization or migration?
- Are we seeing abnormal consumption patterns?
- Which teams or applications should be charged back or shown back?
Log Analytics dashboards can also be enhanced with Logan AI, allowing users to ask natural-language questions about consumption, optimization opportunities, migration paths, and usage trends.
From Questions to Insights: What the Dashboards Reveal
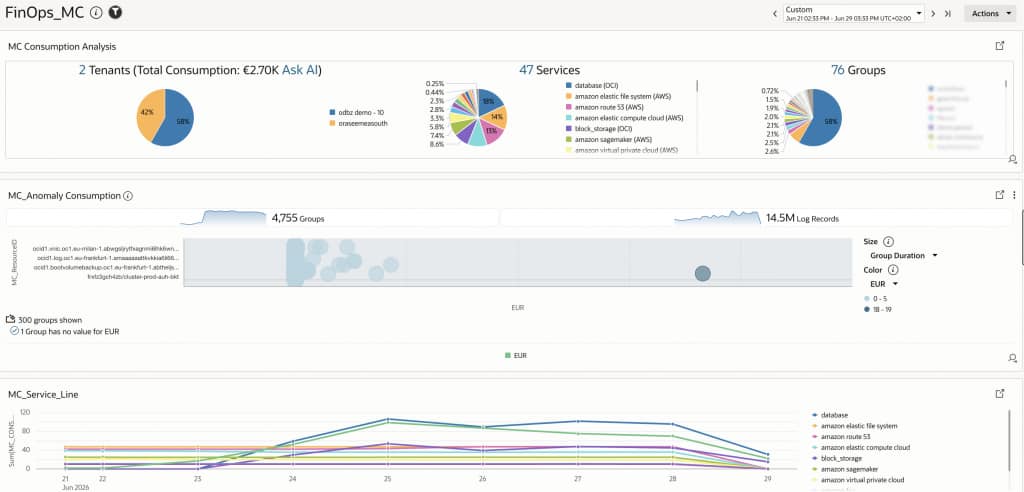
Dashboards should support investigation, not just presentation. You should be able to start with a high-level cost increase, identify the provider or business group responsible, drill into the affected service, and finally locate the individual resources or SKUs driving the change. Log Analytics dashboard with drill downs provide this capability for the FinOps data. You can easily answer common questions like the ones below:
What are the top services or regions by cost?
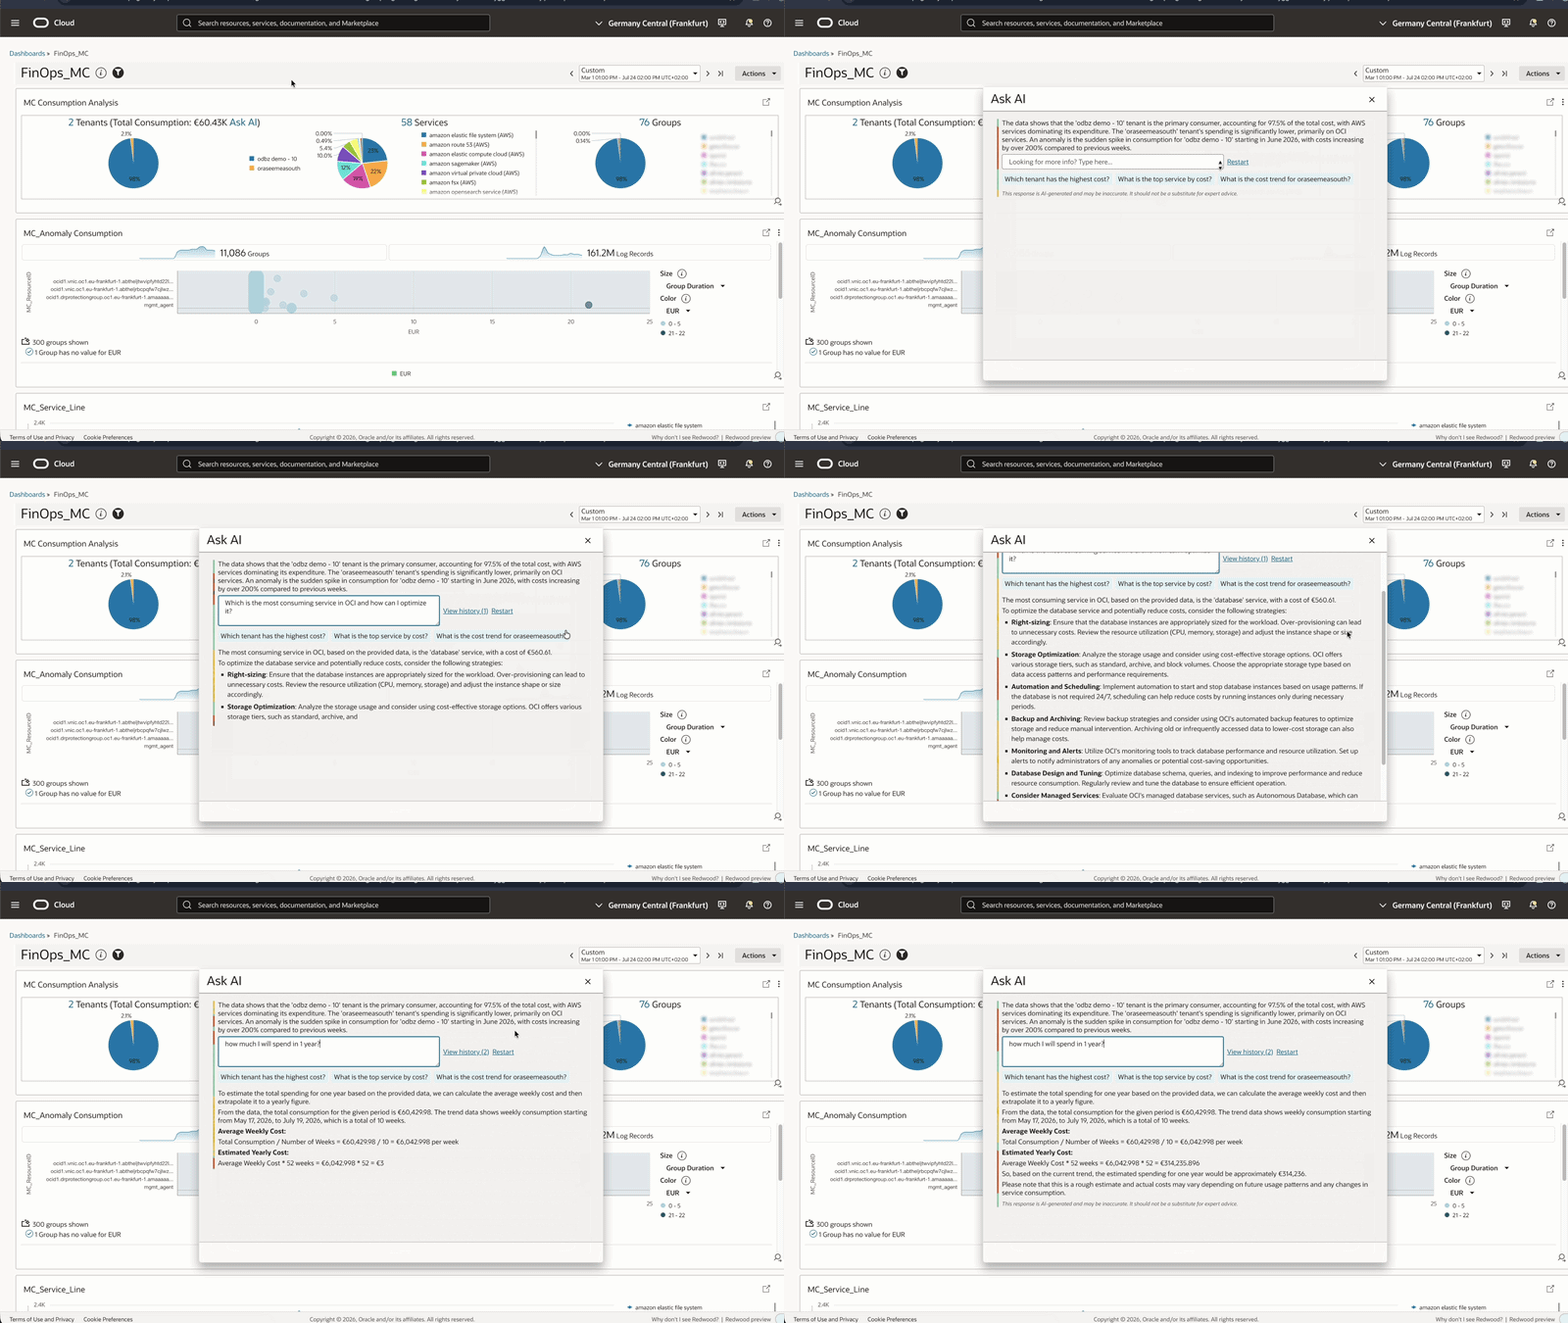
Identify cost anomalies across the services used, determine which service is the most expensive, and quantify how much its cost deviates from the average:

Define filters based on the environment, group, region, and service:

At the bottom of the dashboard, additional widgets provide insights such as service consumption trends, top consumers, and chargeback information grouped by business unit or group.
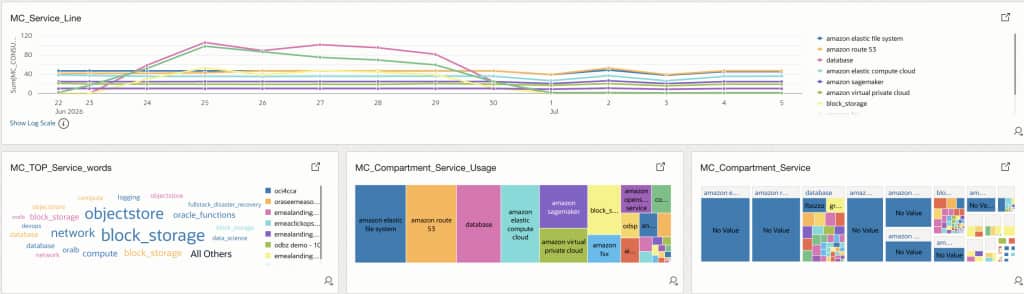
Custom widgets and alerts can be easily created using the raw consumption data. Data retention can be configured for multiple years, with the retention period managed through configurable purge policies.
Unified Cost Data
A common challenge in multicloud environments is that every provider exposes billing data differently. OCI, AWS, Azure, and other platforms each have their own terminology, account hierarchy, SKU model, and tagging conventions.
FOCUS helps normalize this complexity by providing a standard structure for cloud cost and usage data. The FOCUS FinOps standard report provides a standardized and comprehensive dataset that includes detailed information about costs, services, compartments, tags, and more. By mapping provider-specific reports into a consistent model:
- Finance and platform teams can analyze cost using shared dimensions such as provider, service, region, resource, usage quantity, currency, environment, business group, and tags. The result is cleaner analysis and stronger alignment between finance, engineering, and operations.
- This standardized format makes it easier to integrate OCI cost data into third-party tools or advanced analytics platforms.
OCI is fully compliant with FOCUS FinOps standard.
Tailored Views for Every Stakeholder
Different stakeholders need different cost views.
Executives need summarized cost trends, forecasts, and budget risk. Application owners need visibility into the services and resources owned by their teams. Finance teams need allocation, chargeback, showback, and variance analysis. Platform teams need operational signals that identify unusual growth, inefficient consumption, and opportunities for optimization.
With Oracle Log Analytics, dashboards can be designed for each audience while using the same normalized dataset underneath. This allows each group to see the cost signals that matter to their decisions without creating separate reporting pipelines.
For example, an executive dashboard can focus on monthly spend, forecast, and budget variance, while an application owner dashboard can focus on service-level consumption, tags, environments, and optimization candidates.
Better Budget Control
Cost control is not only about reporting after the invoice arrives. Teams need early signals when spend starts moving in the wrong direction.
By defining saved searches, metrics, dashboards, and alarms in Oracle Log Analytics, organizations can monitor overages, unusual growth, and spending patterns that require attention. This makes it possible to react earlier, reduce budget surprises, and support chargeback or showback models when tags are consistently applied across platforms and virtualization layers.
Architecture Overview
The idea is simple: collect cost information and usage reports (in FOCUS FinOps standard format where available) from multiple cloud providers such as OCI and AWS, store it in a unified OCI Object Storage bucket, normalize the relevant fields, and use Oracle Log Analytics to ingest the normalized data and makes it available for search and visualization, create dashboards and alarms.
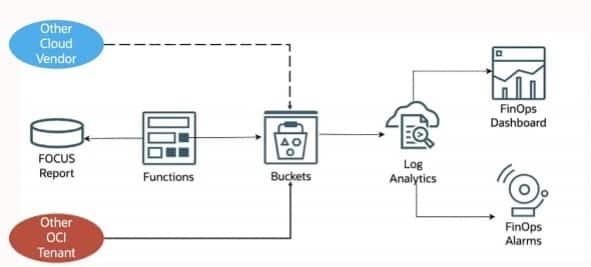
This pattern keeps the data flow flexible. New providers can be added by creating a new extraction and mapping process, while the dashboard layer continues to use the same normalized field names.
Why Add a Normalization Layer?
FOCUS is a FinOps standard, but standards evolve. Different providers may support different versions of the specification, optional fields, custom fields, or provider-specific extensions.
The normalization layer extracts only the fields needed for analysis and maps them into a stable internal schema. If the FOCUS FinOps standard format changes in the future, only the mapping logic needs to be updated. Historical dashboards and queries can continue to work against the normalized field names.
This makes the tool more flexible, robust, and protects the analytics layer from upstream schema changes.
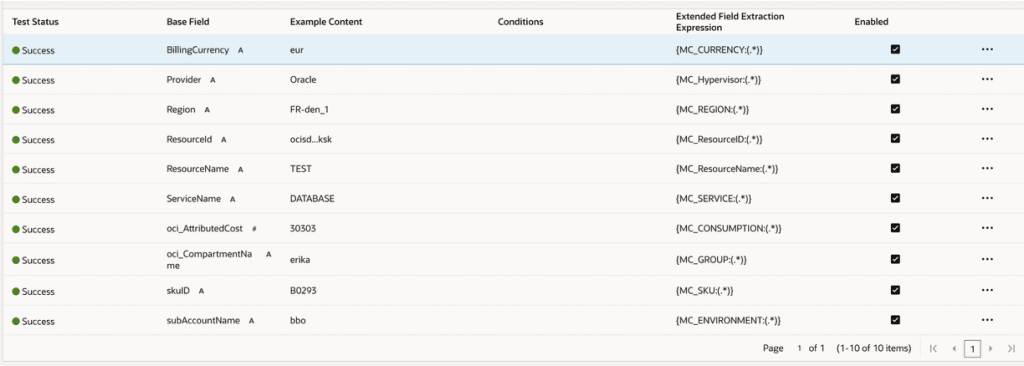
The current normalized model includes the following fields.
MC_CURRENCYidentifies the billing currency used for the cost value, such as USD or EUR.MC_HYPERVISORidentifies the cloud provider or platform source, such as OCI, AWS, Azure, VMware, or another hypervisor or platform.MC_REGIONidentifies the region where the resource usage occurred.MC_RESOURCE_IDstores the unique identifier of the consumed resource.MC_RESOURCE_NAMEstores the human-readable resource name, when available.MC_SERVICEidentifies the cloud service associated with the cost, such as Compute, Object Storage, Database, Networking, or Load Balancing.MC_CONSUMPTIONstores the normalized cost or consumption amount used for dashboarding and analysis.MC_GROUPidentifies the business group, compartment, account, cost center, project, or ownership grouping used for allocation.MC_SKUstores the SKU, product code, or metering dimension associated with the charge.MC_ENVIRONMENTidentifies the environment classification, such as production, test, development, staging, or disaster recovery.
Additional fields can be added later for billing period, usage quantity, usage unit, tags, application name, owner, charge category, and commitment discount details.
If you want to import the data from the follow providers follow these guides:
Useful Resources
FinOps Foundation FOCUS project
FOCUS specification
OCI Cost Reports documentation
OCI Log Analytics documentation
OCI Object Storage documentation