
When an application starts slowing down, one of the first questions is often whether the database needs more capacity.
But higher database time does not necessarily mean higher workload. The application might be executing more SQL, or the same SQL might simply have become less efficient because of a plan change or data growth. Those scenarios can look similar in a current snapshot, but they require very different responses.
Oracle Cloud Infrastructure (OCI) Ops Insights SQL Insights provides the historical SQL performance context needed to distinguish between them. By analyzing SQL performance trends over time, you can identify which databases and SQL statements need attention, determine when performance changed, correlate degradation with execution plan changes, and then drill into OCI Database Management capabilities such as SQL Tuning Advisor and SQL Plan Management for remediation.
This example follows one such investigation on an Autonomous AI Database. Three SQL statements were degrading. Two had experienced plan regressions on the same day. The third looked similar at first but showed a different performance pattern and required a different tuning approach.
Find the database that needs attention
Start with SQL Insights Fleet Analysis in Ops Insights
Rather than beginning with an individual SQL statement, Fleet Analysis provides a view across the databases being monitored and highlights databases with SQL performance issues such as degrading SQL and plan changes. For an intermittent issue where the exact start time is unknown, first select a sufficiently broad analysis period. SQL Insights retains SQL trend data for up to 25 months, allowing you to investigate changes that might have started days or weeks earlier.
In this example, a 30-day window makes the degradation visible.
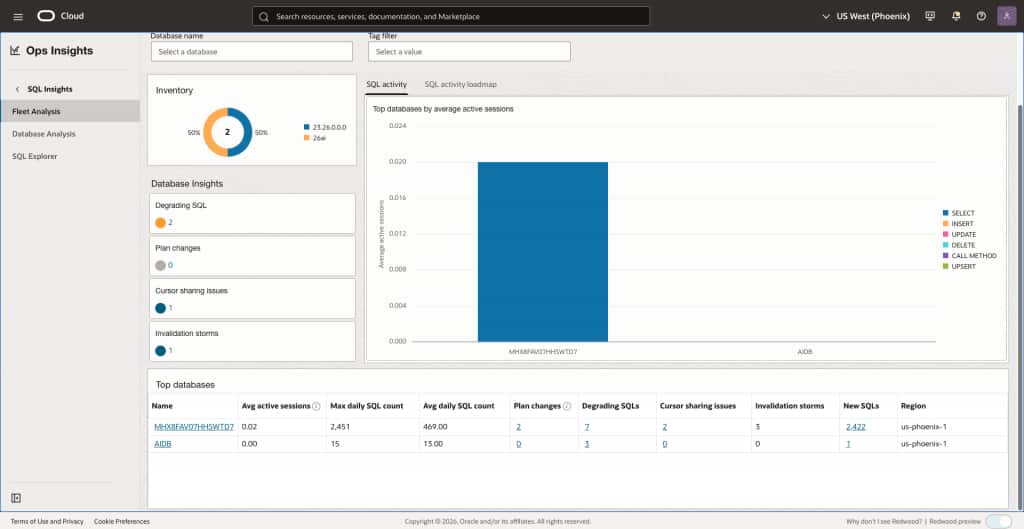
Drilling into the database provides its SQL activity and insight findings. The Degraded plan changes insight is active. Selecting it opens a ranked list of SQL statements whose performance degraded following a plan change.
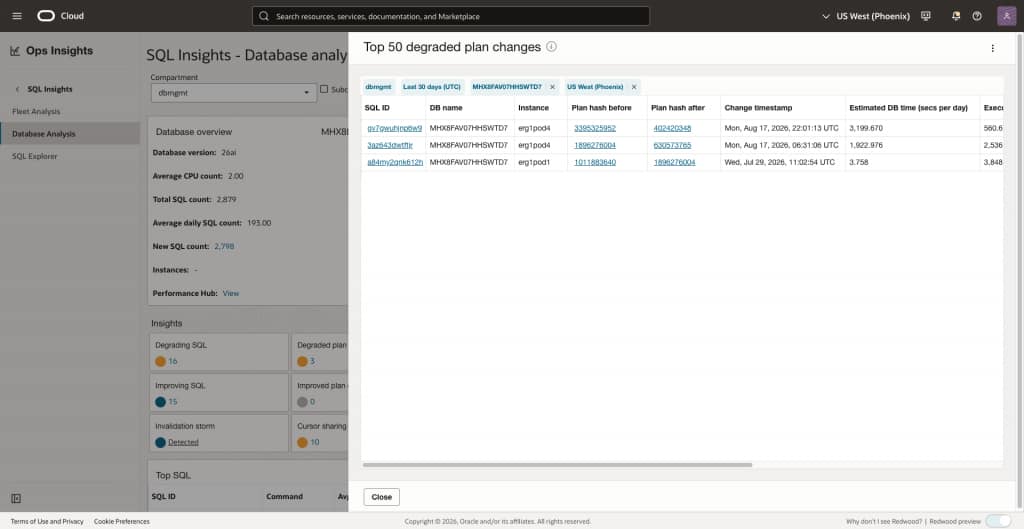
This single view already provides several useful clues. The first SQL has the greatest estimated impact and should be investigated first. The first two SQL statements changed plans within approximately 16 hours of each other, while the third changed almost three weeks earlier. SQL Insights also identifies both the previous and current plan hashes, giving us the context needed for the next step.
Determine whether SQL became slower or simply ran more often
SQL 1: A plan change increases latency
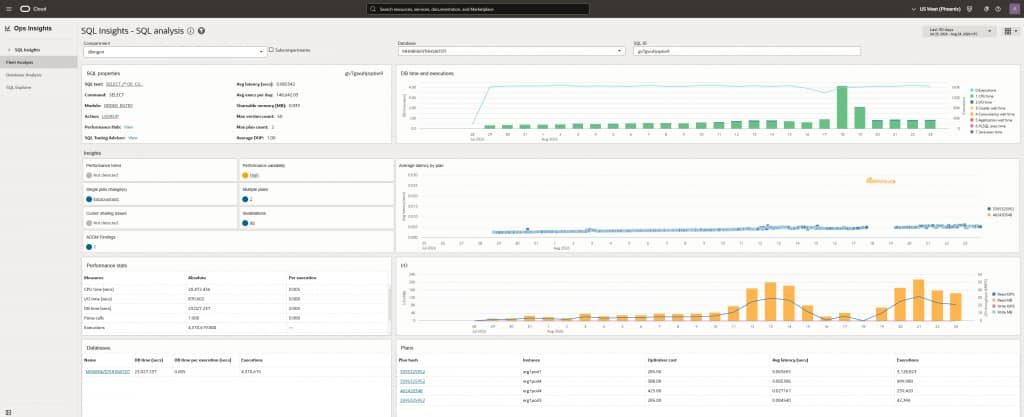
The first statement, with SQL ID gv7gwuhjnp6w9, has the greatest estimated impact. Its historical performance shows database time, executions, average latency, and execution plans.
Two views are particularly useful.
First, DB time and executions show whether total database time increased because the statement executed more frequently or because each execution became more expensive. Here, executions remain relatively flat while database time increases. The workload has not increased materially. The database is spending more time performing the same number of executions.
Second, Average latency by plan shows a stable low-latency population followed by the appearance of a second plan with significantly higher latency.
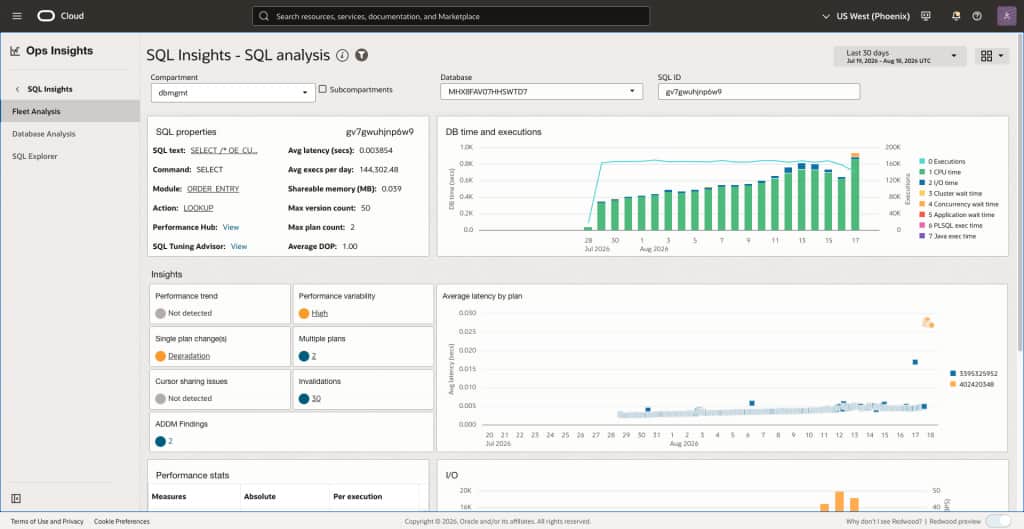
gv7gwuhjnp6w9, including the SQL properties, DB time/executions chart, and average latency by planExecutions remain flat while database time and latency increase after a new execution plan appears. That combination is strong evidence of a plan regression. The key point is that the SQL statement is not running more often. It has become more expensive per execution after the plan change.
SQL 2: The same pattern appears in another SQL
A second SQL statement shows a similar pattern on the same day.
Execution volume remains relatively stable, but a new execution plan appears and latency increases significantly.
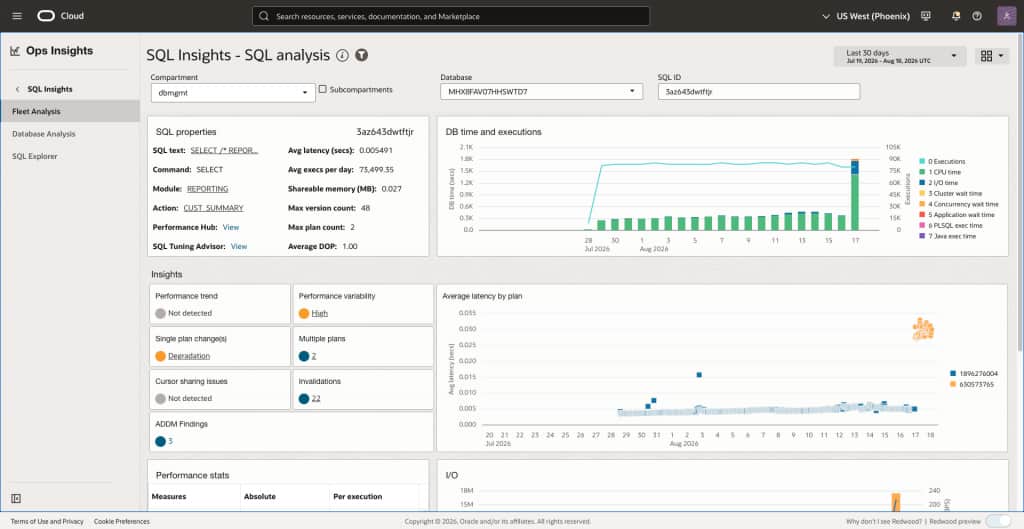
3az643dwtftjr, including the SQL properties, DB time/executions chart, and average latency by planAlthough both SQL statements degraded following plan changes, the optimizer did not make the same choice for each statement. The similar timing makes it useful to investigate whether the two regressions have a common cause.
But not every SQL statement with increasing DB time is experiencing a plan regression, as the next example shows.
SQL 3: Performance degrades without a plan regression
At first glance, the symptoms look similar.
Latency increases. Database time rises while executions remain relatively flat. SQL Insights identifies the statement as degrading.
But the plan history tells a different story.
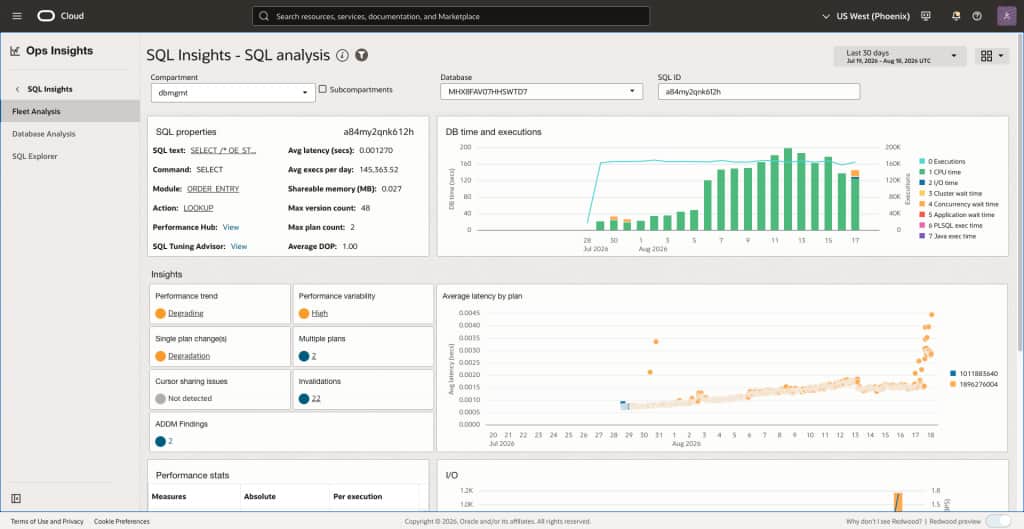
The plan change occurred well before the other two regressions, and the latency-by-plan visualization does not show a new plan appearing when performance starts worsening.
A new plan population appearing together with a latency increase is a strong indication to investigate a plan regression. A single plan becoming progressively slower suggests that the plan itself might not have changed; instead, the amount of work behind each execution may have changed.
For this statement, degradation occurs because each execution must process more qualifying data as the table grows. The SQL statements therefore look similar at the database-time level, but the underlying causes are different.
Move from historical diagnosis to SQL tuning
Once SQL Insights establishes what changed, the SQL statement properties page provides access to additional Database Management capabilities, including SQL Tuning Advisor. The SQL ID and analysis context are carried into the tuning workflow, avoiding the need to manually copy the SQL identifier and recreate the investigation context.
Running SQL Tuning Advisor for the three statements produces an interesting result. For the two SQL statements with clear plan regressions, the advisor does not identify a new tuning recommendation. Instead, it indicates that alternative execution plans exist and that a SQL plan baseline can be used when a known alternative performs better.
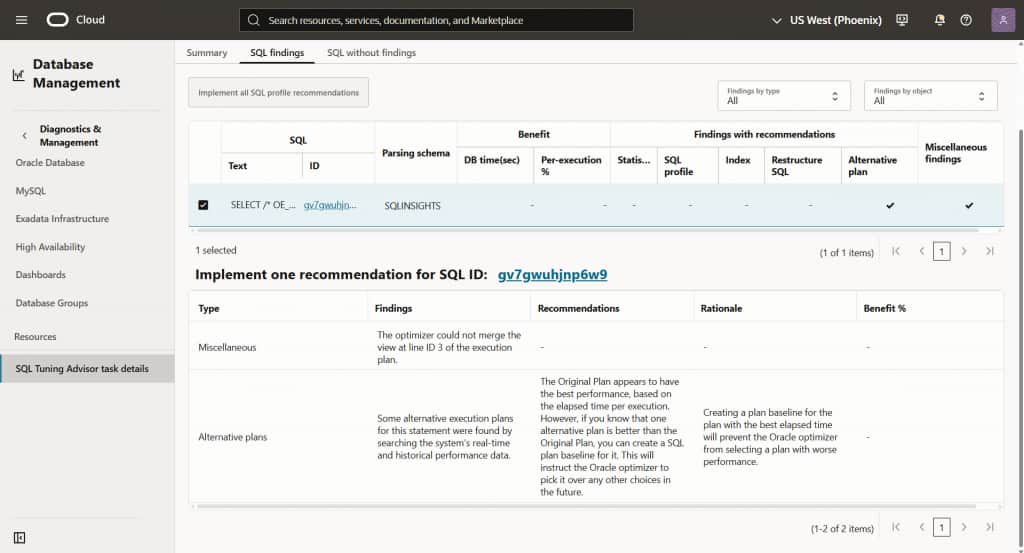
For the third statement, where the execution plan itself was not the cause of the degradation, SQL Tuning Advisor identifies significant tuning opportunities:
- a SQL profile with an estimated benefit of approximately 98.77%, and
- an index on
(customer_id, status_id)with an estimated benefit of approximately 99.02%.
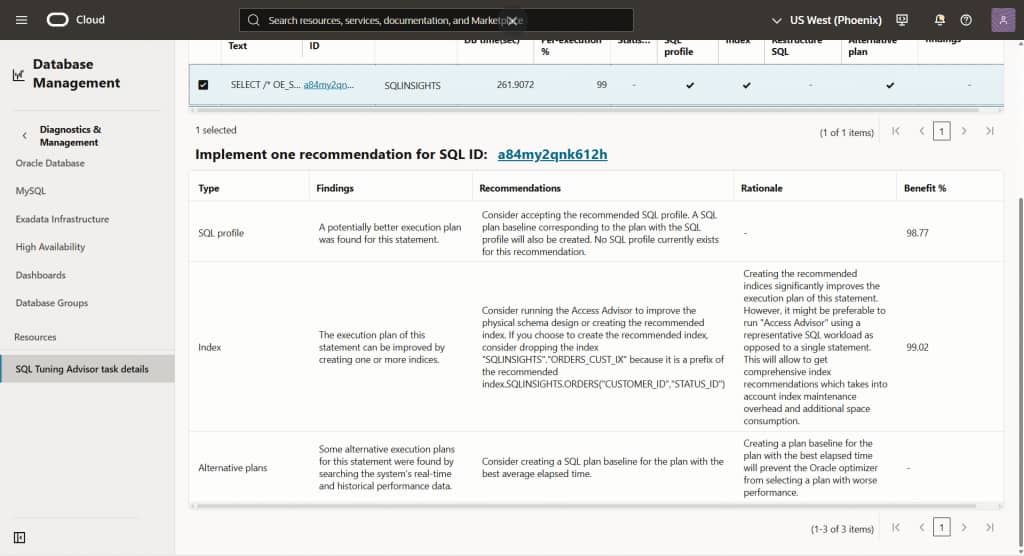
This demonstrates how the capabilities complement one another.
SQL Insights answers: What changed? When did it change? Which plan was performing better?
SQL Tuning Advisor answers: Can the SQL statement be made more efficient?
For the third SQL statement, conventional tuning is exactly what is needed.
For the first two, historical knowledge is more important: SQL Insights already established that a previous execution plan performed substantially better.
That leads to SQL Plan Management (SPM).
Automatic SQL Plan Management restores the better plan
SPM provides another useful piece of the investigation.
For the regressed SQL statements, the plan history shows both the previously better-performing plan and the newer plan that caused the degradation. More importantly, Automatic SPM Evolve Advisor is enabled.
Automatic SPM evaluates alternative plans and verifies their performance before evolving better-performing plans into the SQL plan baseline. In this case, the previously better plan was available to SPM and the SQL subsequently returned to that plan automatically.
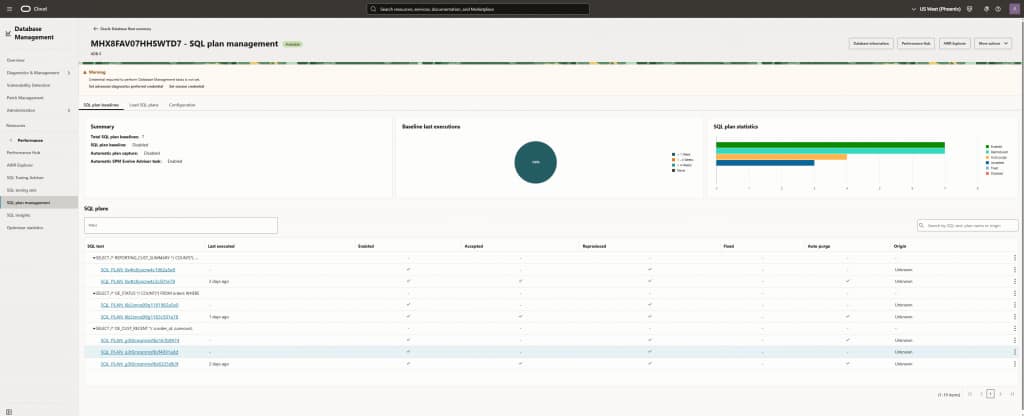
Automatic SPM was enabled, and the plan history shows that the previously better-performing plan was subsequently re-enabled.
This complements what SQL Insights shows in the performance history. SQL Insights makes the regression and the subsequent return to the lower latency plan visible over time, while SQL Plan Management explains how plan stability was restored.
Summary
Ops Insights and Database Management are most effective when used together. SQL Insights provides the historical context to identify which SQL statements are degrading, when performance changed, and how execution plans contributed to that change. Database Management then provides the deeper tuning and plan-management capabilities needed to act on those findings, including SQL Tuning Advisor and Automatic SQL Plan Management.
Together, they provide a connected workflow from detection and diagnosis to remediation and verification. Customers should use both capabilities as complementary parts of the SQL performance management experience rather than treating them as separate tools.