
Database administration encompasses more than monitoring the performance of individual databases. As an admin, they also need to understand the health of a deployment; oftentimes, requiring custom collections or scripts to review on a daily basis. These details require knowing more about their deployments, including which application clients connect to the database, how SQL executions behave, whether application- or environment-specific conditions require attention, and if GoldenGate replication is keeping data current. Alongside monitoring, teams need a consistent way to carry out routine operations across their databases.
New capabilities in OCI Ops Insights and Database Management bring these details and tasks into the monitoring and management workflows database teams already use. Database client inventory, SQL Monitoring reports in SQL Insights, enhanced Metric Extensions, reusable job templates, and GoldenGate fleet monitoring help administrators investigate performance, plan client upgrades, standardize operations, and identify issues across their database environments deployed in the cloud or on-premises.
With these capabilities, you can:
- Understand which client drivers, versions, and hosts connect to your database fleet.
- Investigate individual SQL executions through SQL Monitoring reports in SQL Insights.
- Collect application-specific metrics using scheduled SQL queries.
- Reuse job templates and schedule database operations across individual databases or Database Groups.
- Review GoldenGate replication health and lag from fleet views.
Understand the Clients Connecting to Your Database Fleet
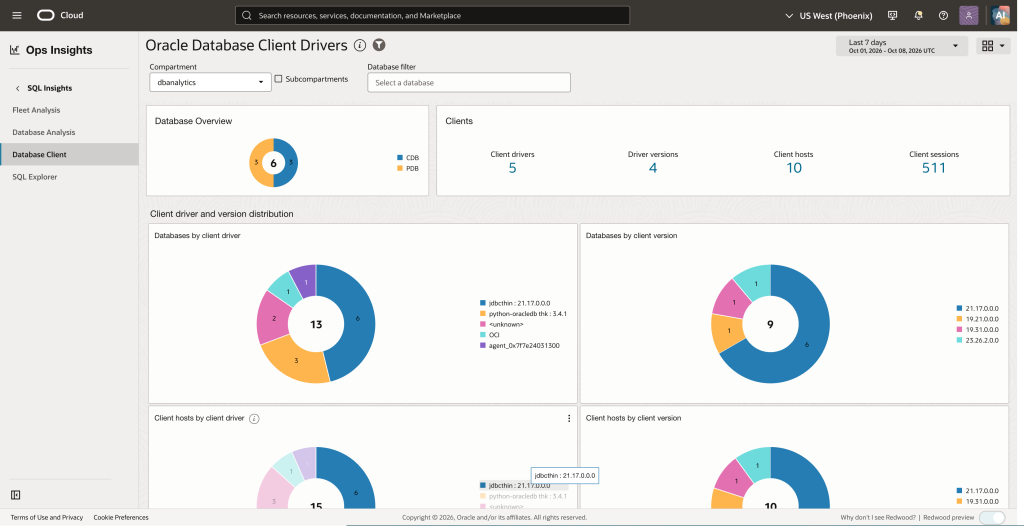
Before upgrading a database, administrators need to understand the applications and client software that connect to it. Gathering this information database by database can be time-consuming, especially when applications run across many hosts and use different drivers or client versions.
Database client inventory in Ops Insights brings client drivers, versions, and associated Oracle Client Libraries together with target databases, application hosts, operating-system users, and session counts. Fleet summaries and filtered drilldowns help administrators follow a client version to the databases and hosts where it was observed.
This visibility supports several common operational tasks:
- Plan database upgrades: Identify the client components connecting to databases in the upgrade scope and coordinate compatibility reviews with application owners.
- Prioritize older client software for review: Locate affected hosts and databases, then use host and session counts to understand the observed footprint of a version.
- Standardize application environments: Compare drivers and libraries across hosts to identify inconsistent versions and plan coordinated updates.
- Investigate compatibility issues: Narrow the inventory to the client version, host, and target database involved in a reported connection problem.
For example, an application team preparing a release may believe every application server uses the same client software. Reviewing the inventory could reveal an older version still connecting from one host. The DBA can identify the database involved and give the application owner a specific starting point for investigation before the release proceeds.
The inventory represents collected snapshots, not every connection between collections. It helps teams scope their investigation; compatibility validation remains part of their upgrade and remediation process.
Investigate SQL Execution Performance from SQL Insights
Identifying a SQL statement that requires attention is often the first step in a performance investigation. Administrators then need execution-level detail to understand how the statement behaved and where to focus their analysis.
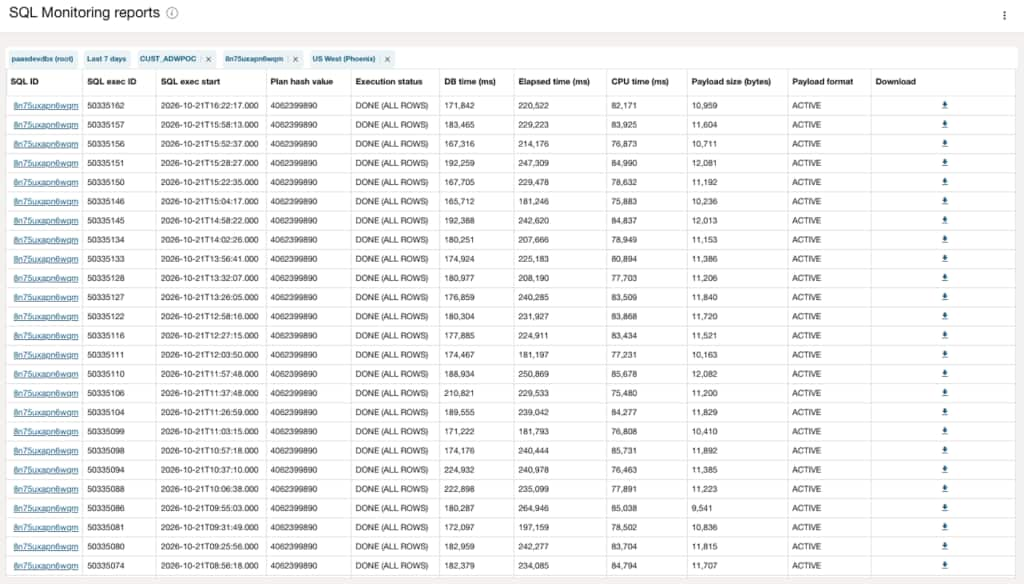
SQL Insights provides direct access to SQL Monitoring Active Reports, connecting fleet and database analysis with individual SQL execution details. These reports are accessible from the Top databases table in Fleet analysis, the Top SQL table in Database analysis, and the SQL monitoring reports link in the SQL properties widget in SQL analysis.
Administrators can filter the available reports, open SQL analysis for a selected SQL ID, and download a SQL Monitoring Active Report in HTML format for further investigation or sharing with another database specialist. Keeping this workflow within SQL Insights reduces the effort required to move from identifying a statement of interest to examining its execution performance.
For example, after identifying a SQL statement associated with a performance concern, a DBA can review its available SQL Monitoring reports and download the relevant report for further investigation. Keeping this path within SQL Insights reduces the effort required to locate supporting execution details.

Extend Database Monitoring with Custom Metrics
Standard database metrics provide essential visibility into health and performance, but they may not show whether an application is building a backlog or waiting on work. Template-based Metric Extensions let teams turn read-only SQL query results into custom metrics in OCI Monitoring, so they can track application conditions alongside database health.
A Metric Extension Template defines a reusable query, bind variables, metric and dimension names, a Monitoring namespace, an optional resource group, and a recommended collection schedule. The query returns numeric metrics and dimensions with explicit aliases: use the metric_ prefix for numeric values and dimension_ for dimensions. Database Management adds the resourceId and resourceName dimensions automatically. Templates work with database types supported by Database Management, including CDBs, PDBs, and non-CDBs, whether they are monitored through a Management Agent or a Database Management Private Endpoint, greatly simplifying the collection requirements for cloud databases and allowing quick integration into your database fleet.
Teams can test a template against a Managed Database to preview results without sending metrics to OCI Monitoring. After validation, they publish the template and create a Metric Extension for one or more Managed Databases or a Database Group. Collection schedules and other settings can be customized per database to balance monitoring needs with collection overhead.
Once collection begins, administrators can review collection status and recent runs from the database or group view, then find the published metrics in OCI Monitoring and create alarms for thresholds that need attention. For example, a query can count records waiting in an application queue and return the queue name as a dimension. An alarm on that count can help the operations team spot a growing backlog before it affects users. Another use case would be identifying or monitoring the growth of database objects over time. With a query against DBA_OBJECTS, summing the size of segments per object and passing the object name as the dimension, you can track the growth of objects over time.
The template-based experience replaces legacy Metric Extensions, which support only External Databases. Existing legacy definitions are not converted automatically, so teams using them should plan their migration. You can learn more about migrating in this Knowledge Article.
Monitor GoldenGate Replication Health Across Your Database Fleet
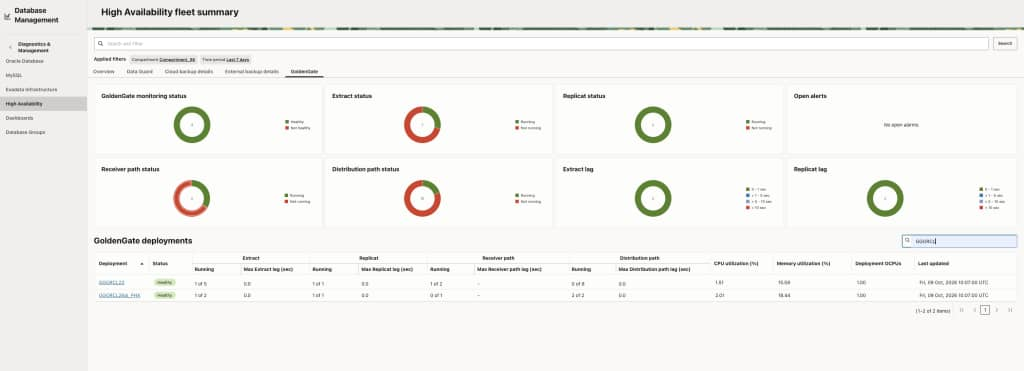
Replication health is an important part of understanding database availability and consistency. When lag increases or a replication process becomes unhealthy, administrators need to identify the affected databases and determine where to begin their investigation.
GoldenGate monitoring in Database Management brings replication health and lag into the HA Fleet console. Fleet summaries help administrators identify databases with GoldenGate-related issues and move directly to the GoldenGate deployment which requires attention.
Bringing replication signals into the fleet experience helps teams assess GoldenGate health alongside their broader database operations and reduces the effort required to connect a replication issue with its database impact.
Simplify Database Operations with Reusable Job Templates
Database administrators regularly perform the same operational tasks across multiple databases. Reentering SQL commands and configuring each execution takes time and can introduce inconsistencies. Having custom scripts require constant monitoring and validation of script executions as well as fixing broken scripts after database upgrades or migrations. Reusable job templates help teams standardize these tasks while allowing administrators to supply the values needed for each execution.
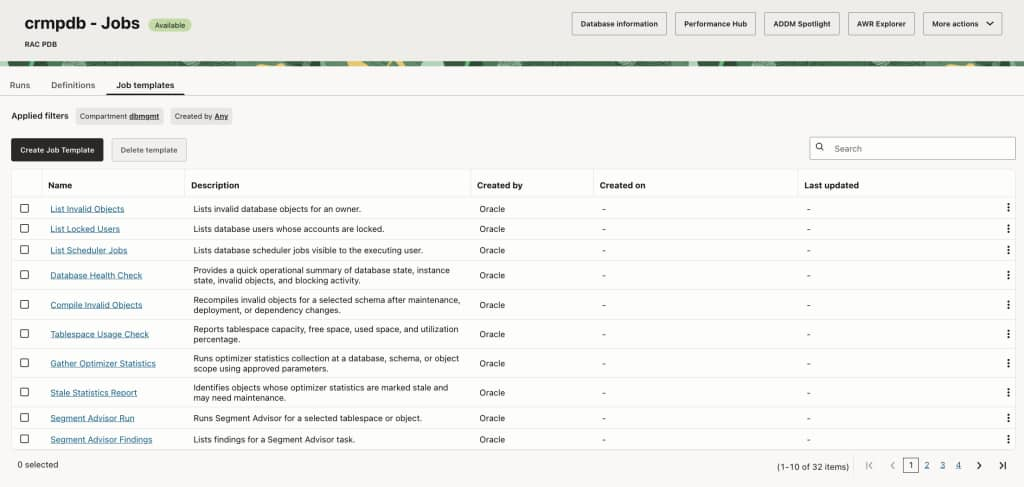
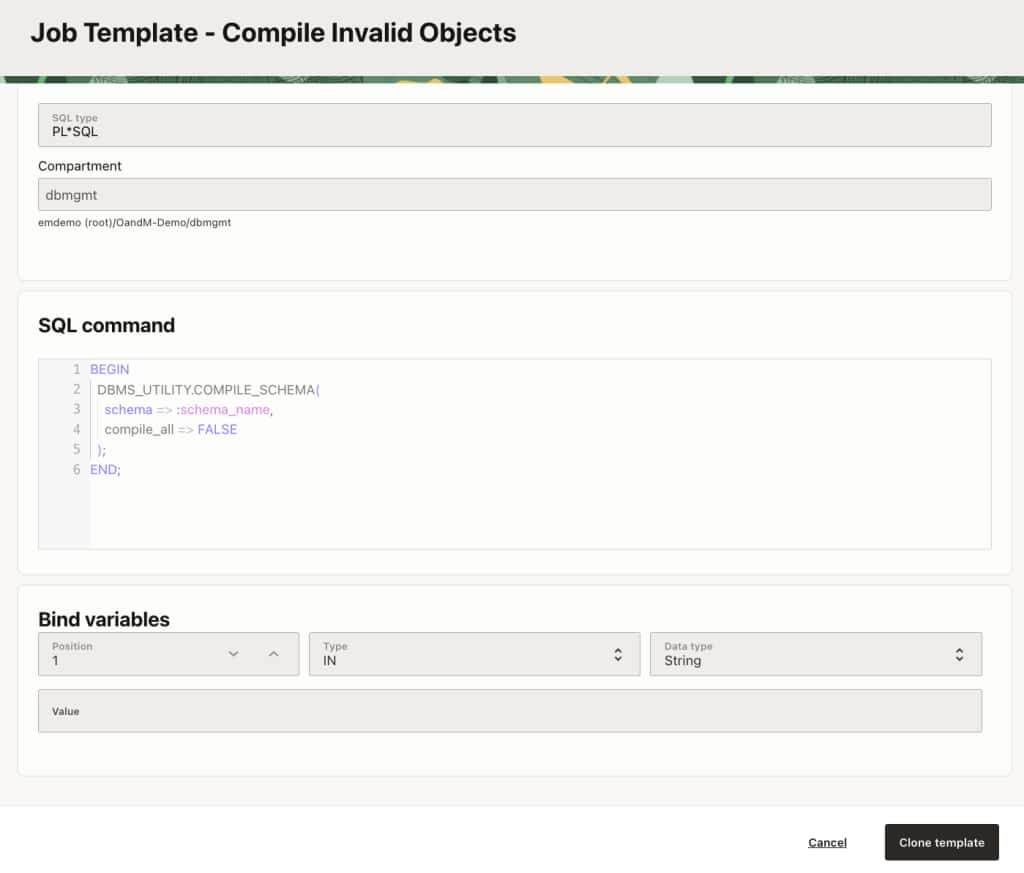
OCI Database Management extends its Jobs capabilities with Oracle-defined and user-defined job templates. Oracle-defined templates provide a starting point for common database tasks. Administrators can create their own templates or clone an existing template and adapt it to their operational requirements.
Each template contains a SQL command and its input bind variable definitions, including optional default values. When creating a job from a template, administrators provide the input values and configure execution details while the template’s SQL command and bind variable definitions remain fixed. This helps teams reuse a consistent operation across different tasks and database environments.
Jobs run asynchronously against a single Managed Database or all Managed Databases in a Database Group. Administrators can run a job immediately, schedule it for a later time, or configure a repeating schedule with an optional end date. Jobs support Query, DML, DDL, and PL/SQL operations, with Query job results stored in OCI Object Storage for persistent, secure, and long-term retention.
The Jobs experience brings these activities together through three tabs:
- Definitions: Create jobs and review active job definitions.
- Runs: Monitor job runs and individual database executions.
- Job templates: Browse Oracle-defined templates, create and manage user-defined templates, and view associated jobs.
For example, a team can define a reusable SQL query with input parameters, create a scheduled job for a Database Group, and review execution results for each database. The same template can be used again with different input values without rebuilding the SQL command or bind variable definitions.
By combining reusable templates, flexible scheduling, and execution monitoring, Database Management helps teams reduce repetitive setup and apply database operations more consistently across their fleets.
Get Started
Use Ops Insights to understand the clients connecting to your databases and investigate SQL execution performance through SQL Insights. In Database Management, extend monitoring with application-specific metrics, use reusable templates to schedule database jobs, and review GoldenGate health from HA Fleet and managed database views.
Together, these capabilities help database teams move from understanding their environment to investigating issues and carrying out consistent operational tasks.