

Oracle Enterprise Manager (EM) dashboards let you build custom monitoring solutions for your stakeholders. For example, a custom Database Infrastructure for Finance dashboard can show the health of the databases and infrastructure that host your financial applications. These dashboards draw on the rich management data in the EM repository.
Starting with Enterprise Manager 24ai RU5 (24.1.0.5), you can now build dashboards that query and display data from target databases. If a business application’s data is stored in a database monitored by EM, you can use that data to build a dashboard focused on the application.
In this blog, we’ll walk through a simple example of a business application dashboard built from application data in a monitored target database.
Overview of the Orders Processing dashboard
Our example of a business application dashboard is the Orders Processing dashboard. This dashboard shows the volume and status of orders handled by our example Order Processing business application. The data shown combines direct database query results with metrics collected by a metric extension. The metric extension periodically queries the database for order information and stores the resulting metric data in the EM repository.
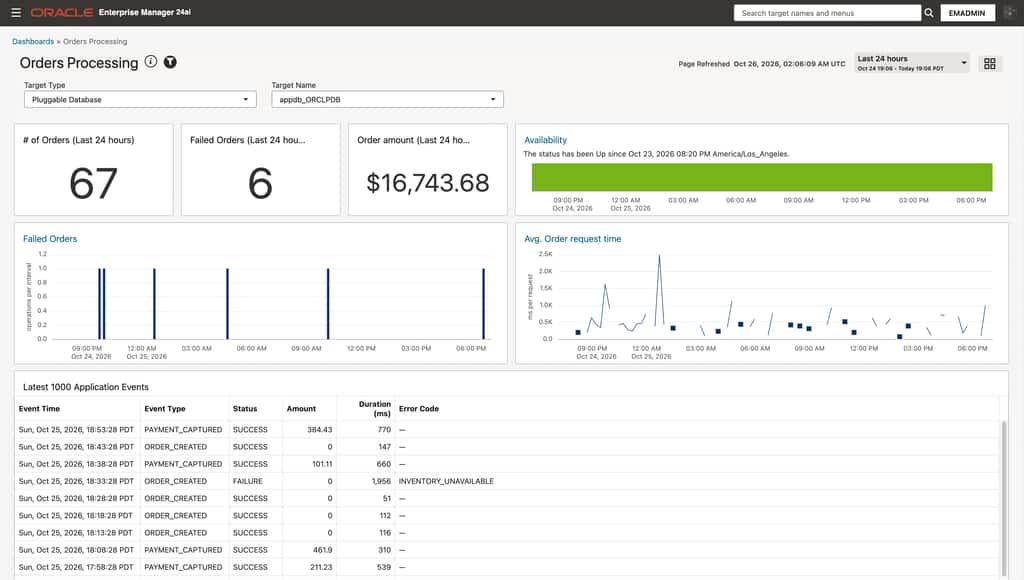
Each data element in the dashboard is called a ‘widget’. The dashboard contains these widgets:
- Widgets based on target database queries:
- # of Orders (Last 24 hours), Failed Orders (Last 24 hours), and Order amount (Last 24 hours) show successful orders, failed orders, and successful payment amounts for the last 24 hours.
- Latest 1000 Application Events shows up to 1,000 of the most recent events from the sample application table in the selected pluggable database (PDB).
- Widgets based on a metric extension:
- Failed Orders and Avg. Order request time show failure counts and average order duration collected by the sample metric extension.
- Availability widget: Availability shows the monitored PDB’s status over time.
Building the Orders Processing dashboard
The data shown in the dashboard is based on some generated sample data that models an order processing application. This blog will walk you through the steps to generate the sample data as well as to build the dashboard itself.
Here are the high level steps to build the dashboard:
- Set up the prerequisites
- Prepare application data
- Set up the database credentials
- Import and deploy the metric extension
- Import the dashboard
The References and Downloads section below has a link to download the dashboard and other artifacts.
1 Set up the prerequisites
The first step is to make sure the following prerequisites are in place:
- A non-production Pluggable Database (PDB) that will contain the application data. This database should be monitored in EM by Management Agent 13.5.4.0 or later.
- A database user in the PDB with the permissions needed to create and populate the sample application data:
- connect (
CREATE SESSION) - create the sample table (
CREATE TABLE) - create the event-generator job (
CREATE JOB)
This example uses a database user namedAPP_DEMO; you can use your own database user when running the SQL and configuring both EM credentials.
- connect (
- An EM Super Administrator to create the monitoring credential set. This is a one-time setup; skip it if the set already exists.
- An EM user with the privileges documented below. This example uses an EM user named
EMADMIN; you can use your own EM user when logging in to EM console and running EM CLI commands.
| EM Privilege Type | Resource Type | EM Privilege Name |
|---|---|---|
| Resource Privilege | Dashboard | CREATE_ANY_DASHBOARD (Create Dashboards) |
| Resource Privilege | Saved Searches | CREATE_SAVED_SEARCHES (Create Saved Searches) |
| Resource Privilege | Named Credential | CREATE_CREDENTIAL (Create new Named Credential) |
| Resource Privilege | Metric Extensions | CREATE_MEXT (Create Metric Extension) |
| Target Instance Privilege | N/A | Add these privileges to the PDB target:VIEW_TARGET (View)CONNECT_TARGET (Connect Target) RUN_ANY_SQL (Run any sql on Database) CONFIGURE_TARGET (Configure Target) MANAGE_TARGET_METRICS (Manage Target Metrics) |
Target Instance Privilege | N/A | Add this privilege to the Agent monitoring the PDB. This is required for deploying the metric extension:VIEW_TARGET (View) |
2 Prepare application data
- Download setup-application-demo.sql
- Connect to your target PDB with your database user (
APP_DEMOin this example). - Run setup-application-demo.sql once in a fresh schema.
The script creates the APP_EVENT table and starts APP_EVENT_GENERATOR_JOB to generate order and payment events. The job runs every five minutes and generates about six application events per hour. Allow several runs for the data to appear.
3 Set up the database credentials
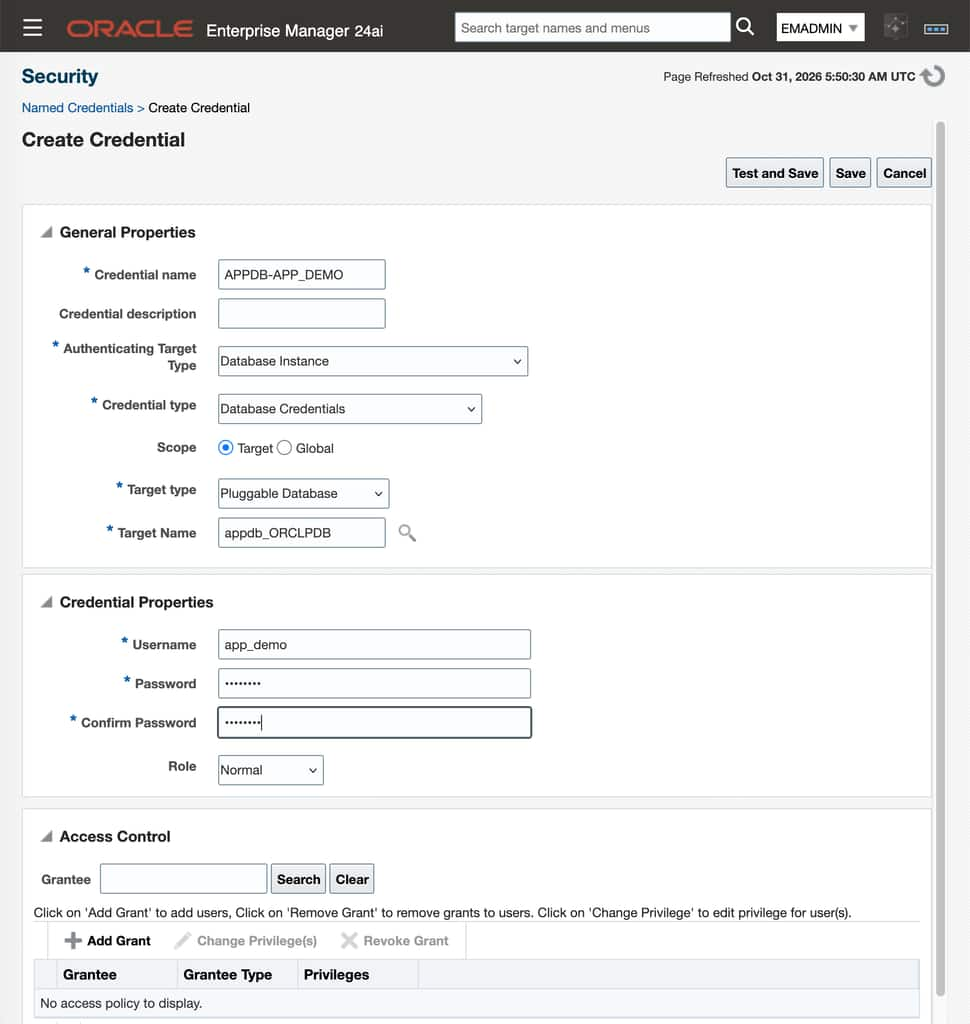
In this step you will create a named credential for direct SQL widgets (i.e. widgets based on target database queries) and a monitoring credential for the metric extension. For both, use the database username and password for the schema containing the APP_EVENT table (APP_DEMO in this example).
Named Credential for direct SQL widgets
- Login to EM with your EM user (
EMADMINin this example). - Open Setup → Security → Named Credentials → Create.
- Enter these settings and the schema password, then select Test and Save.
Monitoring Credential (AppMetricCreds) for the metric extension
- Before creating a monitoring credential, first use EMCLI to create a monitoring credential set using an EM Super Administrator account.
In the EMCLI example below, replace<SUPER_ADMIN>with your Super Administrator username. Skip this step if the monitoring credential set already exists.
emcli login -username="<SUPER_ADMIN>"
emcli sync
emcli create_credential_set \
  -set_name=AppMetricCreds \
  -target_type=oracle_pdb \
  -supported_cred_types=DBCreds \
-monitoring- Login to EMCLI with the same EM user used to create the named credential (
EMADMINin this example) and set the monitoring credential on your PDB. Replace<EMADMIN>with that EM username and the remaining placeholders with the PDB’s EM target name and the database schema’s username and password.
emcli logout
emcli login -username="<EMADMIN>"
emcli sync
emcli set_monitoring_credential \
  -target_name="<PDB_TARGET_NAME>" \
  -target_type=oracle_pdb \
  -set_name=AppMetricCreds \
  -cred_type=DBCreds \
  -attributes='DBUserName:<DB_USERNAME>;DBPassword:<DB_PASSWORD>;DBRole:normal' \
  -test
4 Import and deploy the metric extension
- Sign in to EM with your EM user (
EMADMINin this example). - Open Enterprise → Monitoring → Metric Extensions and import MEA_ME$Orders.zip.
- Select the imported Orders metric extension and choose Actions → Save as Deployable Draft.
- Then choose Actions → Publish Metric Extension.
- Select Deploy to Targets, choose your PDB, and confirm deployment succeeds.
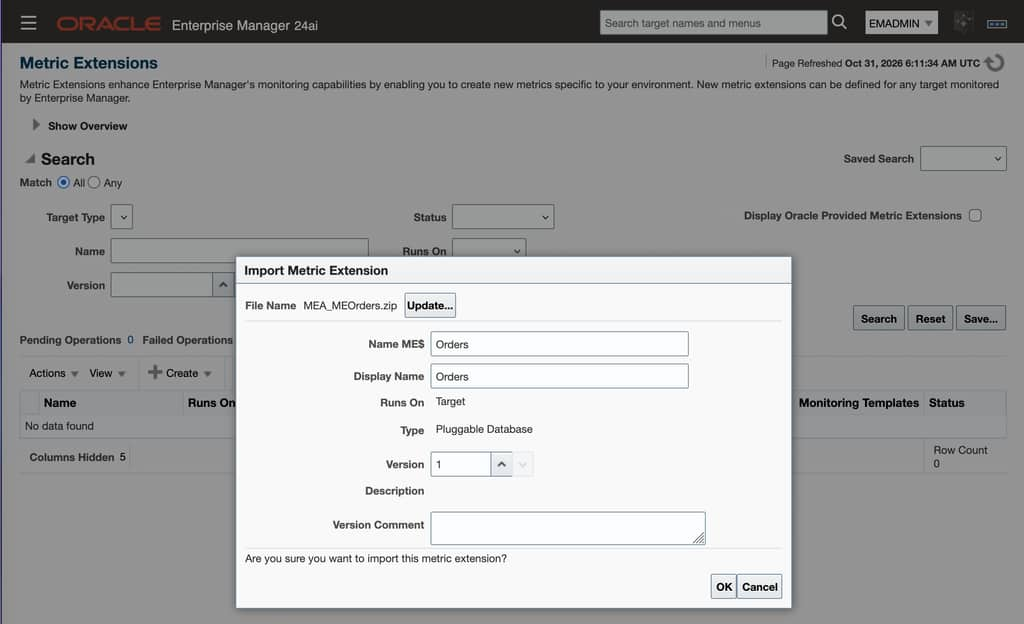
Every 15 minutes, the extension collects order count, failure count, and average duration for ORDER_CREATED events in the preceding 15 minutes.
5 Import the dashboard
- Login to EM with your EM user (
EMADMINin this example). - Open Enterprise → Dashboards → Import dashboards, select Orders Processing.json, and confirm the import.
- Open Orders Processing dashboard.
- Choose Target Type = Pluggable Database and your Target Name.
- Only if your credential name or owner differs from
APPDB-APP_DEMO/EMADMIN: choose Actions → Edit and select your Database Credential in each of the three SQL summary tiles and the events table. Keep Target Type and Target Name linked to the dashboard filters, then save.
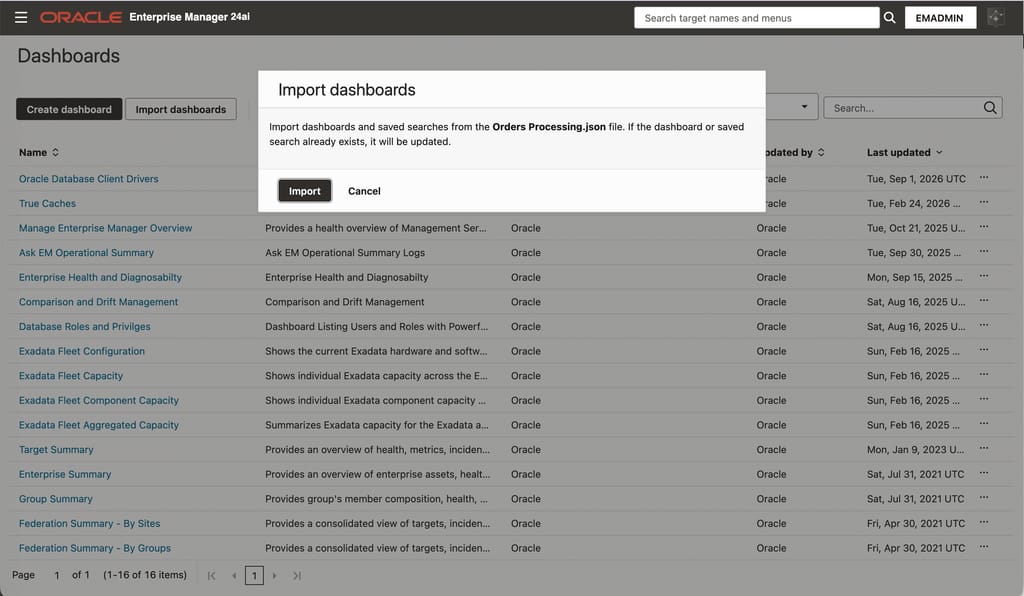
Your dashboard is now ready, as shown in the screenshot above. The metric charts will populate as the metric extension collects data. You can customize the dashboard by adding existing widgets or creating your own. Add filters, change visualizations, and rearrange or resize widgets to highlight the information most relevant to your application. See the Enterprise Manager dashboard documentation for instructions. You can also share the dashboard with other EM dashboard users.
Putting Enterprise Manager Dashboards to work for your Business Applications
Use this example as a starting point for bringing application data from a monitored target database into Enterprise Manager dashboards. You can tailor each dashboard to the information your application teams need. Take a fresh look at how Enterprise Manager dashboards can help application teams monitor the business activity that matters to them.
References and Downloads
Enterprise Manager Documentation
- Using Dashboards
- Configuring and Using Target Credentials
- EMCLI create_credential_set
- EMCLI set_monitoring_credential
- Metric Extension Lifecycle
Order Processing dashboard artifacts for download
- MEA_ME$Orders
Sample metric extension used in this example. You will upload this zip file in EM Console to create the sample metric extension. - Orders Processing.json
Sample dashboard used in this example. Download and unzip to obtain the JSON file for sample dashboard used for displaying data from a target database and metric extension. - setup-application-demo.sql
Sample script used in this example. Download and unzip to obtain the sql script for creating the sample table and recurring event generator.