Kubernetes is the standard for container orchestration as it solves many problems, like distributing workloads across machines, achieving fault tolerance, and re-scheduling workloads when problems occur. While speeding up development processes and reducing complexity does make the lives of Kubernetes operators easier, the inherent abstraction and automation can lead to new types of errors that are difficult to find, troubleshoot, and prevent. With so many moving pieces, getting to the bottom of an issue in large distributed systems is challenging. Whereas a traditional monolithic environment one might need to search through a log or two, with microservices one must search through many logs. Shifting through logs from so many services is time-consuming and often not indicative of the true root cause of the issue.
In this blog, we review how to monitor a Kubernetes environment using OCI Observability and Management (O&M) platform services. OCI Log Analytics monitors the infrastructure logs of the Oracle Container Engine for Kubernetes (OKE) environment and Application Performance Monitoring (APM) monitors the applications deployed on a Kubernetes environment.
Prerequisites to deploy an OKE environment with a Weblogic application
- Create or use a valid Oracle Cloud Infrastructure (OCI) account with the initial configuration already completed, such as existing compartments, API keys etc.
- Create and publish an OKE environment by referring to this link.
- Deploy a sample application on the OKE cluster. Refer to this link for the steps.
Enhance the OKE Infrastructure monitoring using Log Analytics
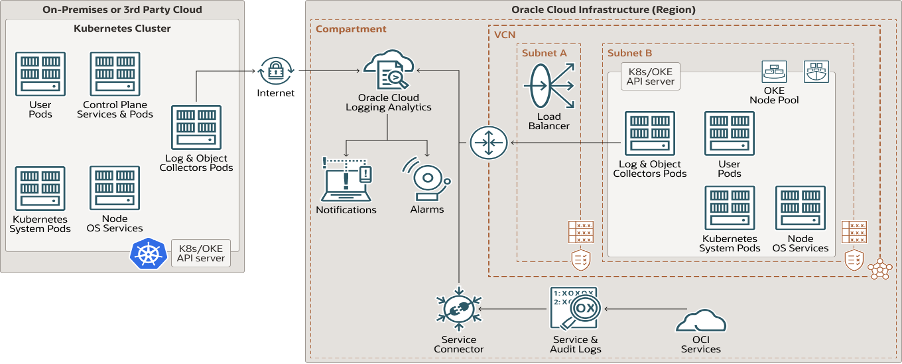
OCI Log Analytics is a cloud solution that will index, enrich, aggregate, explore, search, analyze, correlate, visualize, and monitor all log data from the applications and system infrastructure in the cloud or on-premises. It provides rich insights by analyzing the collected logs.
The Kubernetes environment is built using FluentD, an open-source data collector software, to collect infrastructure logs from the source. OCI Log Analytics collects various Kubernetes cluster logs like Kube Proxy, Kube Flannel, Kubelet, CoreDNS, CSI Node Driver, DNS Autoscaler, Cluster Autoscaler, Proxymux Client along with Linux logs such as Syslog, Secure, Cron, Mail, Audit, Ksplice Uptrack, and Yum logs. Be sure to complete the prerequisites for configuring OCI Log Analytics.
Once the OKE environment is ready, navigate to the OCI Menu > Developer Services > Kubernetes Cluster and explore the cluster and node details. Access the cluster by setting up the keys. Explore the OKE and application logs ingested and see how the OCI Log Analytics service is used to analyze the OKE infrastructure logs.
- Select Observability and Management from the OCI Console navigation menu, then select Log Analytics > Log Explorer. Make sure you are in the correct region and compartment.
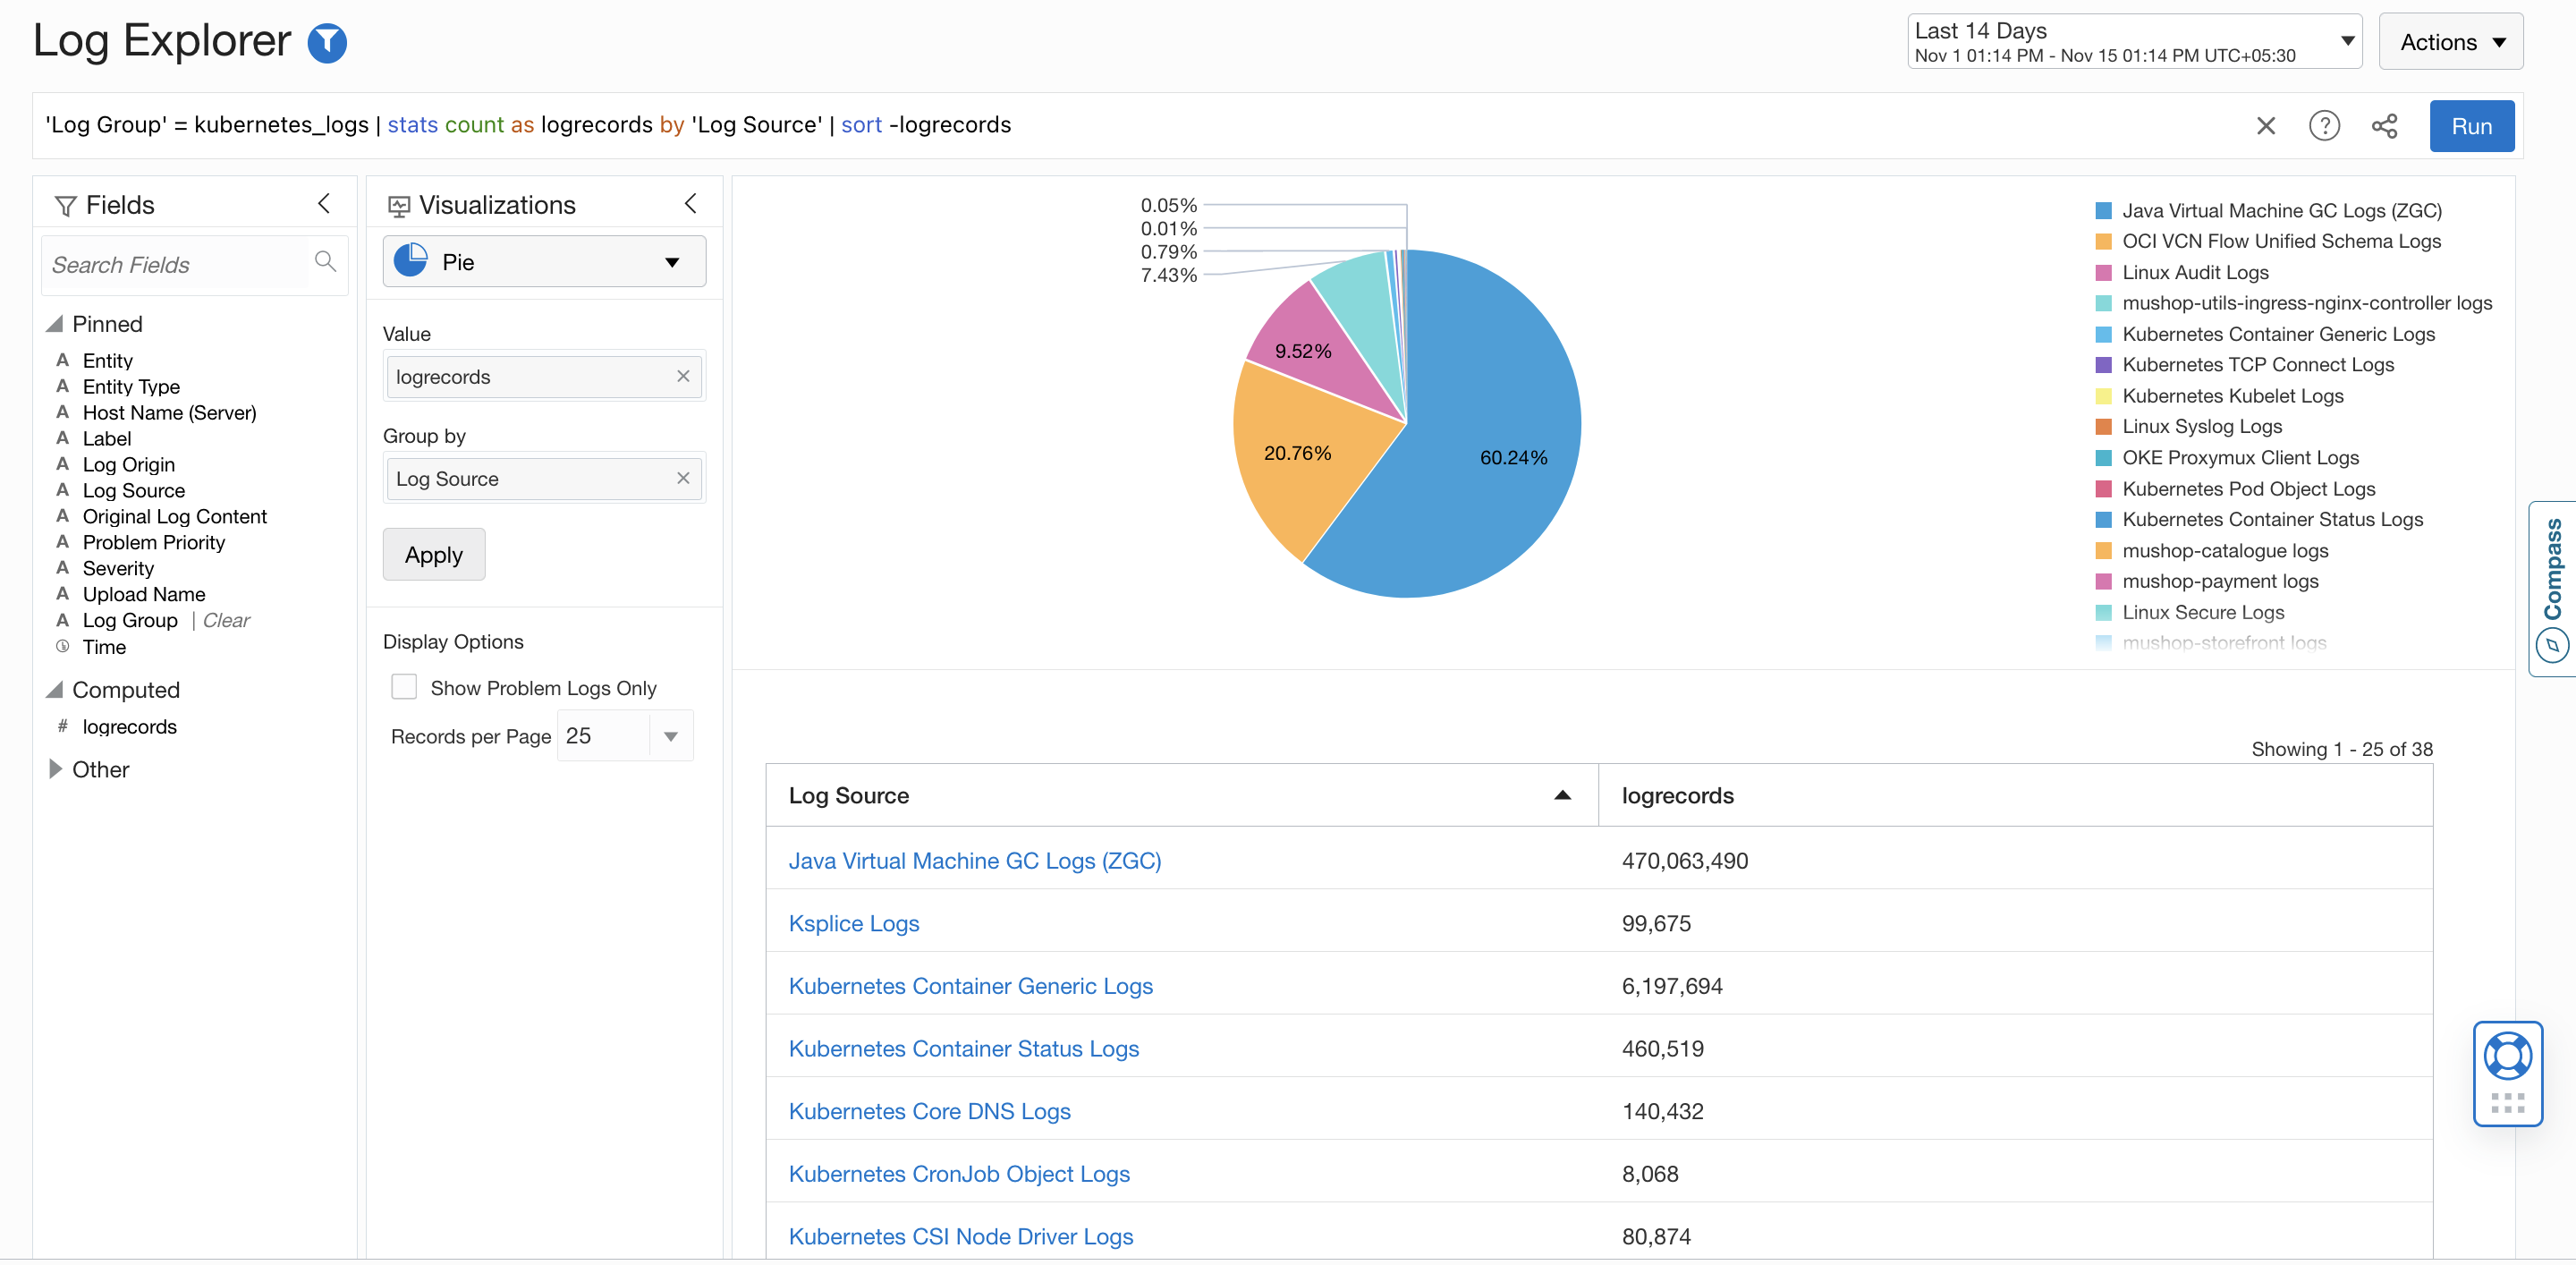
- View the logs configured for the OKE environment built using the docker image containing FluentD.
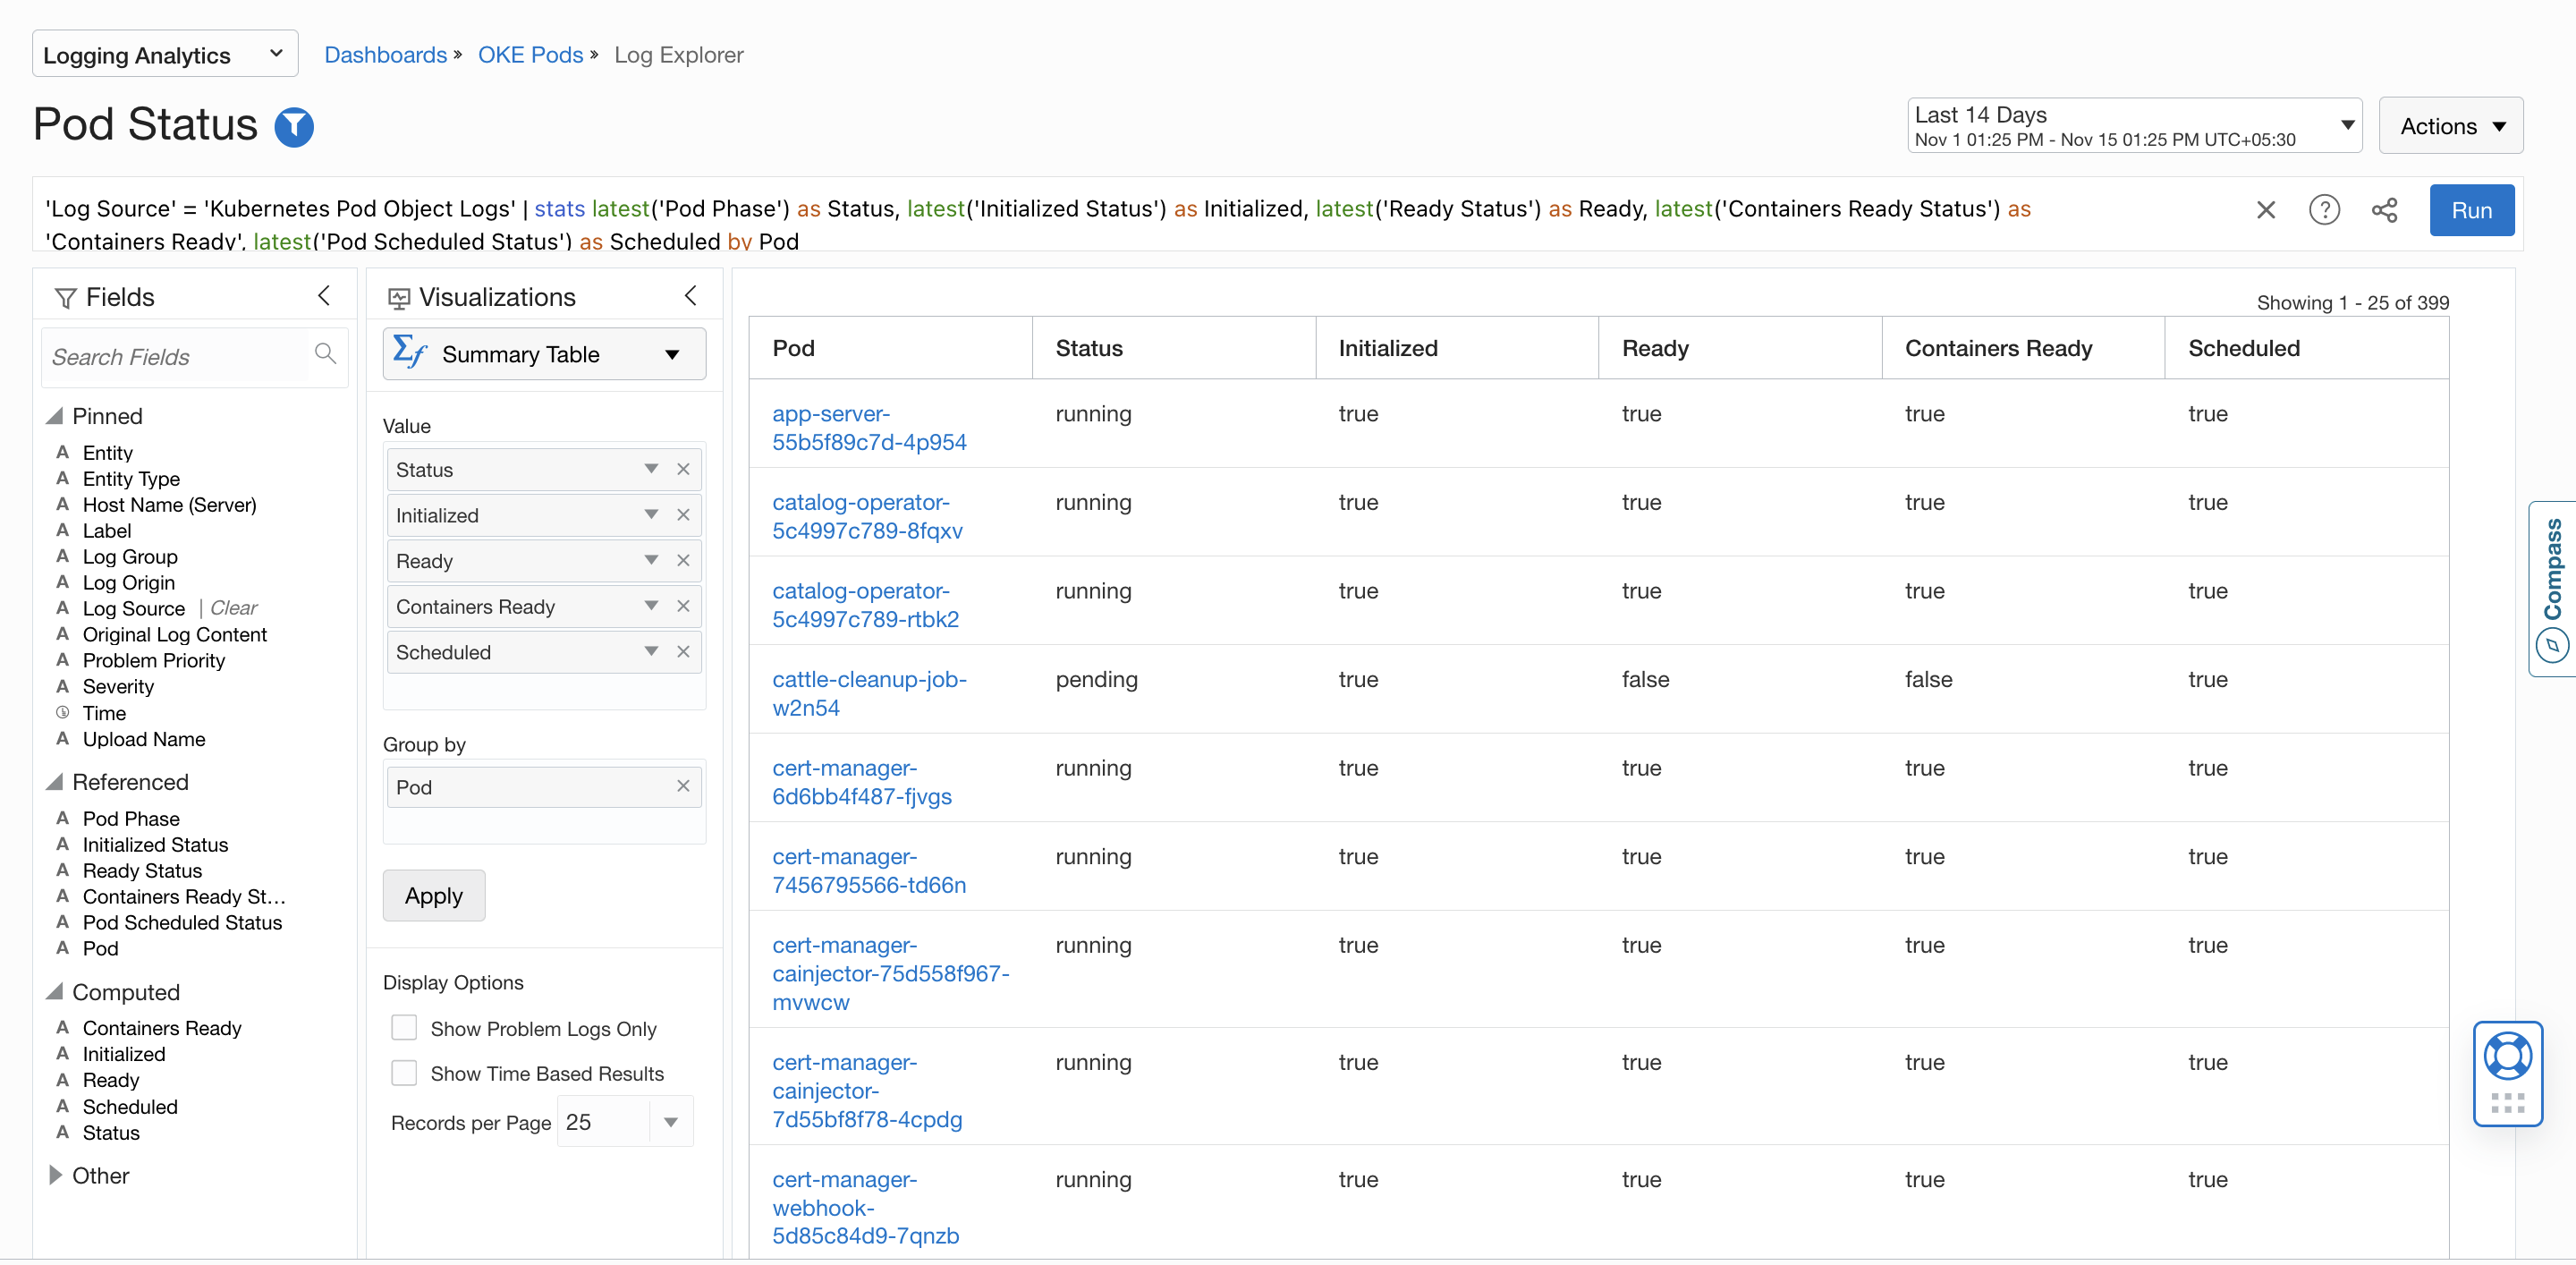
- Perform analysis on these logs to get useful information. For example, to know the Pod Status, run the below query to obtain the detailed status.
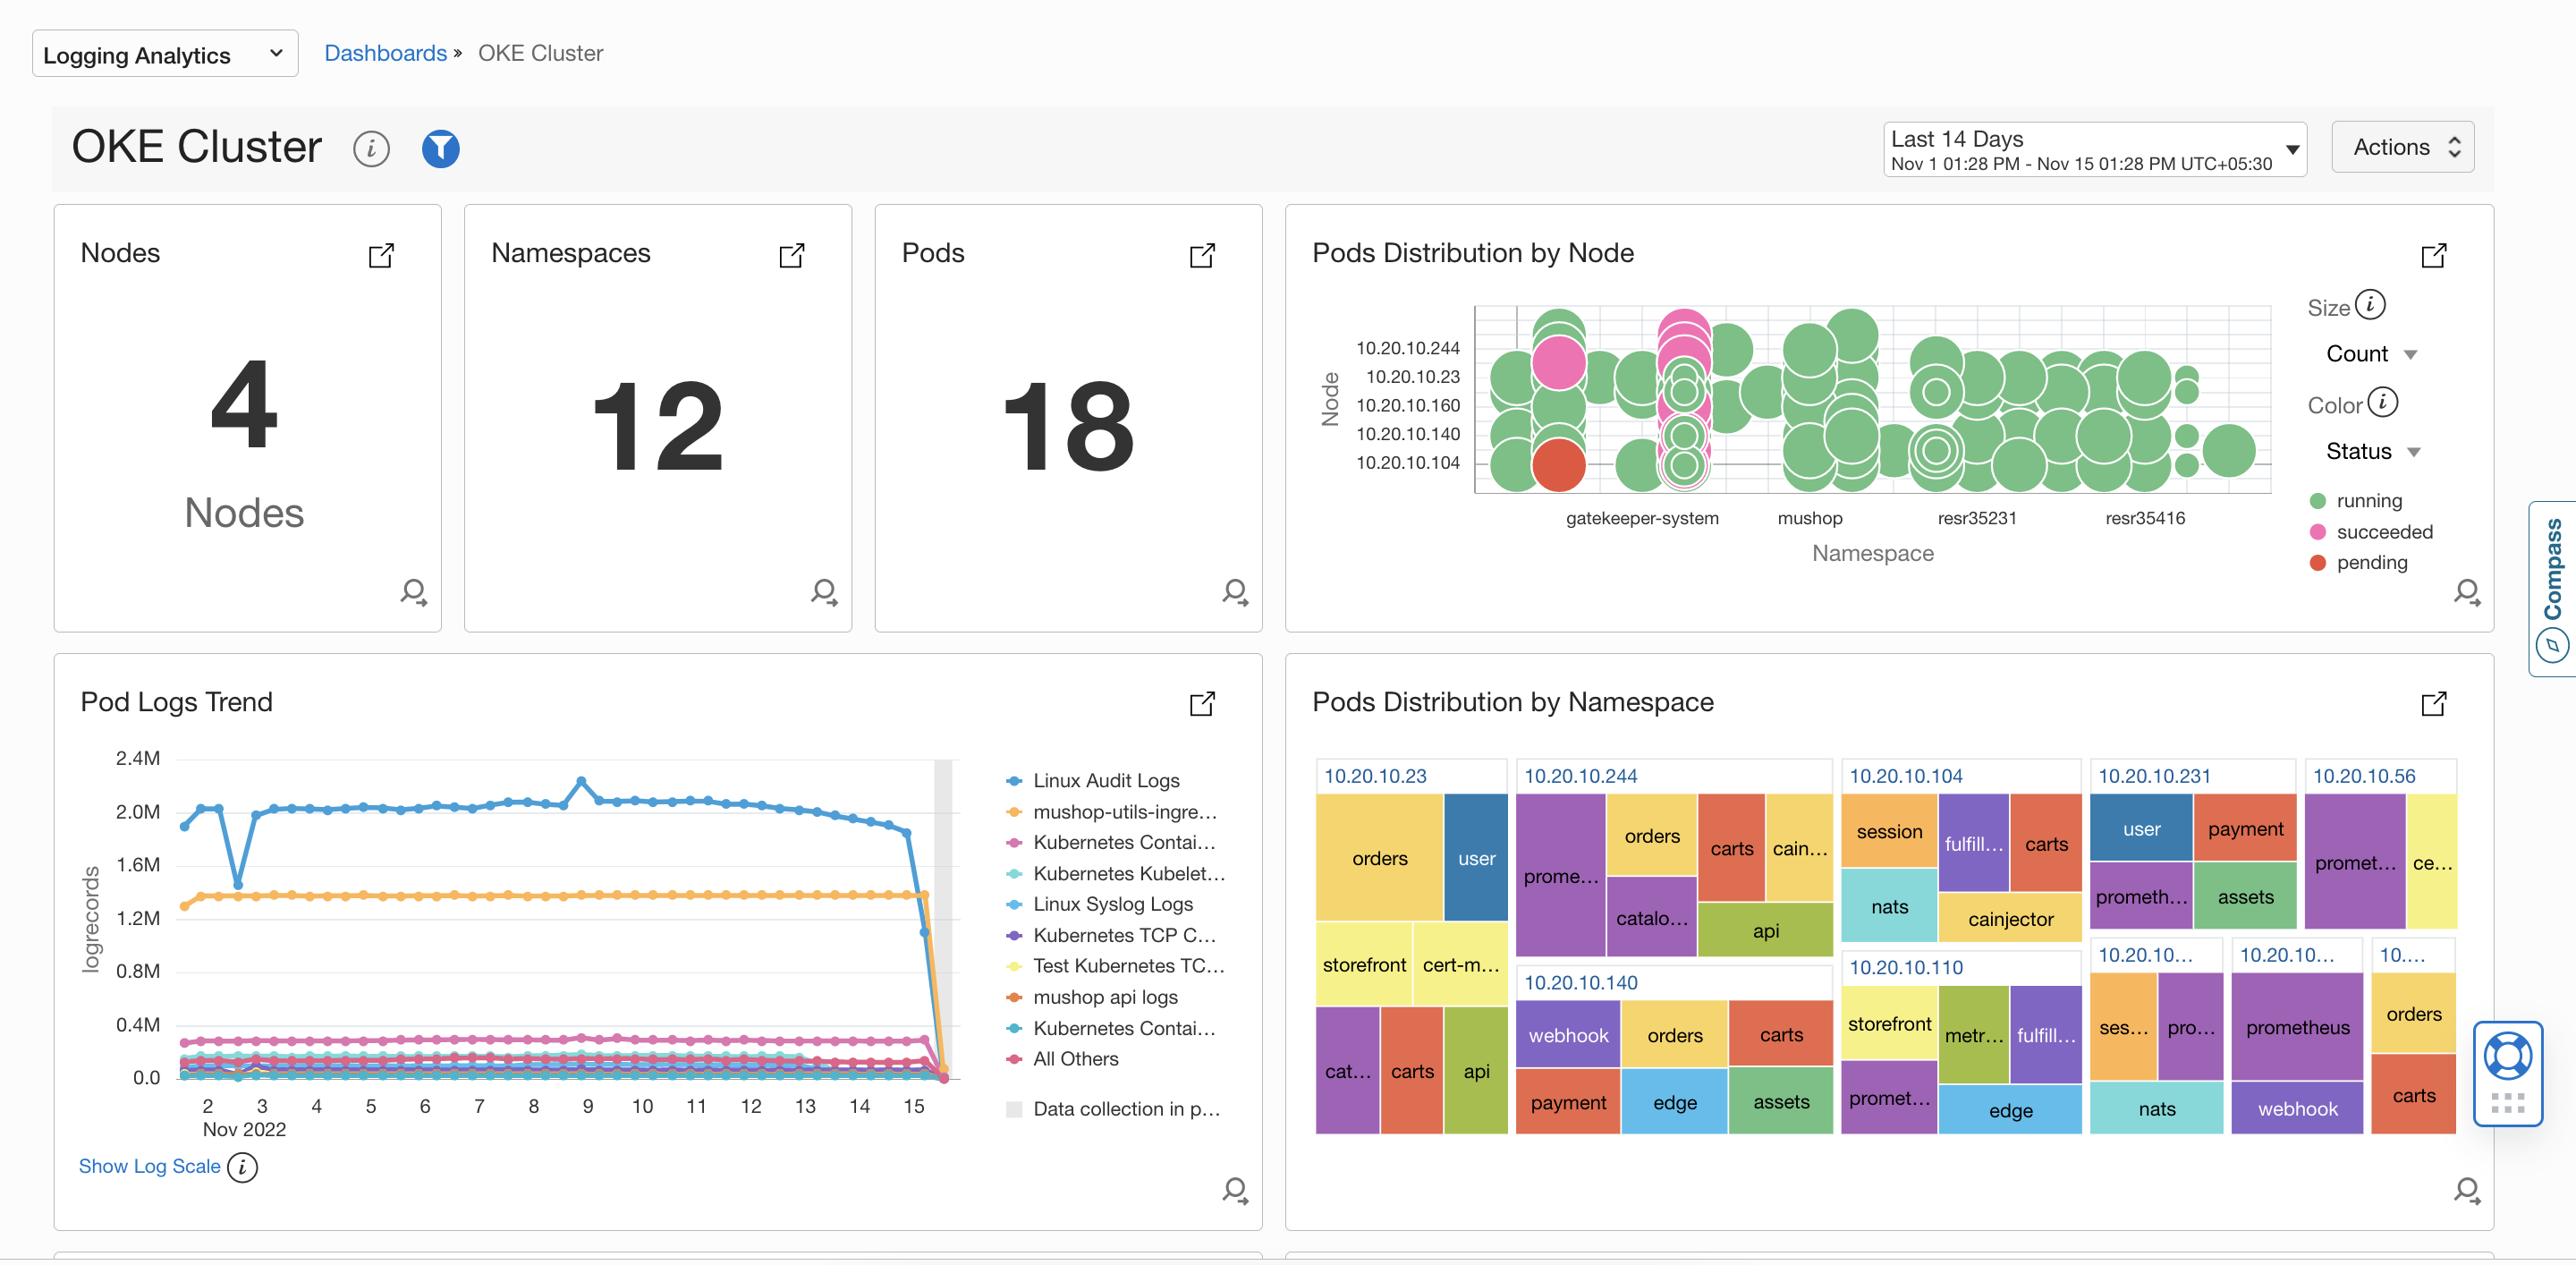
- Custom dashboards can be built to help understand the environment in a single view. For example, the dashboard below gives a complete summary of the OKE clusters.
Enhance Application Monitoring with OCI APM comprehensive features
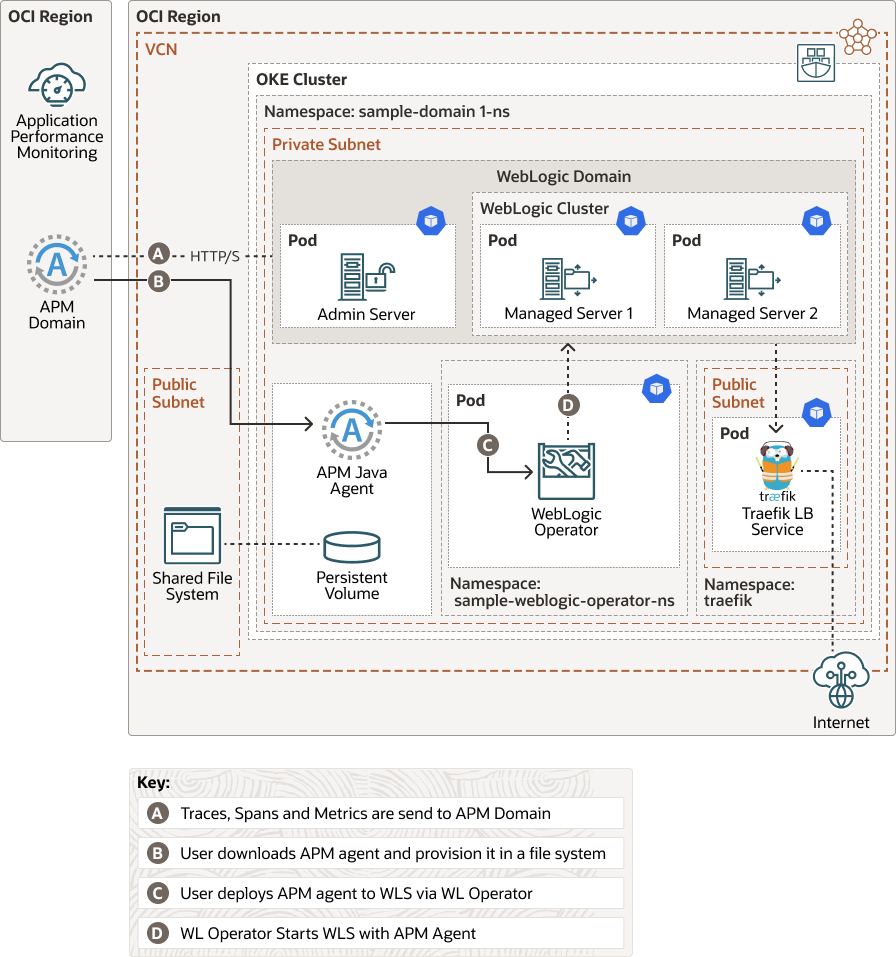
We saw how to monitor the infrastructure of a Kubernetes environment and gain insights from the logs. Now, let’s look at how to monitor the WebLogic application deployed on the Kubernetes cluster using the OCI Application Performance Monitoring (APM) service. APM provides a comprehensive set of features to monitor applications and diagnose performance issues. This enables automatic Open Tracing instrumentation and metrics collection that are used to provide full, end-to-end application monitoring and diagnostics. Among other capabilities, APM includes an implementation of a Distributed Tracing system. It collects and processes transaction trace data (spans) from the monitored application and makes it available for viewing, dashboarding, exploration, alerts, etc.
-
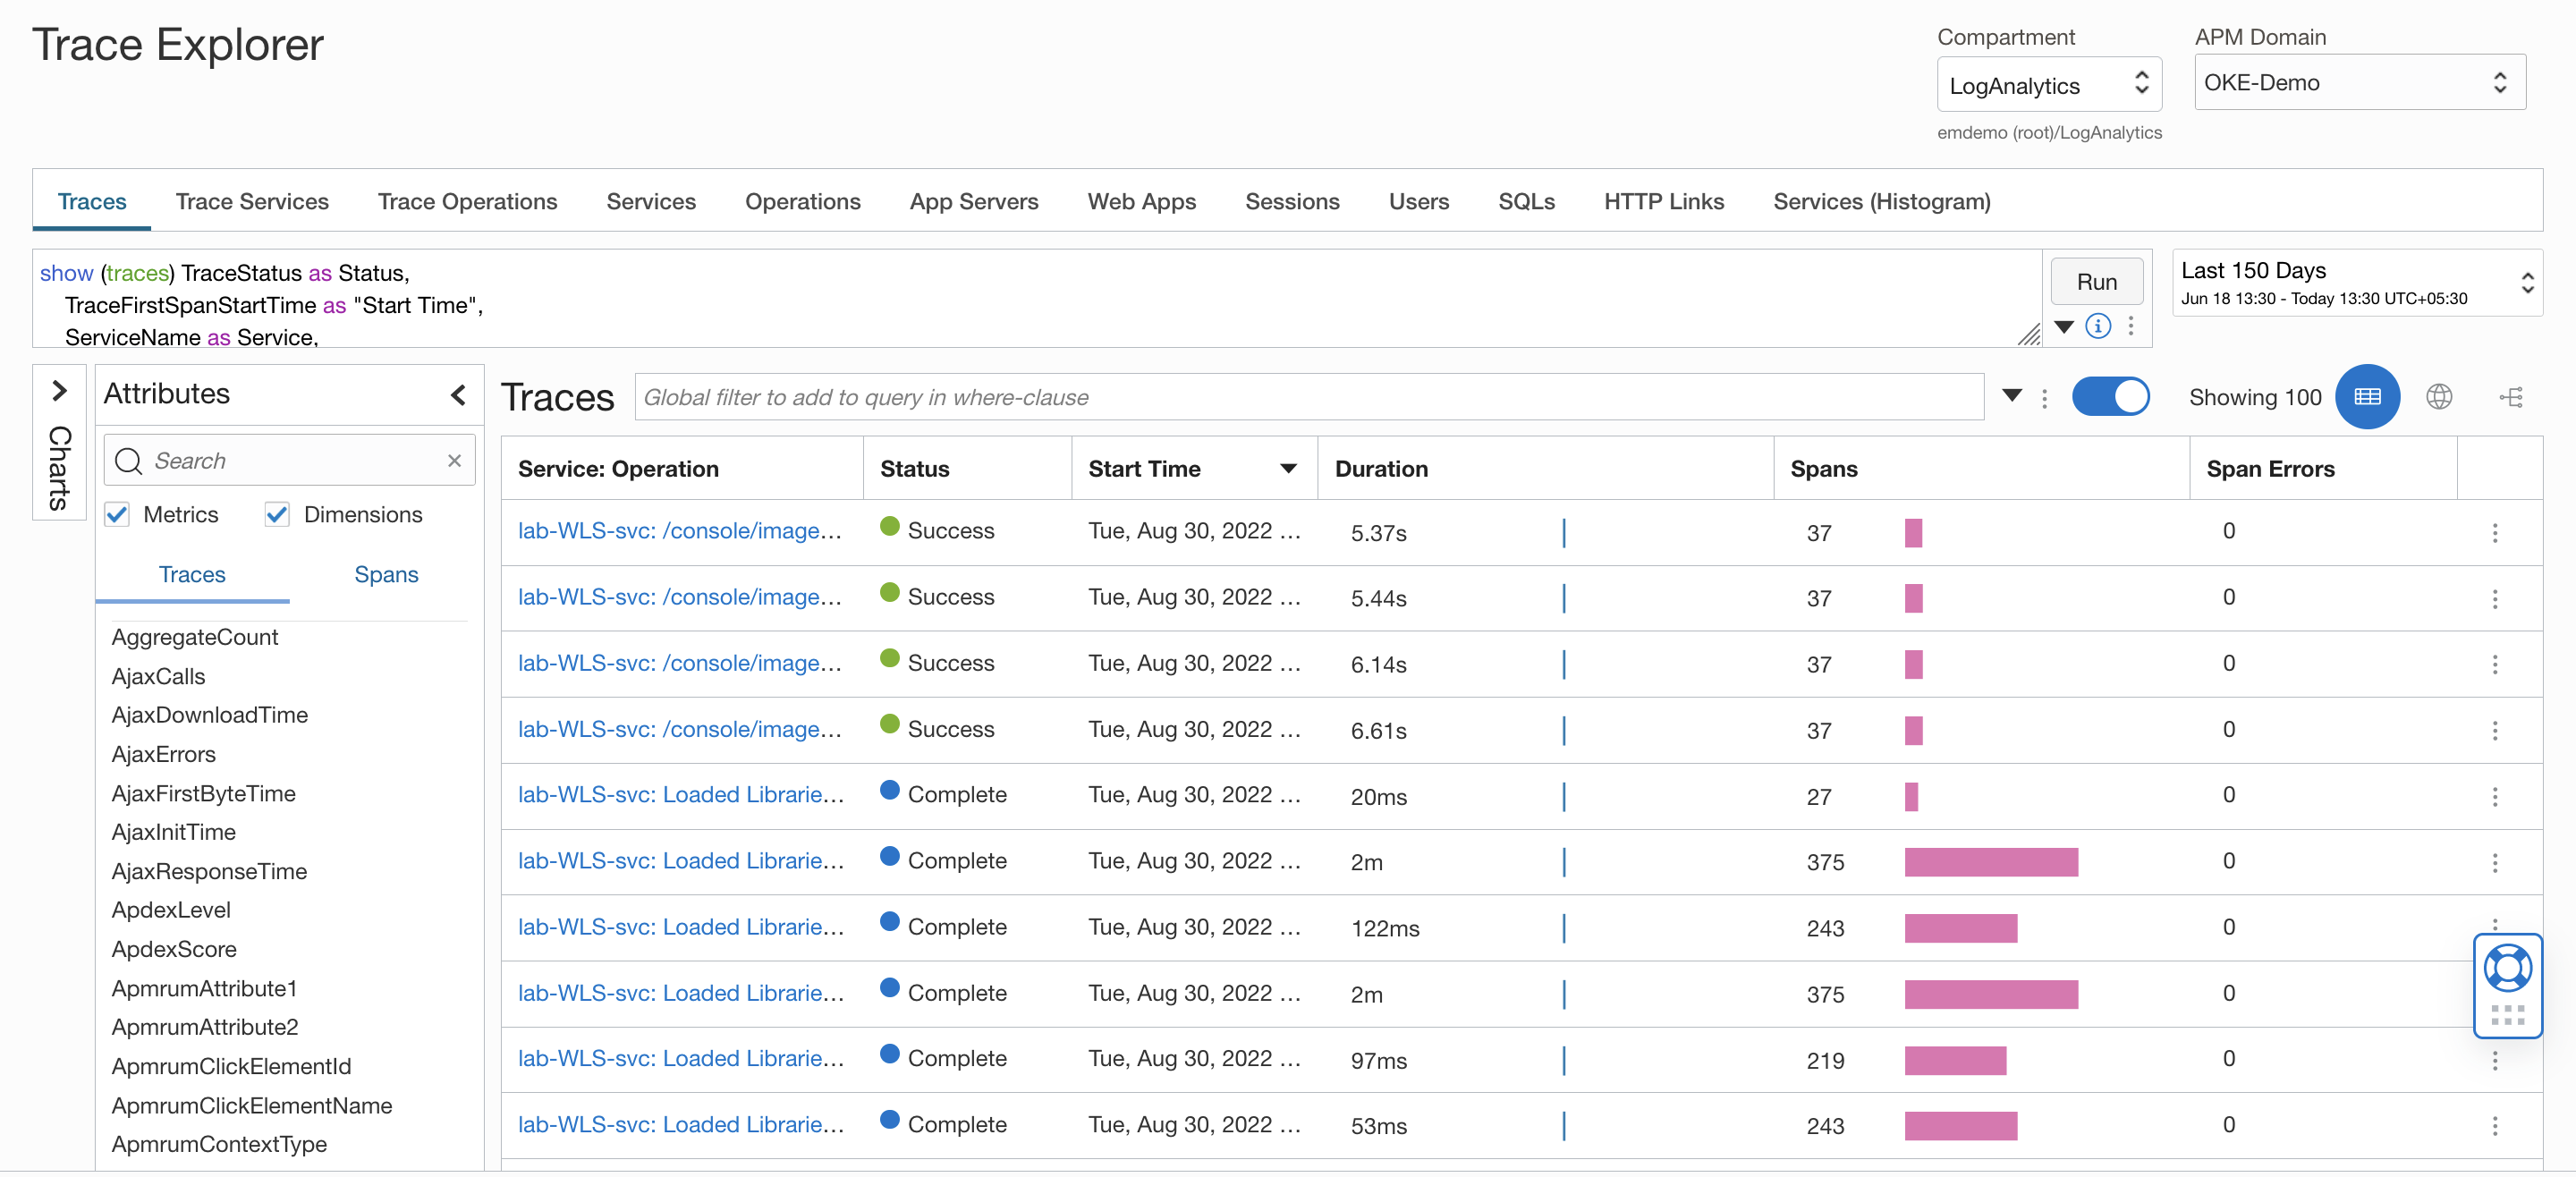
Select Observability & Management from the OCI Console navigation menu, then select Application Performance Monitoring > Trace Explorer.
-
Select the Compartment and the APM Domain from the Trace Explorer page. Review the traces captured which provide details on how the application is being accessed and is performing.
-
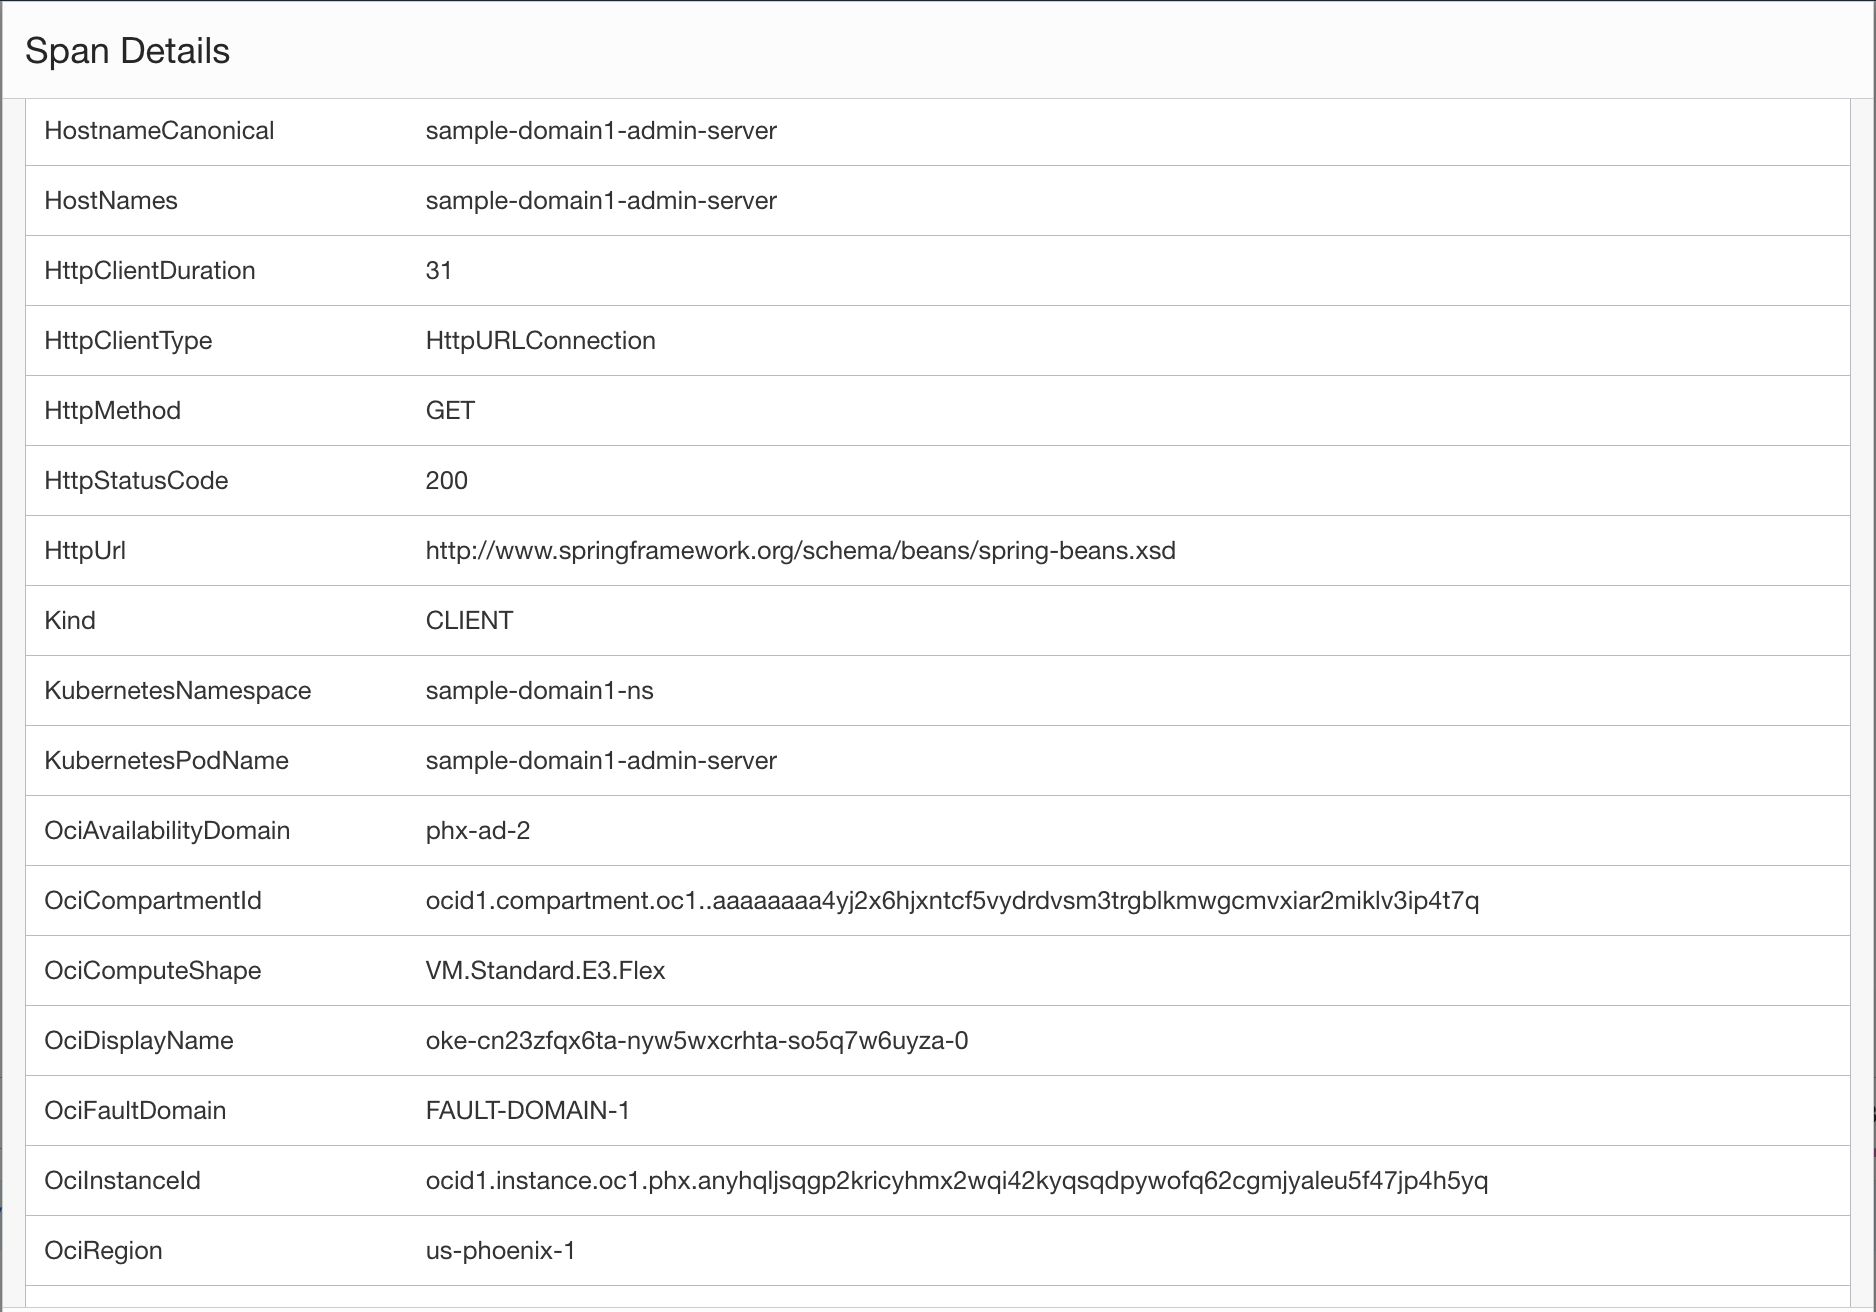
Click on Trace to see the Trace details and the Span details. Anomalies in the application can be identified and mediated. For example, understanding which page is slow in the application and monitoring the performance of the complete application helps minimize the time to finding a root cause.
-
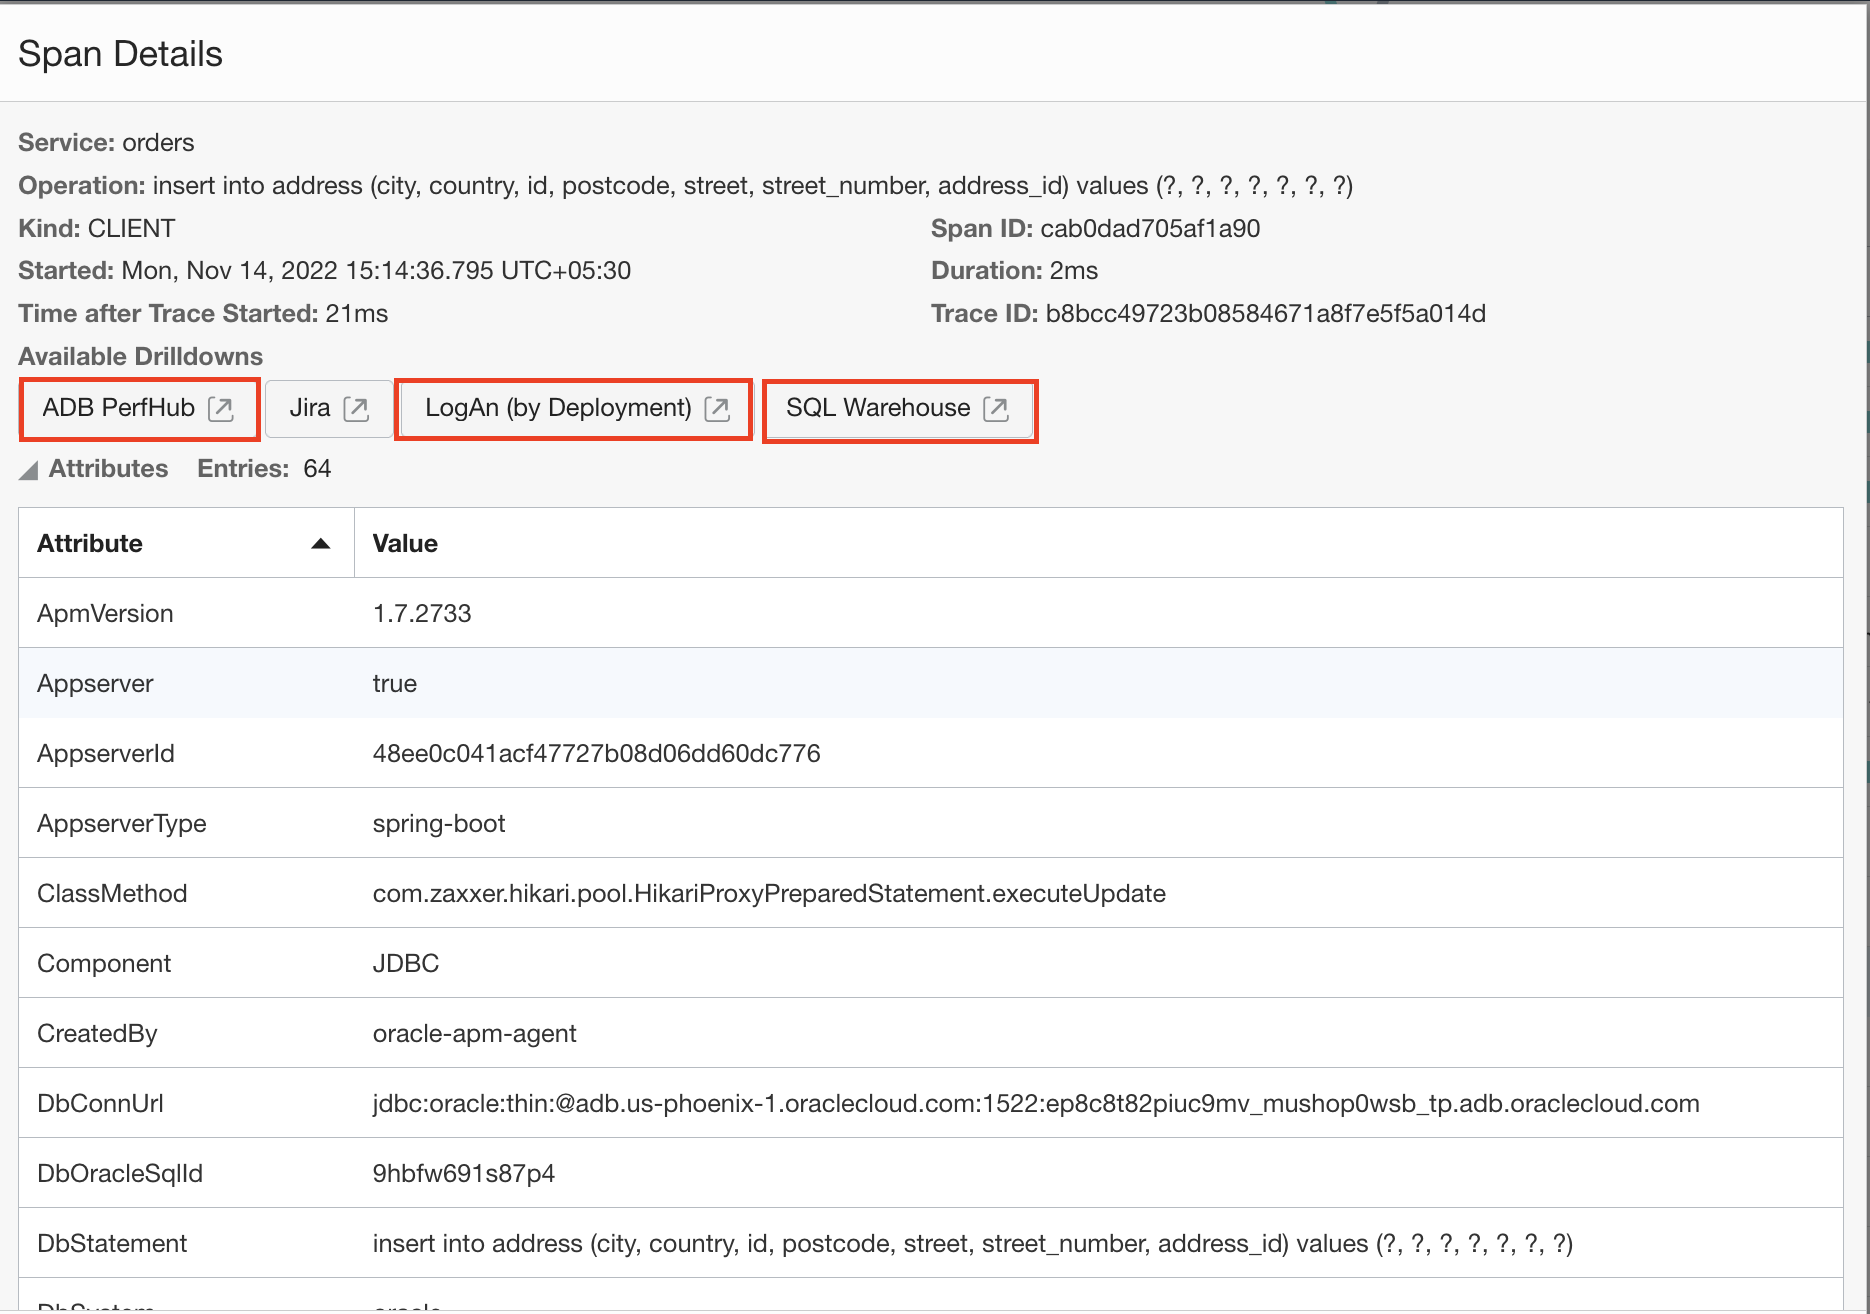
Drilldown to other services of O&M such as Log Analytics for insights into the infrastructure layer.
-
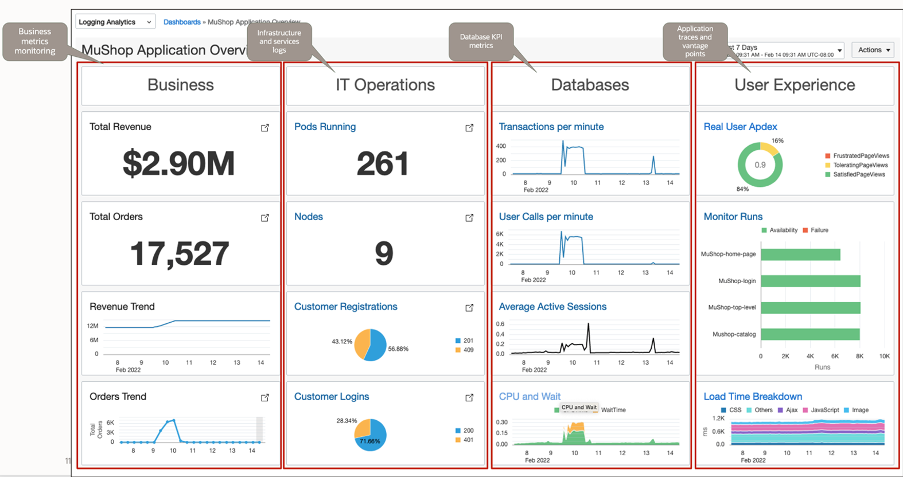
Create custom dashboards for your application monitoring and get a holistic view of the application health. Below, is an example of an overview dashboard for a sample application deployed on an OKE cluster.
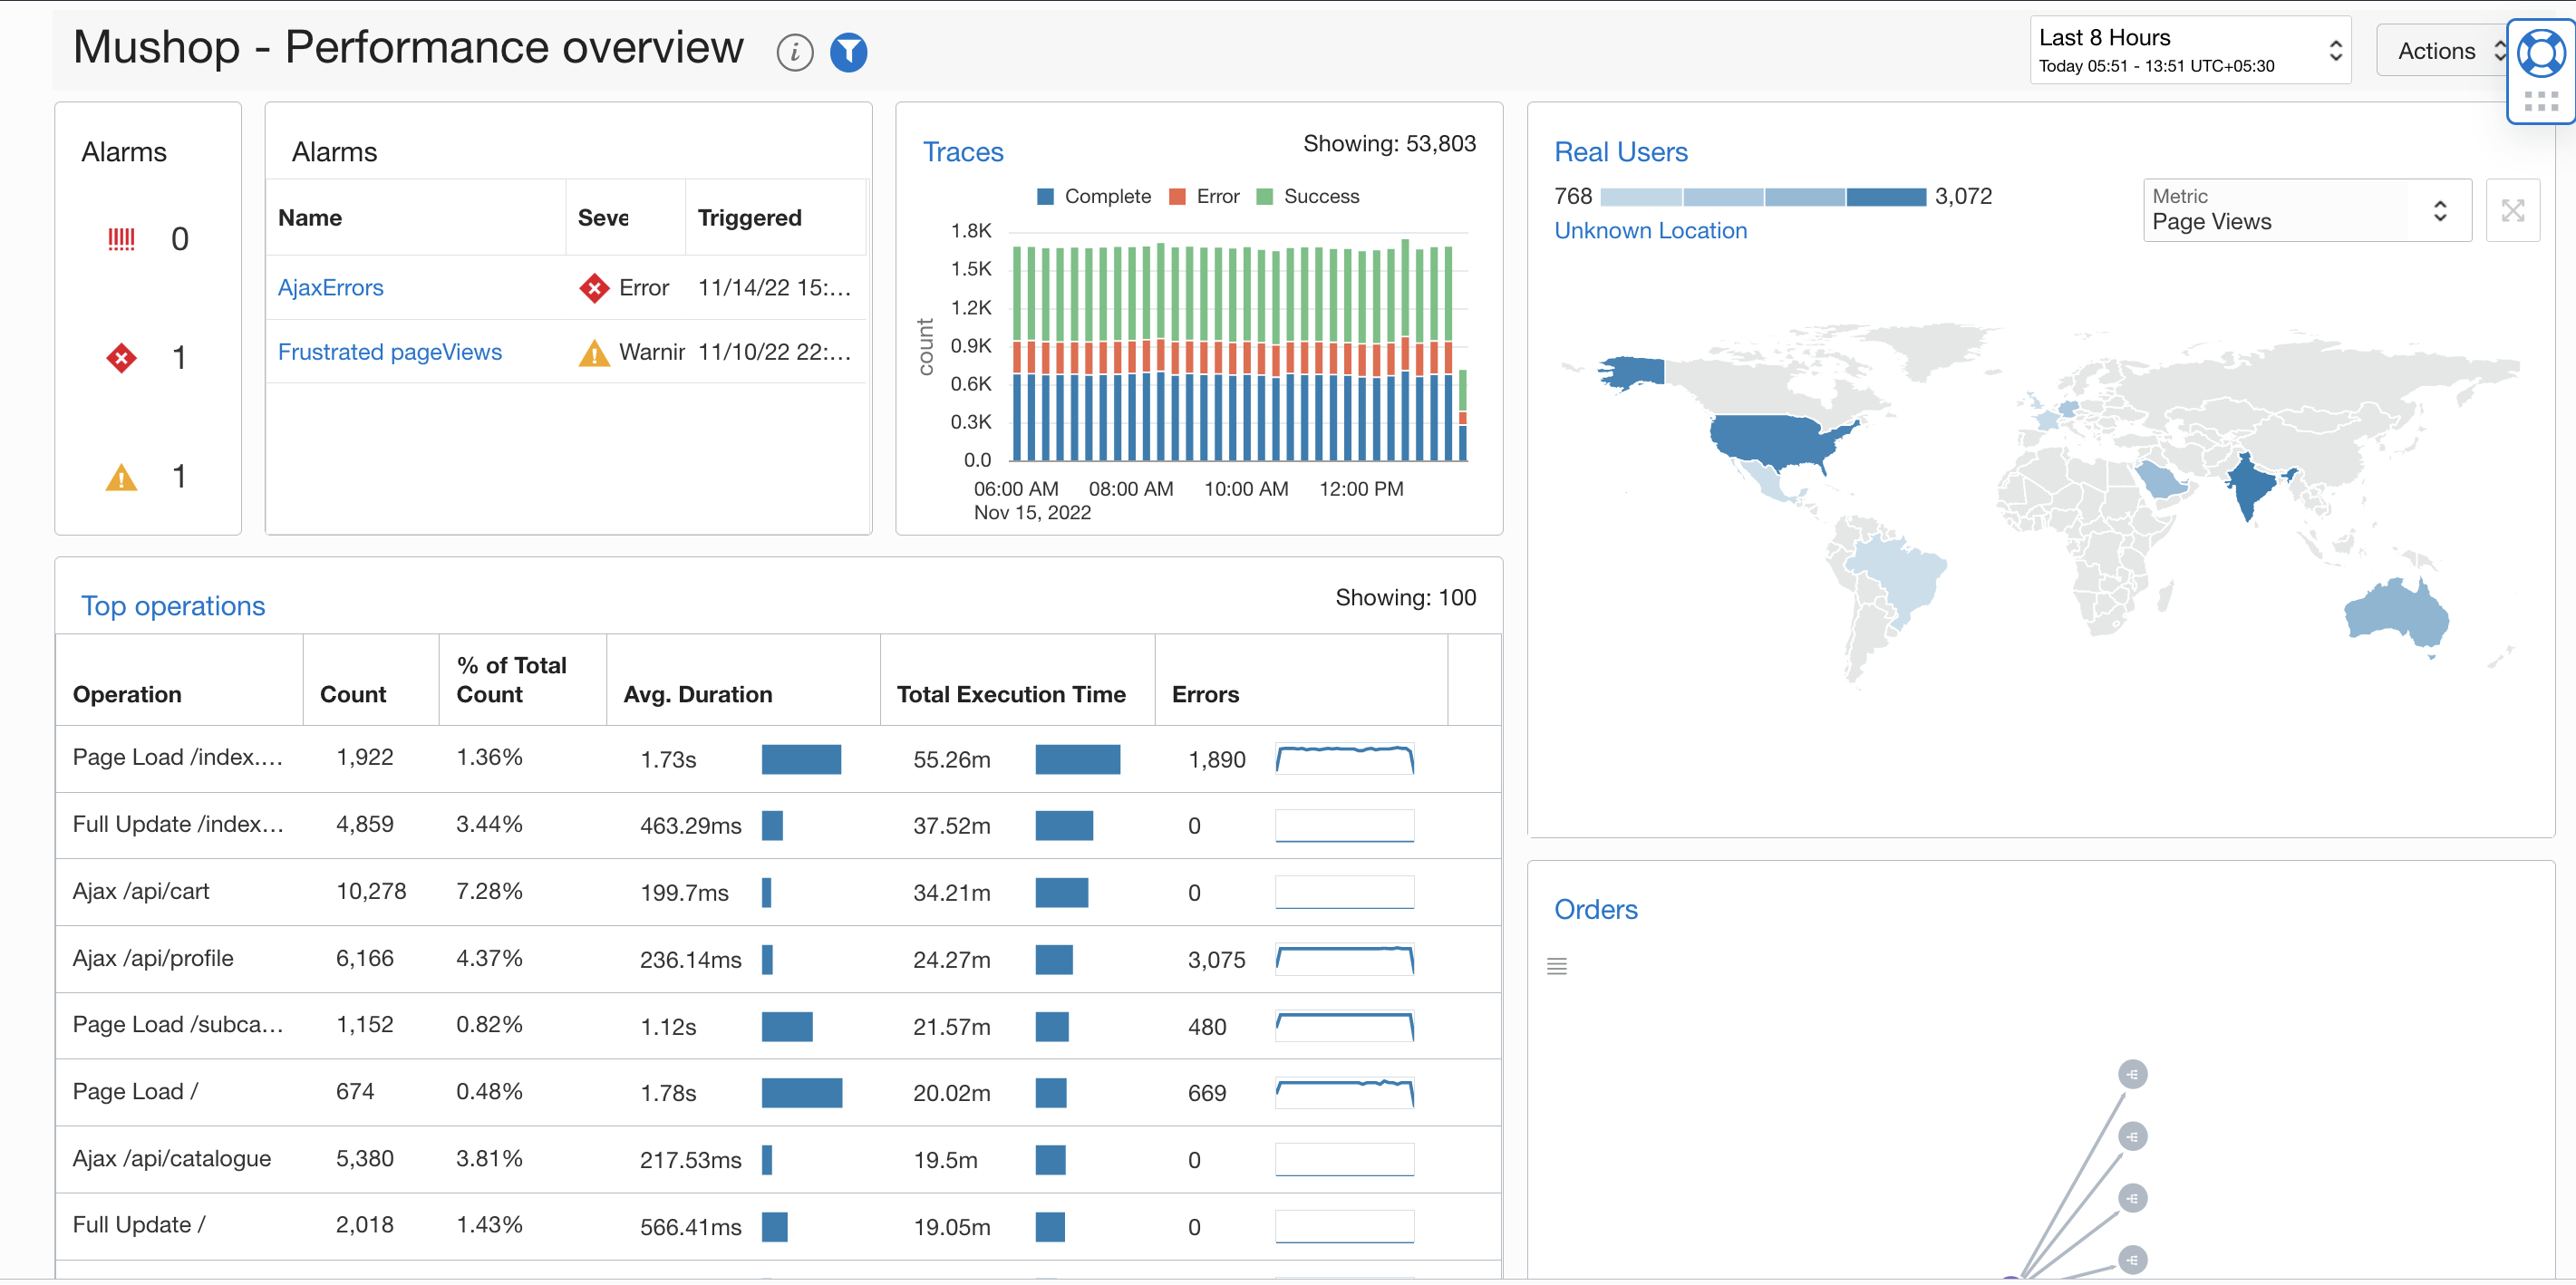
Figure 9: Dashboard for Application Overview
The O&M platform enables insights into complex Kubernetes ecosystems. Custom dashboards help create a unified view of the complete environment through cross-service, multi-operation-level views and drill down to each service. These capabilities provide an end-to-end monitoring solution for OKE and other forms of Kubernetes Clusters using OCI Log Analytics, OCI Application Performance Monitoring, and other OCI Services. Check it out for yourself, visit the APM livelabs and LA livelabs to understand more.