Effectively attributing infrastructure costs across large organizations, especially those leveraging shared and dynamic cloud resources, has long posed a significant challenge for IT and finance teams. As cloud environments become more complex, it can be difficult to pinpoint which teams or projects are consuming which resources, and, crucially, how much they should be charged. The result is poor cost visibility, over-provisioning, and wasted spend – exactly what FinOps is designed to prevent.
Ops Insights is purpose-built to address these FinOps challenges by equipping organizations with powerful, easy-to-use tools for cloud financial management and optimization. The service’s vision is to simplify the complexities of chargeback, showback, and cost allocation across the business. Today, Ops Insights delivers mature FinOps capabilities such as Capacity Planning and Exadata Insights at the database, host, and Exadata system levels, empowering teams to forecast demand and optimize resources. Now, with the introduction of its new chargeback functionality, Ops Insights takes a critical leap forward, giving organizations clear, actionable insights into resource utilization and associated costs, fostering organizational accountability, supporting FinOps best practices, and driving smarter cloud cost management in multicloud environments.
Getting started with Chargeback
By providing both “showback” and actionable “chargeback” functionality, this feature allows tenancy and resource administrators to allocate costs to individual departments, business units, or users based on actual usage. This not only supports financial transparency but also incentivizes responsible resource consumption. When users know they’re accountable for their resource utilization, they tend to optimize usage and reduce waste, leading to smarter IT investments and more efficient operations.
As with all Ops Insights features, onboarding is designed to be straightforward, with guided steps that walk you through the required IAM policy setup. You’ll notice Exadata Cost Management listed in the Exadata section of the policy advisor; this is where you configure access for cost management.
Start by selecting the user group that will interact with the feature (for example, FinOps, platform ops, or tenancy administrators). Ops Insights then provides a starter policy that grants the selected group access to read the reports that provide the billing inputs, and it also grants the Ops Insights resource principal access to the same billing data so the service can perform allocations and generate cost views.
Once the required policies are configured, the Exadata Cost Management page, located within Exadata Insights, is a central location to enable cost management for Exadata deployments and drill down for cost analysis.
Exploring cost analysis
When enabling cost management for an Exadata system, you can choose from a set of plans that determine how unused cluster capacity cost is allocated across PDBs:
- Equal allocation: Distributes unused capacity cost equally among all PDBs, regardless of utilization.
- Unused allocation: Does not bill unused capacity to PDBs; each PDB is charged only for what it uses.
- Weighted (usage-based) allocation: Distributes unused capacity cost proportionally based on each PDB’s share of total CPU usage.
The Exadata Cost Management details page, nested under Exadata Insights features, serves as the central place to explore cost allocation results, validate the utilization drivers behind those allocations, and produce repeatable reports. It presents attributed cost and utilization data through interactive, drillable charts that help you move quickly from high-level visibility into where spend is landing and which systems are driving cost, to deeper investigation of why a specific database’s allocation looks the way it does, and finally to capturing a consistent view for finance and operations. How the plans work, in practice, is explained in the following example (values are hypothetical to provide easy-to-understand ratios for PDB resources, non-CDB databases are also supported):
Consider a VM cluster with 10 ECPUs allocated at $100/hour. Three PDBs are active: PDB1 averaging 1 ECPU, PDB2 averaging 2 ECPUs, and PDB3 averaging 3 ECPUs. Total utilization is 60%, so $60 is the used cost and $40 is the unused cost for that hour.
- Equal allocation splits the $40 unused cost three ways: Each PDB pays its usage charge plus $13.33. PDB1 = $23.33, PDB2 = $33.33, PDB3 = $43.33.
- Unused allocation charges only for actual usage. PDB1 = $10, PDB2 = $20, PDB3 = $30. The $40 unused cost is not attributed to any PDB.
- Weighted allocation distributes the $40 unused cost in proportion to each PDB’s share of total CPU used (1/6, 2/6, 3/6). PDB1 = $16.67, PDB2 = $33.33, PDB3 = $50.00.
Calculations are performed for each hour in the billing period, and the total attributed cost is the sum of the hourly totals.
Interactive sunburst and database-level analysis
Cost management data is primarily explored through two tightly linked views: A sunburst chart and the Databases table.
- Sunburst chart: Provides a visual breakdown of attributed costs, organized by VM clusters and their associated databases, based on the selected cost allocation plan.
- Segment size indicates attributed cost: Larger segments represent higher attributed costs for a VM cluster or database.
- Color reflects attributed cost ranges by default, helping you quickly identify the largest cost drivers. You can optionally switch the color scheme to denote VM clusters instead, which can be useful for tracking distribution and ownership across clusters.
- The combination of size and color makes it easy to spot hotspots at a glance, then drill down for detail.
- Databases table: Lists the VM clusters and databases in the Exadata system and complements the visualization with key metrics and context, including:
- Actual cost: The total cost incurred by the VM cluster based on actual resource consumption.
- Attributed cost: The portion of total Exadata system cost assigned to a database or VM cluster, calculated according to the configured allocation plan.
- VM cluster CPU utilization (%): The percentage of VM cluster CPU capacity utilized by the PDBs, a key input to cost allocation calculations.
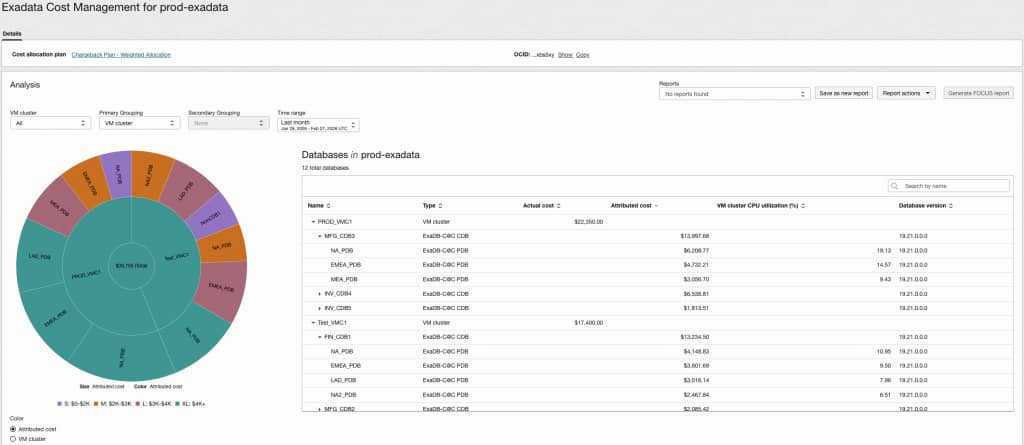
Together, these views enable rapid visual identification of where costs concentrate and precise validation of the utilization signals and numbers behind the allocation.
To make analysis practical at enterprise scale, the page includes filters that apply consistently across the sunburst chart, Databases table, and the time-series charts:
- VM cluster: Narrow analysis to a specific VM cluster, or keep All selected to view the full Exadata system.
- Primary grouping: Apply a second-level grouping for deeper analysis. For example, if you select a defined tag as the outer ring, you can select CDBs for the inner ring to see costs grouped first by the tag and then by CDB. (When not applicable, this option remains disabled.)
- Secondary grouping: Choose the top-level organization for the sunburst, such as VM cluster or OCI defined or free-form tags.
- Time range: Select the period you want to analyze. In addition to rolling windows, Exadata Cost Management includes calendar-based options that are especially useful for FinOps and billing workflows:
- Last day (previous calendar day)
- Last month (previous calendar month, e.g., Jan 01–Jan 31)
- Last year (previous calendar year)
The filtering and grouping model supports both operational and FinOps workflows by letting teams view the same allocation data through the lens that matches their responsibilities. Operations can filter down to a VM cluster and specific databases to investigate cost spikes and validate the utilization drivers behind an allocation. FinOps can group costs by tags or business mappings, such as department, function, or lifecycle, to produce consistent chargeback reports. For example, if databases are tagged to cost centers spread across multiple CDBs (e.g., CC4100 Sales Ops and CC5200 Finance), you can group by Cost Center to attribute shared Exadata spend across those teams and reuse the saved view for monthly reporting.
Beyond point-in-time attribution, the Exadata Cost Management details page includes two time-series charts that help you understand trends and explain changes:
- CPU utilization (%): By default, when grouped by VM clusters, this chart shows total cluster utilization over time.
- Cost (USD): Follows the same interaction model but displays cost instead of utilization. When VM clusters are selected, the chart reflects actual costs (not attributed costs).
By default, these charts display VM cluster data for the past month, but they update dynamically based on what you select in the sunburst chart:
- Selecting a PDB filters the charts to show the portion of cluster utilization attributable to that PDB—and the related cost view.
- Selecting a tag-based grouping that spans multiple VM clusters can display multiple lines, where each line represents the utilization (or cost) consumed by that grouping within a specific cluster.
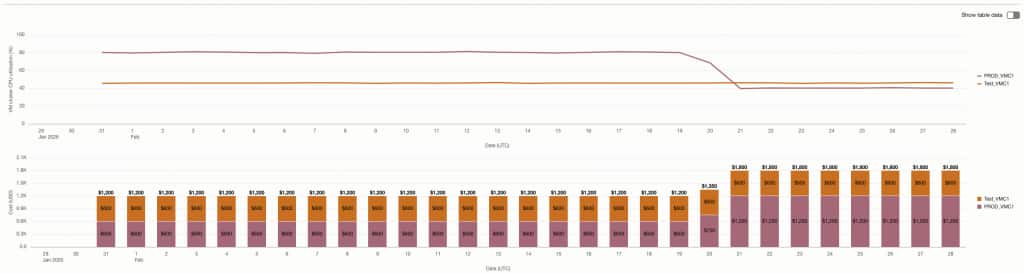
This makes it easier to:
- Inspect utilization patterns over time to understand normal behavior vs. anomalies.
- Track daily cost trends to detect spikes or unexpected changes.
- Correlate utilization and cost to identify inefficiencies and potential optimization opportunities.
Reporting and export
When you need to share allocation outcomes with finance stakeholders or incorporate them into downstream chargeback and forecasting processes, Exadata Cost Management makes the results easy to reproduce and distribute in a consistent format. By saving reports, you can capture the exact state of your analysis, including the selected VM cluster, groupings, and time range, so the same view can be reloaded later from the Reports capabilities without having to reapply filters or risk inconsistencies. This is especially useful for month-end close, recurring operational reviews, and auditability, because it ensures everyone is looking at the same data cut over time. For integration with billing and financial management tools, you can also select Generate FOCUS report to export a standardized FOCUS report as a .csv file, enabling smoother handoffs to external reporting workflows, easier aggregation with other cost sources, and a more reliable basis for financial reconciliation and chargeback.
Key differences between OCI Cost Management and Exadata Cost Management in Ops Insights
Native PDB cost attribution and Exadata Cost Management in Ops Insights are complementary capabilities. Native attribution gives customers immediate PDB-level visibility in OCI Cost Management, making it easier to understand attributed cost and usage without additional setup. Exadata Cost Management in Ops Insights is designed for organizations that need to go further: defining how shared and unused Exadata capacity should be allocated, analyzing cost drivers visually, grouping spend by business context, and producing repeatable reports for chargeback, showback, and finance operations.
| Capability/Requirement | Native PDB cost attribution in OCI Cost Management | Exadata Cost Management in OCI Ops Insights |
|---|---|---|
| Primary purpose | Provides basic PDB-level attributed cost and usage visibility in OCI Cost Analysis and Cost Reports. | Provides a dedicated FinOps experience for Exadata chargeback, showback, cost analysis, and recurring reporting. |
| Availability / setup | Available natively with no extra configuration or additional setup steps. | Requires enabling Exadata Cost Management in Ops Insights and configuring the required IAM policies through guided policy setup. |
| Cost allocation method | Uses database CPU utilization metrics and equal distribution of idle CPU time to attribute VM cluster costs across PDBs. | Uses the AWR CPU time component of Average Active Sessions (AAS) to determine database usage share, and supports multiple allocation plans for unused cluster capacity, including equal allocation, unused allocation, and weighted usage-based allocation. |
| Level of analysis | Cost and usage are surfaced in OCI Cost Analysis and Cost Reports, including attributed cost and attributed usage. | Provides a dedicated Exadata Cost Management details page with drillable visualizations, database-level analysis, utilization drivers, and cost trends. |
| Visualization experience | Uses OCI Cost Analysis views with attributed cost and attributed usage display options. | Includes interactive visualizations such as sunburst charts, database tables, CPU utilization trends, and cost time-series charts. |
| Grouping and ownership mapping | Supports tags associated with PDB instances and Oracle-defined relationship tags for VM cluster, CDB, and PDB identification. | Supports VM cluster filtering, primary and secondary grouping, and tag-based grouping for cost centers, departments, lifecycle, applications, or business mappings. |
| Chargeback / showback readiness | Useful for basic attribution, budgeting, and identifying PDB-level cost in native cost tools. | Designed for repeatable showback and chargeback workflows across finance, platform operations, and tenancy administration teams. |
| Handling unused capacity | Idle CPU time is distributed equally as part of the native attribution model. | Provides configurable choices for how unused capacity cost is allocated, including assigning it equally, excluding it from PDB chargeback, or weighting it by usage. |
| Reporting | Data is available in OCI Cost Reports through attributed cost and attributed usage columns. | Allows users to save analysis views and generate standardized FOCUS .csv reports for downstream billing, reconciliation, and finance workflows. |
| Cost detail retention & granularity | Retains up to 12 months of cost and usage history. Analysis is available at monthly granularity for 12 months and daily granularity for shorter time windows (up to ~3 months). | Retains up to 25 months of telemetry and cost attribution data. Exadata Cost Management leverages long-term historical data and capacity analytics, enabling database/PDB-level cost attribution and trend analysis across more than two years of history. |
| Best fit | Customers who need immediate, no-cost PDB-level visibility in OCI Cost Management. | Customers who need advanced FinOps governance, flexible allocation policy, visual cost investigation, reusable reports, and enterprise chargeback processes. |
| Commercial consideration | Included as a native OCI Cost Management enhancement. | Part of Ops Insights / Exadata Cost Management capabilities, intended for customers who need deeper analysis and operationalized FinOps workflows. |
In short, native PDB cost attribution answers the question, “What cost and usage can OCI attribute to each PDB?” Exadata Cost Management in Ops Insights helps answer the broader FinOps question, “How should shared Exadata spend be analyzed, allocated, explained, and reported across the business?”
Summary
The new chargeback capability in Ops Insights, Exadata Cost Management, delivers a more granular, transparent view into how shared Exadata VM cluster resources translate into allocated costs at the database level. With guided policy setup, flexible allocation plans, interactive visualization with tag-based grouping, time-series trend analysis, and standardized FOCUS reports, organizations can improve cost visibility, strengthen accountability, and make better-informed decisions to optimize spend across their IT estate.