Oracle True Cache, introduced in Oracle Database 26ai, represents a significant shift in how database applications scale. Unlike traditional sidecar caches like Redis or Memcached, True Cache is an automatically managed, in-memory, read-only replica of the primary database. It provides a consistent, transparent caching layer that stays synchronized with the primary database using redo apply technology—similar to Active Data Guard, but optimized for extreme read performance and lower latency.
While Oracle True Cache automates much of the heavy lifting, the scale of enterprise deployments necessitates a holistic monitoring strategy. Monitoring the health of the primary database and its True Cache instances is the best way to ensure the availability and effectiveness of True Cache. Oracle Enterprise Manager (EM) plays a crucial role here. Oracle Enterprise Manager is Oracle’s integrated systems management solution, delivering rich monitoring and management capabilities for Oracle Databases and Engineered Systems across your data centers and the cloud. Starting with Enterprise Manager 24.1 RU4, you can monitor large scale True Cache deployments — including availability, hit ratio’s and transport/apply lag between the primary database and its True Cache instances.
Real-time status monitoring for True Cache instances
Applications that adopt True Cache can deliver faster response times when handling user queries. However, the sudden loss of one or more True Cache instances can have the opposite effect: read traffic falls back to the primary database, potentially increasing load and slower application response times – resulting in a degraded user experience.
EM provides immediate alerts on instance status, allowing administrators to restore instances as quickly as possible.
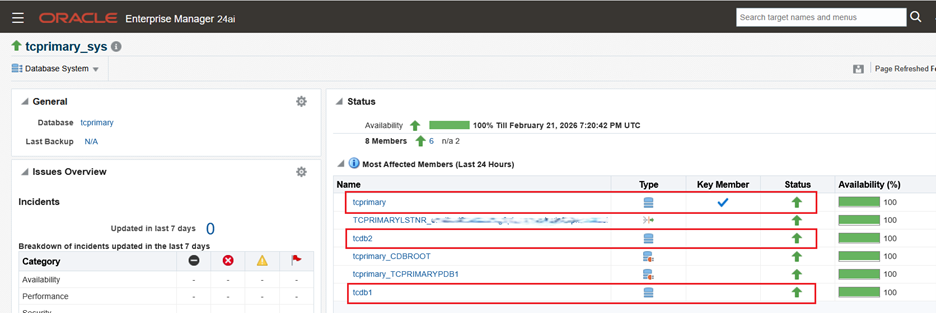
Figure 1. Monitoring availability status across primary database and True Cache instances
Primary Database and True Cache Instances Topology View
Large deployments often use multiple True Caches per primary database for partitioning or data sovereignty. The Topology View inside EM shows the True Cache instances associated with the primary database. Understanding the topology between the primary database and its True Cache instances helps teams assess impact quickly, troubleshoot faster, and maintain consistent application performance when issues occur.
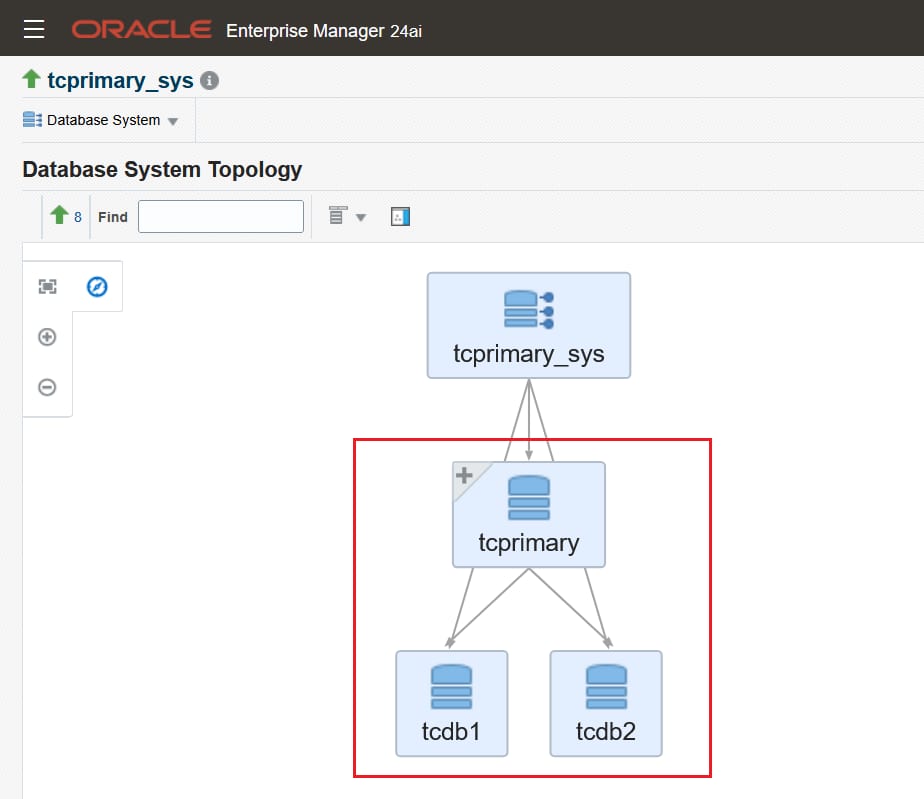
Figure 2. Primary and True Cache instances topology
Ensuring data consistency in True Cache by monitoring Transport and Apply Lag
True Cache relies on the redo apply replication from the primary database to keep its data consistent and provide a good user experience. Transport lag is the time from a commit on the primary database until the change reaches True Cache; apply lag is the time from arrival in True Cache until the change is applied and visible. Together they are indicators of data consistency or data staleness.
Because applications rely on up-to-date data for a good user experience, monitoring True Cache transport and apply lag is crucial—and if either exceeds a set threshold, EM alerts you so you can take action — correlate the lag with the primary’s redo generation rate and True Cache resource utilization, or adjust network, replication and cache resources to meet demand.
Measuring True Cache Effectiveness via Hit Ratios
Responsive applications depend on serving data from cache, so hit ratio is a key indicator: higher hit ratios indicate efficient cache utilization and consequently faster read responses. A lower hit ratio is indicative of inefficient cache utilization and slower read responses from having to fetch required blocks from the primary.
EM tracks hit ratios for the True Cache instance as a whole, as well as for individual pinned objects. Low cache hit ratios can highlight opportunities to warm up the cache and may indicate issues with pinned-object configuration. Continuous monitoring of hit ratios helps you optimize cache effectiveness over time.
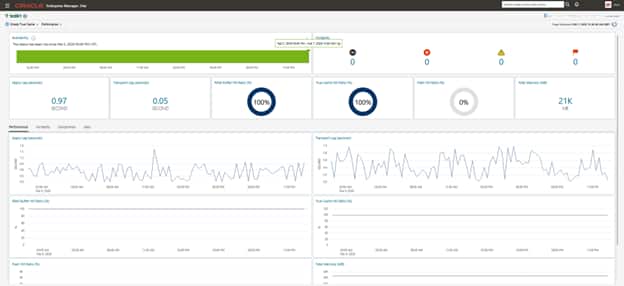
Figure 3. Monitoring True Cache instance availability, apply lag, transport lag, and hit ratios trend
Holistic monitoring of True Cache
In addition to monitoring status, lag times, and hit ratios, EM also tracks True Cache load—such as average active sessions—along with resource utilization (CPU and memory) and error rates. Collectively, these metrics let you proactively monitor demand, capacity, and reliability, helping you keep True Cache right-sized and effective.
Ready to go beyond “Up”? Upgrade to Enterprise Manager 24ai for holistic monitoring of your True Cache environments.
Resources: