OCI Operations Insights, (OPSI), part of the Oracle Cloud Observability and Management platform, is a solution that helps gather, analyze, and plan for enterprise growth. In essence, it helps perform data-driven capacity planning and performance management thereby reducing enterprise capital expenditure and improving applications throughput. OPSI now has SQL Insights, an application that performs pattern recognition-based analysis for enterprise workload optimization. Utilize SQL Insights to identify patterns in SQL response time and execution plans using a curated set of long-term SQL statistics collected periodically.
The SQL Insights user experience is delivered as three interrelated dashboards that present pre-computed “insights” into fleet-wide SQL performance data. These dashboards help quickly identify the performance impact of SQL execution plan changes, cursor-sharing issues, and new SQL introduced in applications. The data visualized in dashboards further enables exploration and verification of the insights.
SQL Insights use cases
A DBA or Application Developer may be responsible for many applications executing thousands of SQL statements across numerous databases. SQL Insights proactively finds problem SQL and identifies tuning opportunities in large database deployments.
- Identify databases in the fleet in need of workload optimization
- Top databases by insights
- Fleet-wide workload decomposition by command type
- Aggregate SQL anomalies and characterize SQL workloads at the database level
- Widespread cursor invalidation events
- Workload decomposition by command type, module, and PL/SQL
- Cumulative impact of plan changes and cursor-sharing issues
- Identify individual SQL performance anomalies across the database fleet
- Plan changes affecting average latency
- Cursor-sharing issues
Fleet Analysis dashboard featuring top databases for SQL Insights
This dashboard presents an inventory of enabled databases and a global tree-map view of SQL across all databases, as well as top databases by insights and SQL performance measures.
Database Analysis dashboard featuring SQL Insights by database
This dashboard presents insights from a performance summary of all SQL statements collected from a database over time. It includes SQL activity over time broken down by command type and module, parsing and invalidations, and Top SQL by other important performance measures. Insights include the aggregated impact of plan changes, degrading SQL, new SQL, and cursor invalidation storms.
SQL Analysis dashboard featuring performance insights by SQL
This dashboard presents detailed insights and historical performance data for a given SQL per database. Performance measures include average latency, total database time, parsing activity, and I/O, and more. Insights include the detection of gradual performance degradation, plan change impacts, cursing sharing issues, and variable performance.
SQL Insights dashboard console experience
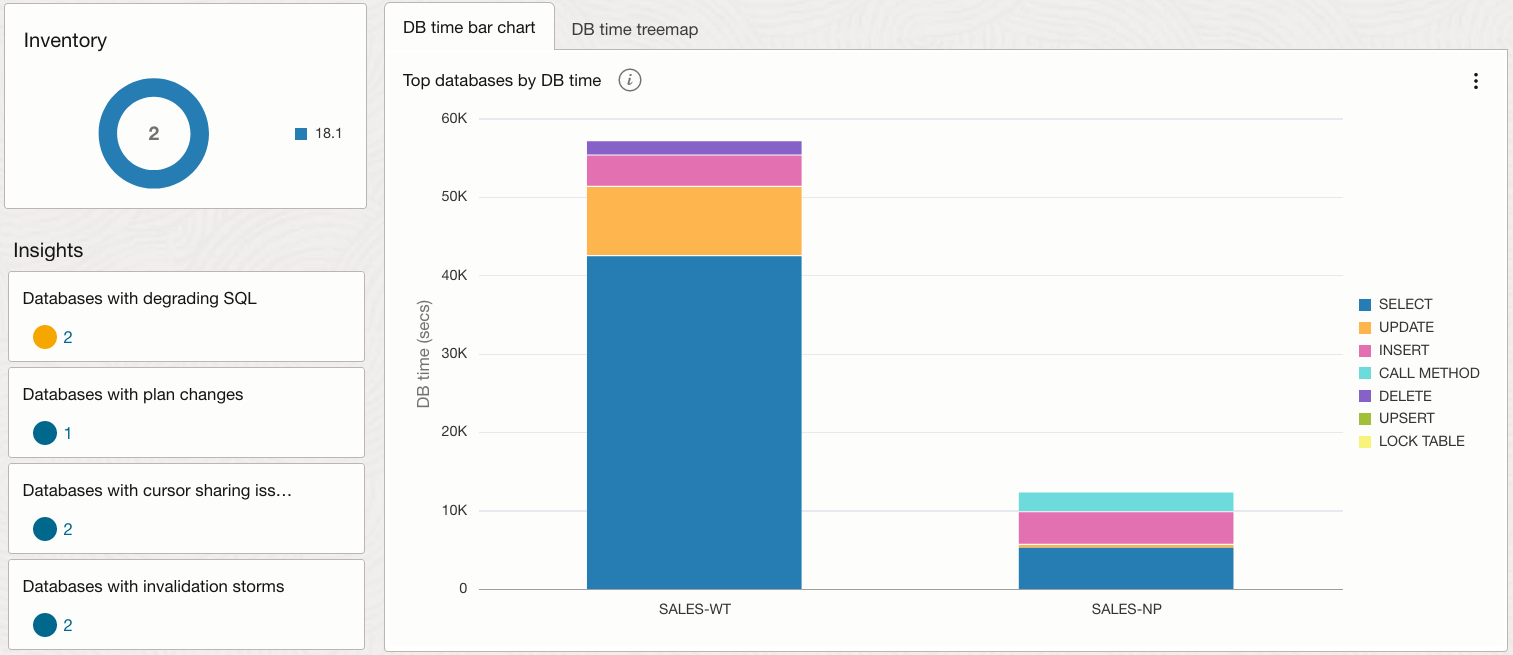
To access SQL Insights from the OCI Console, navigate to Observability & Management, then Operations Insights, and click on SQL Insights from the OPSI’s Overview page, which then lands you at the Fleet Analysis dashboard page (shown below). The Fleet analysis dashboard presents insights, data charts, and information about the entire set of databases enabled for Operations Insights within the selected compartment, which together comprises the “fleet”. It is a “roll up” of all the databases in the fleet and includes counts of databases with specific insights, top databases by insights, and a breakdown of DB time by database and SQL command.
Next, the Database Analysis dashboard can be either accessed directly by clicking on the Database Analysis menu item under SQL Insights or via in-context drill-down drill on the Fleet Analysis dashboard. The Database Analysis dashboard is designed to give a broad overview of the SQL workload executing in the database. This includes basic information about the database (version, cores, instances) and the SQL (unique and average daily counts) collected from the database. It also includes SQL Activity breakdowns of total time by command and module and the ratio of time in SQL or PL/SQL. Insight tiles at the database level quantify SQL by types of insights (degrading, degraded with plan changes, new, improving SQL, etc.). SQL activity is shown by day broken down by command type, exposing changes in workload over time. Execute to parse ratio and SQL count and invalidations charts expose important application workload characteristics over time.
Lastly, the SQL Insights dashboard is accessed as a drill-down from the other two dashboards i.e., Fleet Analysis or Database Analysis dashboards. The SQL analysis dashboard displays a full picture of the performance attributes of a given SQL_ID on a given database. This includes basic attributes like the command type and text of the statement as well as average latency, execution frequency, and numerous other metrics from V$SQLSTATS. Insight tiles indicate whether the SQL-level insights were true of the SQL_ID over the selected period. Daily charts of total DB time, average latency, and I/O enable a deeper examination of the relationship of SQL plans to resource usage.
Triaging database performance issues with SQL Insights Fleet analysis dashboard
Let’s say you’re an application developer for a couple of web apps used by customers all around the world. Recently, customers have reported slow response time from the sales application as well as issues with data not being persisted. On further investigation, it’s been narrowed down to an application performance issue to the Sales-WT database. One way to investigate such performance issues is to start with the SQL Insights Fleet analysis dashboard.
The dashboard below shows the two databases, i.e., SALES-WT and SALES-NP with degrading SQLs.
On further drill down to the SALES-WT database level dashboard, it is evident that 51 SQL statements have degraded over the last 30 days.
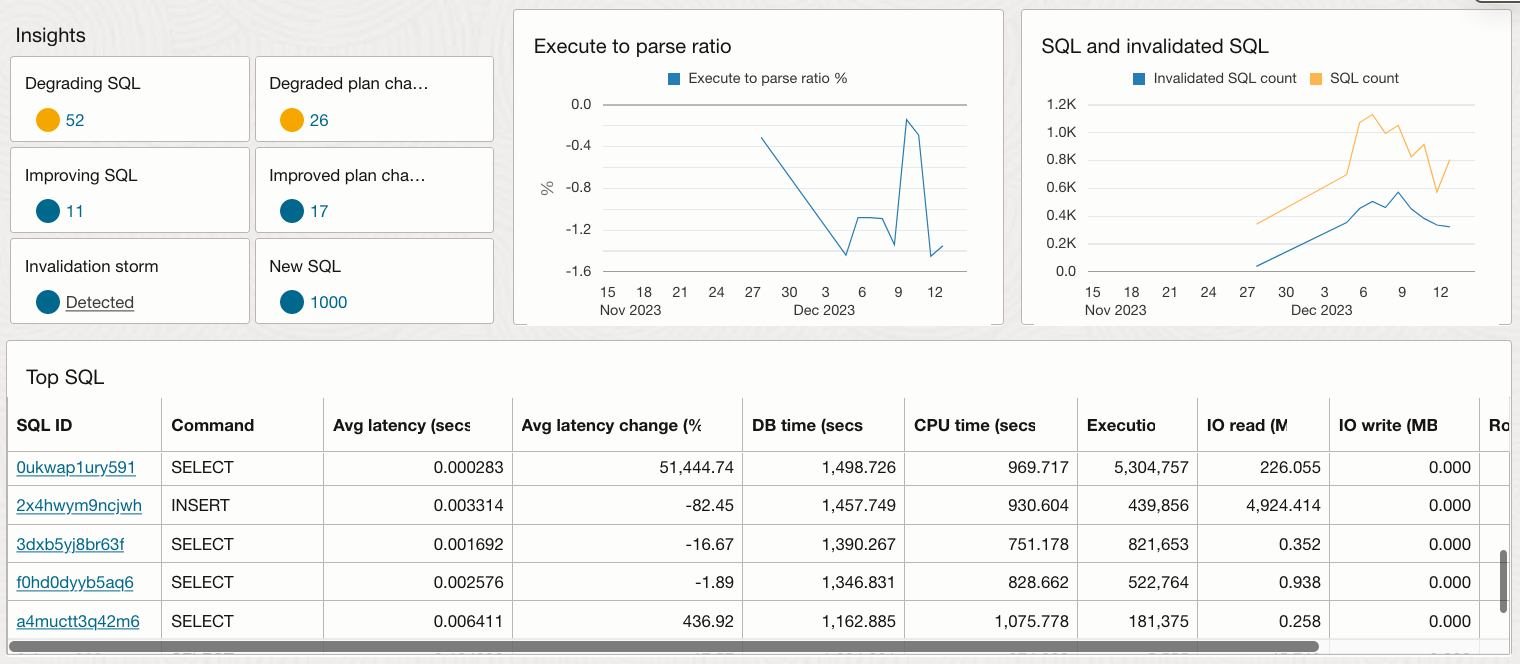
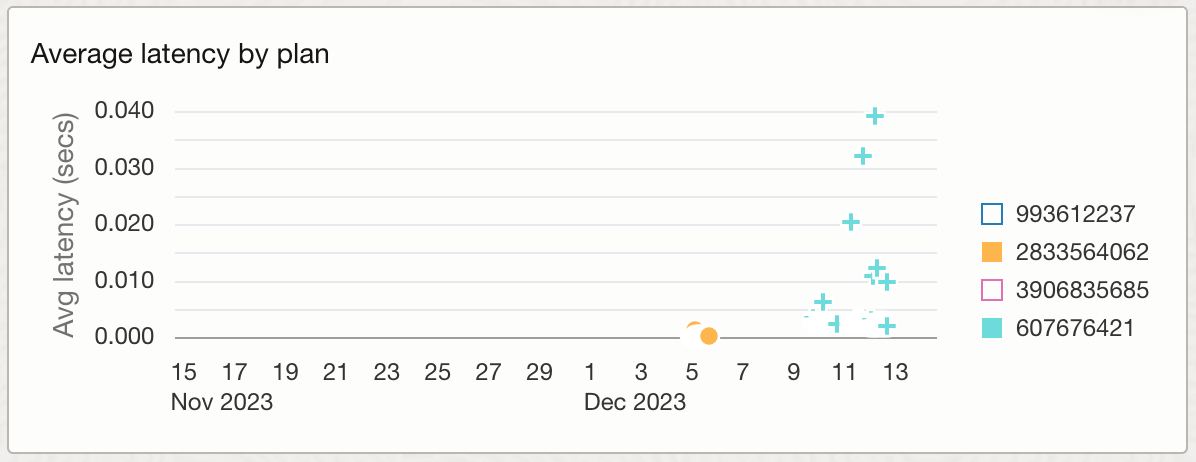
Based on the Top SQL table, the top culprit is narrowed down to “0ukwap1ury591” SQL SELECT statement’s average latency has degraded in the last 30 days. Clicking on the SQL of it, opens the SQL analysis dashboard to show the Average latency by plan widget. It clearly shows that the average latency for this SQL has shot up 3x in the past few days due to a plan change. Given the recent spike in average latency, you can also validate the same results using a complimentary application such as SQL Explorer where the same data can be visualized. Moreover, you can also see if the same SQL_ID has shown up in the ADDM Spotlight’s Recommendation tab as an SQL that needs to be triaged for performance. Lastly, if OCI Database Management service is enabled, you can also utilize the Performance Hub feature to drill down even further.
Availability
- This feature is available in all OCI commercial regions.
Get started today!
Find OPSI under the Observability and Management menu in the Oracle Cloud Console. The service is accessible through the Console, CLI, and REST API. OPSI is available to use with Autonomous Databases, external databases (Oracle Databases deployed on-premises), and Oracle Cloud Databases on bare metal, VMs, and Exadata Database Services on Dedicated Infrastructure and Exadata Cloud at Customer.
To test drive this feature and many other features in OPSI before even signing up for the service, try the demo mode using your tenancy or try demo mode by signing up for Livelabs.
Not yet a customer? Sign up for an Oracle Cloud Infrastructure trial account!
To learn more about other Operations Insights capabilities, visit:
- Oracle Cloud Observability and Management Platform
- Explore Operations Insights
- Hands-on lab: Get Started with Oracle Cloud Infrastructure Operations Insights
- Operations Insights Videos
- Operations Insights Technical Content
- Integrating Enterprise Manager with OCI Services
- Pricing
- Oracle Cloud Observability and Management Platform
- OPSI Technical Content
For more blogs on OPSI, visit the Observability and Management – OPSI blog space.
