


We’re introducing the OCI Observability MCP Server, which brings OCI observability data and investigation tools into your AI assistant. It gives developers, application owners, and operations teams a conversational way to investigate issues, understand application behavior, and develop findings backed by evidence from their environment.
You can explore errors and slow transactions, connect related activity across services, and capture findings in charts and reports through natural-language conversation. Reusable troubleshooting skills bring your team’s operational knowledge into the process, helping guide investigations and identify useful next checks.
It also provides guardrails to help you stay in control, including a read-only mode, confirmation for guarded changes, and an audit trail of tool activity.
What is the OCI Observability MCP Server?
The OCI Observability MCP Server acts as a bridge between your AI assistant and supported OCI observability capabilities. It uses Model Context Protocol (MCP), an open standard for connecting AI applications to external tools and data. You can connect through MCP-compatible applications, including CLI assistants, IDE assistants, and DevOps agents.
Your assistant selects from a defined set of tools. The server authenticates to OCI using its configured identity, applies its configured controls, calls the relevant service APIs, and returns the results for the assistant to analyze. Available data and actions depend on the enabled tools and OCI permissions.
The server exposes tools across four areas:
- Discover available data: Explore log sources and fields, understand what data is available, and check whether logs are arriving. Example tools include
list_log_sources,list_fields, andingestion_health. - Investigate and correlate: Run queries and connect related events using identifiers such as a host, request ID, or trace ID. Example tools include
run_query,pivot_on_entity, andtrace_request_id. - Visualize and report: Turn query results into charts and capture investigation findings, supporting evidence, and recommended next checks in a report. Example tools include
visualizeandgenerate_incident_report. - Save and monitor: Preserve useful queries, create dashboards, and configure alerts with the required permissions and confirmation. Example tools include
create_saved_search,create_dashboard, andcreate_alert.
For Log Analytics results, you can ask for the underlying query and continue exploring it in Log Explorer.

Skills: Bring Your Operational Knowledge into the Investigation
The server’s tools give your assistant ways to retrieve data and perform operations. Reusable troubleshooting skills guide how it combines those tools for a particular task.
A skill is a playbook that captures operational knowledge: which sources to examine, which checks to perform, how to connect related evidence, and what to include in the findings. It helps the assistant follow a consistent investigation process without requiring you to explain every step.
Example troubleshooting skills include:
- OKE incident commander: Investigates Kubernetes application issues and proposes fixes for human approval.
- EBS health review: Reviews Oracle E-Business Suite health through WebLogic errors, HTTP server failures, and database alerts.
- VCN flow security review: Examines network flow logs for suspicious traffic, rejected connections, and exposed endpoints.
- Fusion Applications health: Investigates failed jobs, integration errors, and sign-in problems.
- Slow transaction root cause: Examines slow transaction spans and related logs to investigate delays.
These skills make troubleshooting knowledge reusable across investigations. You can adapt them to your applications, known failure patterns, and reporting needs, helping the assistant present findings with supporting evidence and identify questions that remain.
From a Question to an Investigation
In this example, we used Codex connected to the OCI Observability MCP Server to investigate payment failures in an e-commerce demo application running on OCI. Through three conversational prompts, we compared time periods, followed an affected request, and summarized the evidence and recommended next checks.
We began with:
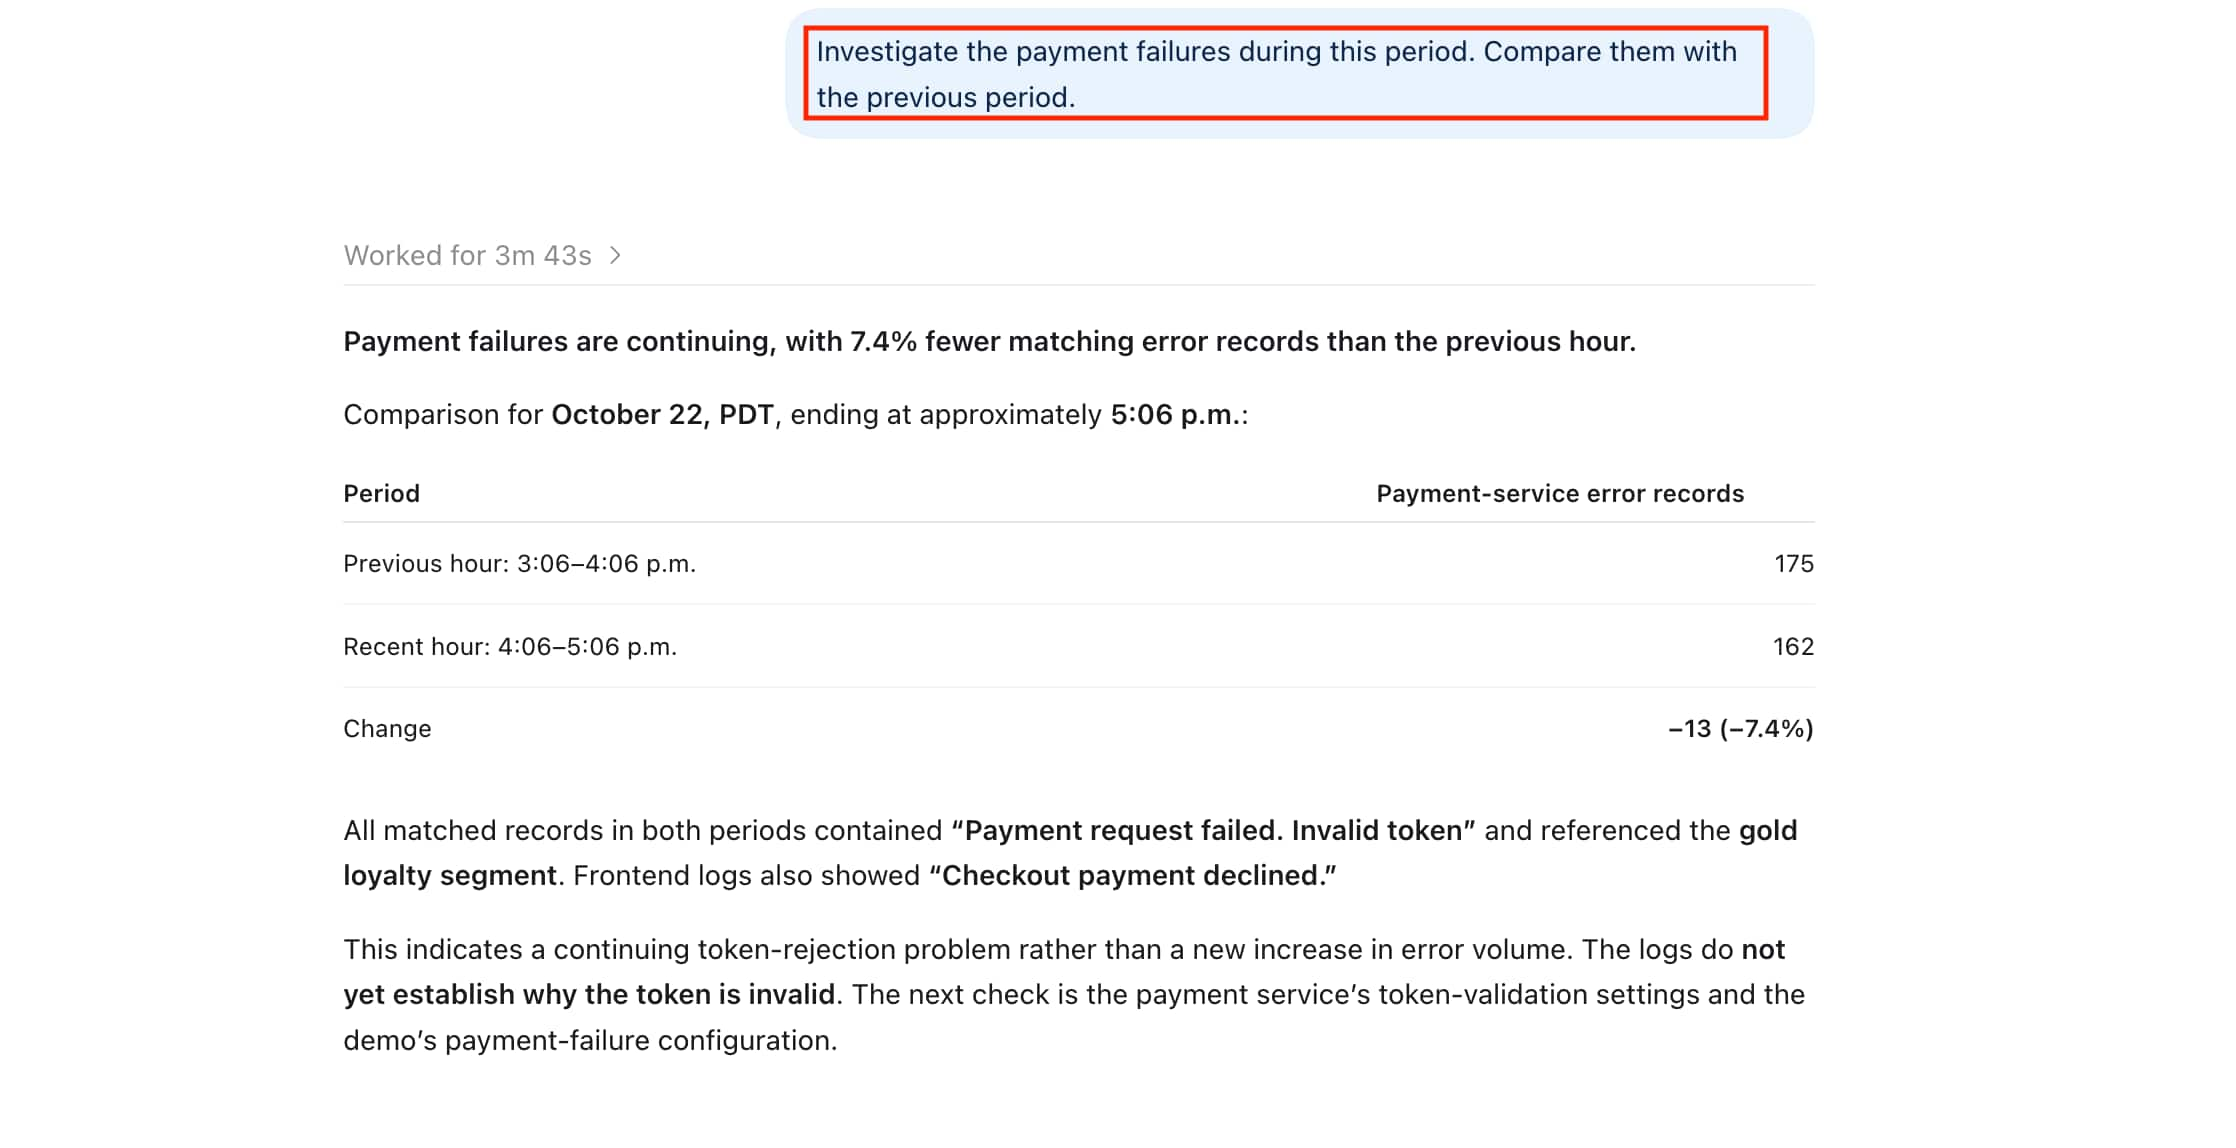
Investigate the payment failures during this period. Compare them with the previous period.
Codex queried the application logs and compared two consecutive one-hour windows. It found 162 matching payment-error records, compared with 175 in the preceding hour and a 7.4% decrease. All matching errors in both periods referenced an invalid token and the gold loyalty segment.
The comparison showed that the error pattern was continuing, even though its volume had decreased.
We then asked:
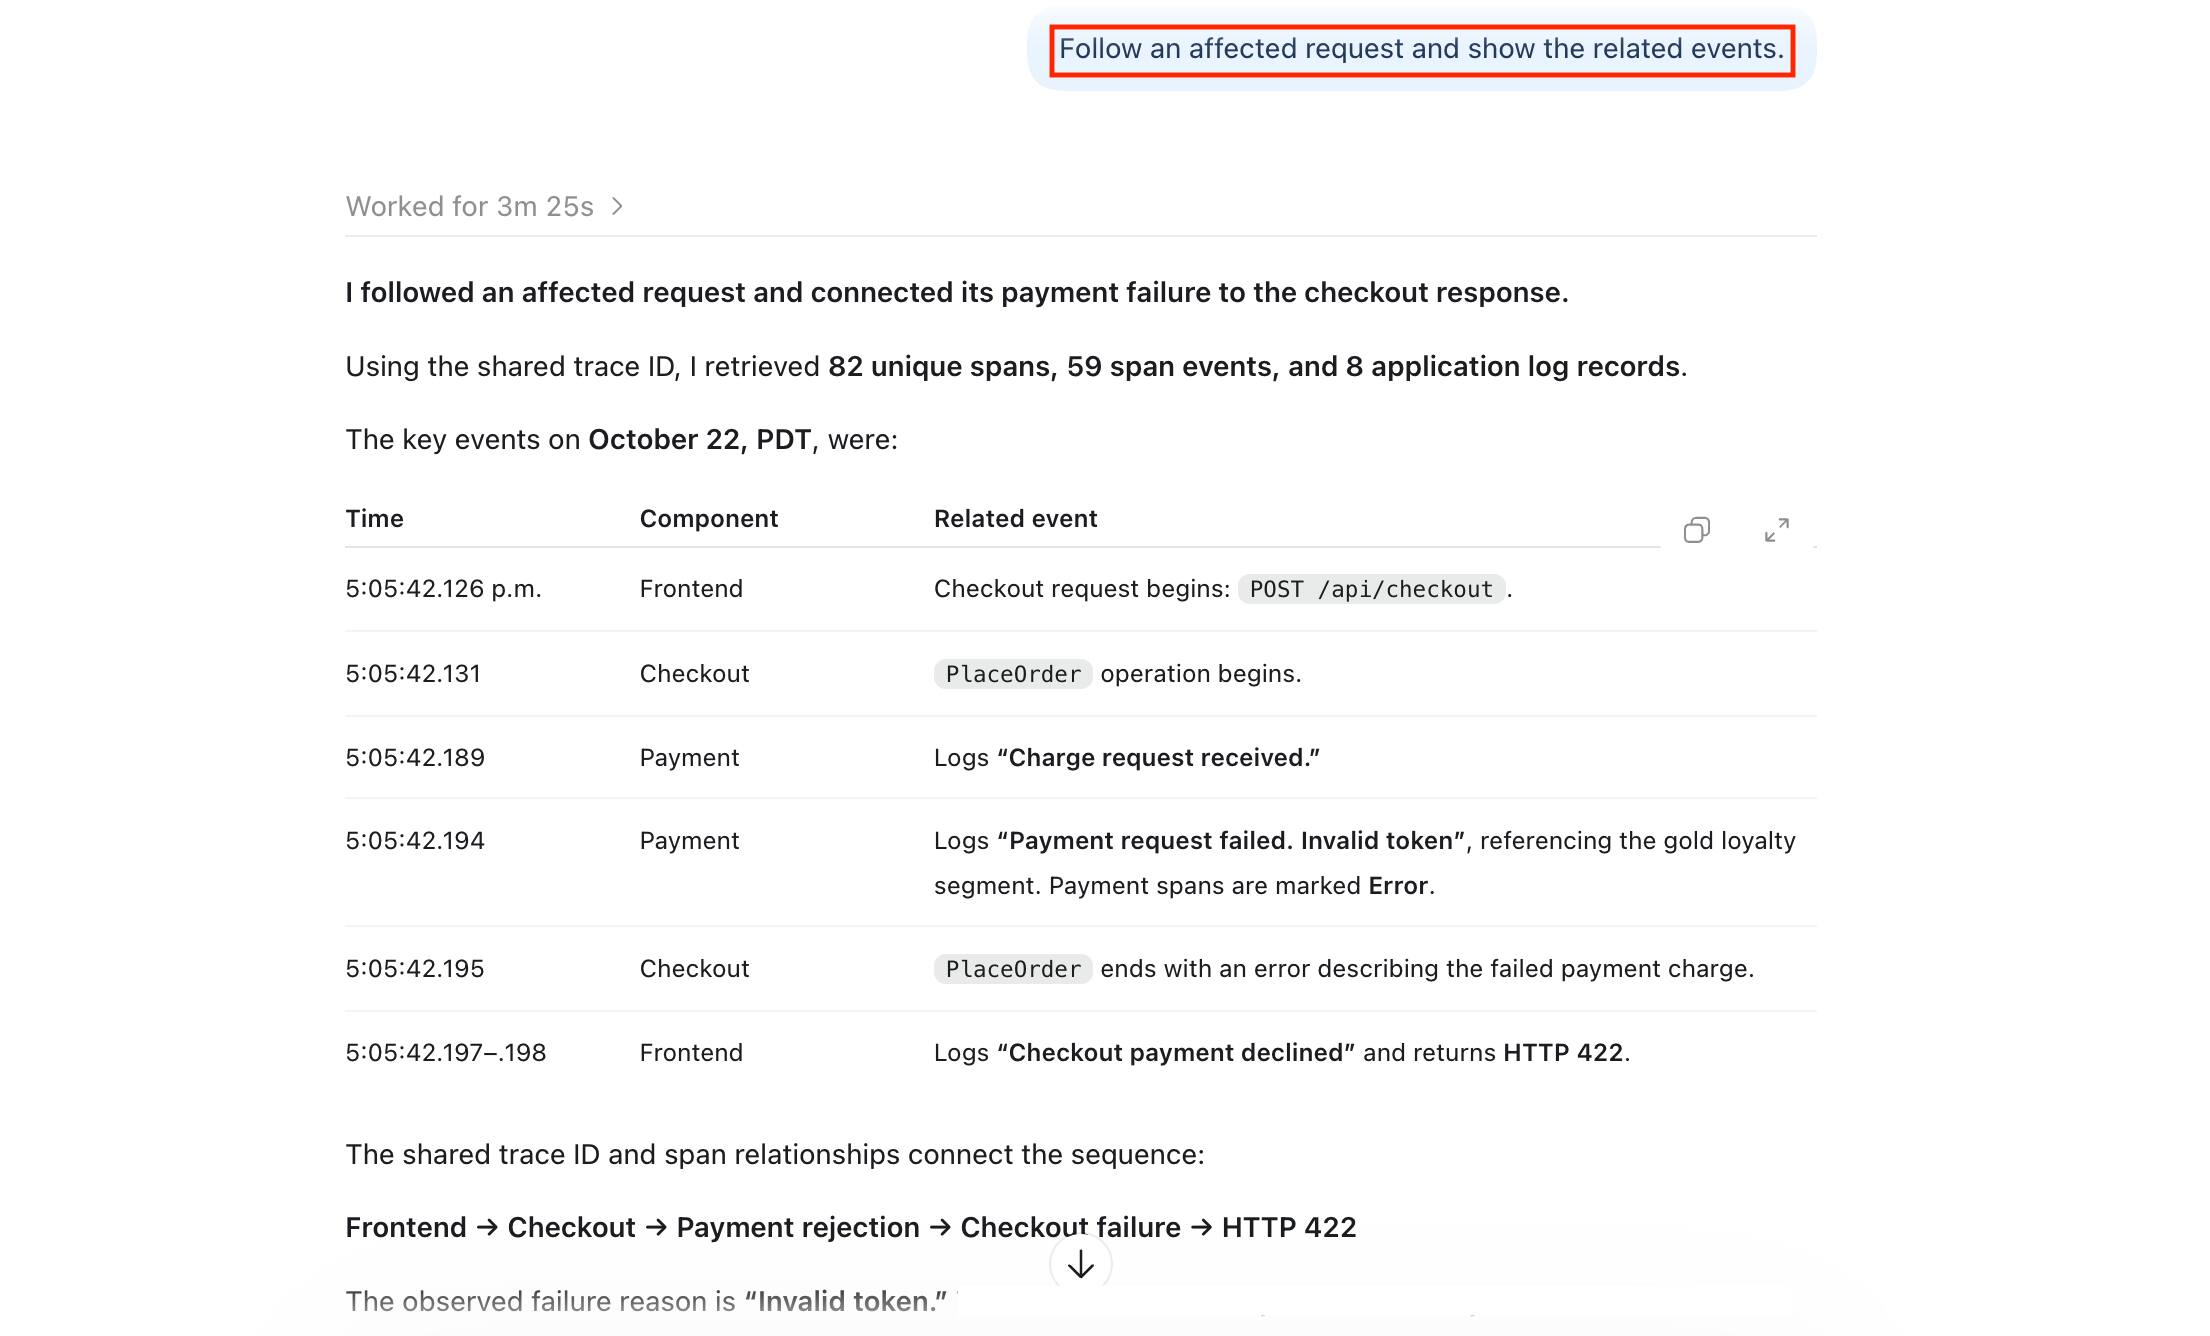
Follow an affected request and show the related events.
Using a shared trace ID, our MCP Server connected activity across the frontend, checkout, and payment services. The evidence showed the payment service rejecting a token, followed by a checkout failure and an HTTP 422 response to the frontend request.
In this demonstration, the trace evidence came from APM Signals ingested into Log Analytics, alongside the application logs. Connecting these records helped explain how the payment-service error appeared in the checkout experience.
Finally, we asked:
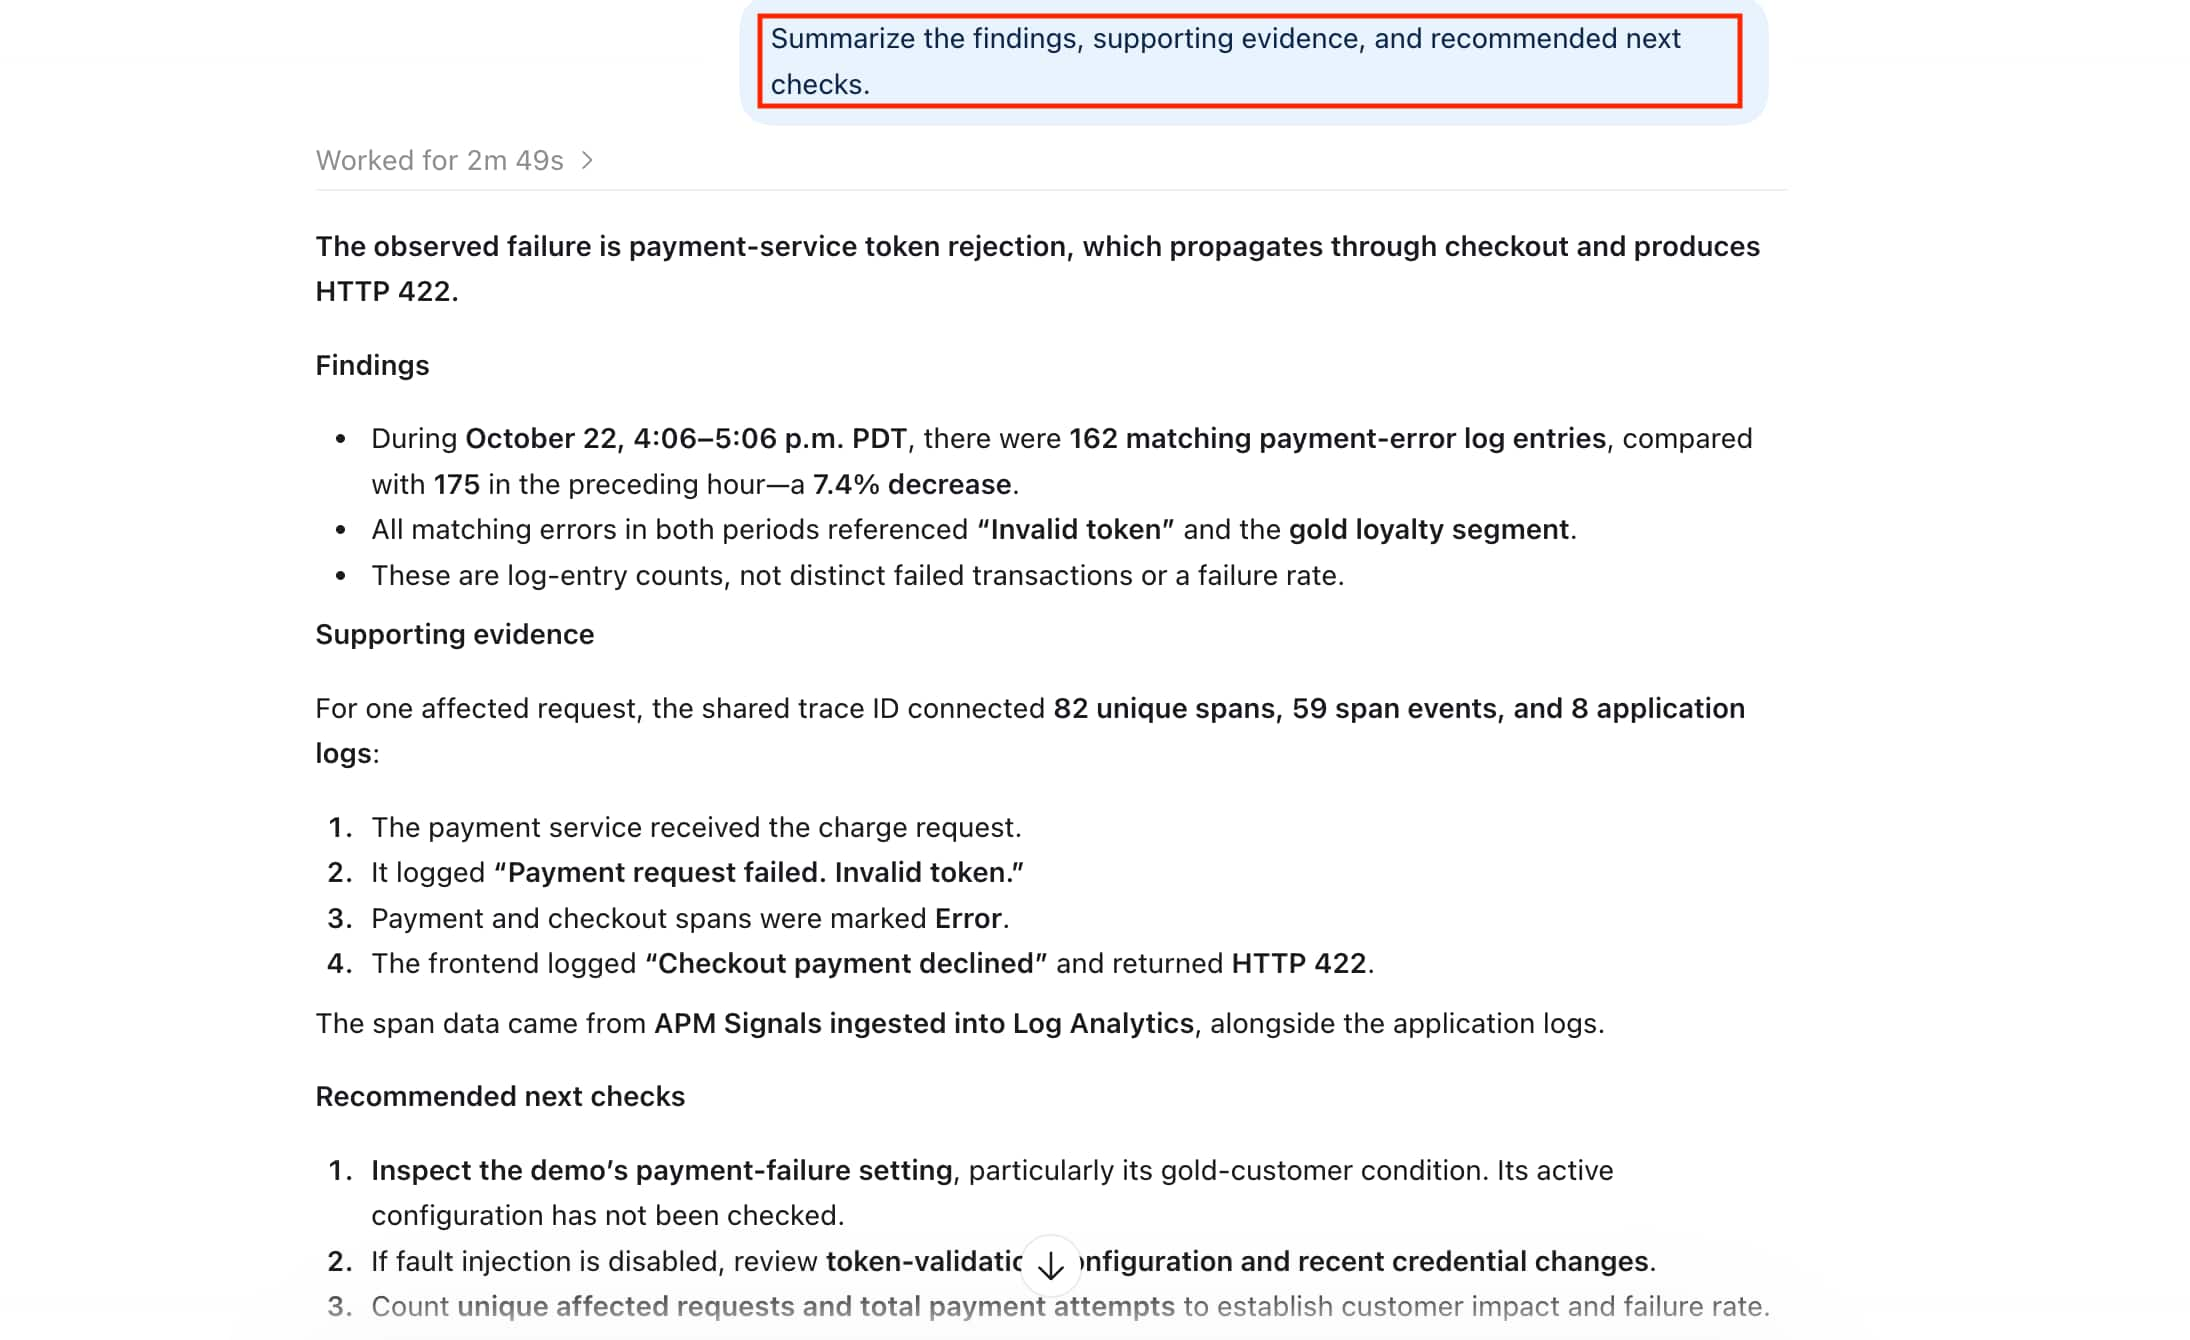
Summarize the findings, supporting evidence, and recommended next checks.
The recommended next checks were to inspect the demo’s payment-failure configuration, review token-validation settings if fault injection was disabled, and count unique affected requests and total payment attempts to establish impact and failure rate.
The conversation produced a summary of what was observed, the evidence supporting it, and what still needed investigation.
Guardrails to Stay in Control
The OCI Observability MCP Server combines OCI permissions with server-side controls to govern access to data and changes to resources.
- OCI permissions: Access follows the permissions assigned to the server’s configured OCI identity, defining which resources it can read or manage.
- Read-only mode: You can enable read-only mode to query and analyze data while blocking changes to OCI resources.
- Confirmation for guarded changes: Actions such as creating dashboards, creating saved searches, or configuring alerts require a separate confirmation step, allowing you to review the proposed action before execution.
- Audit trail: Tool activity is recorded so you can review requested operations and their outcomes.
For your first investigation, you can begin in read-only mode and examine the evidence returned by the assistant. When you need to create or change resources, review the proposed changes before confirming them.
Get started with your first investigation
Connect the OCI Observability MCP Server to your preferred MCP-compatible AI assistant and configure access to the OCI environment you want to explore. Begin with a familiar application or service and a focused question about its behavior.
The MCP server gives your assistant access to OCI data and tools, helping it move from general troubleshooting guidance to investigations grounded in evidence from your environment.
You can ask the assistant to investigate errors, examine slow transactions, or compare activity across time periods. Follow up on the findings, inspect the supporting evidence, and capture useful results for review or reuse.
Visit the project repository for setup instructions, configuration guidance, and available tools.