

When a Kubernetes application fails, the first challenge is determining whether the issue originates in a workload, a node, or an individual pod. By the time the investigation begins, the affected pod may already have restarted or been replaced, making retained logs and events essential sources of evidence.
Oracle Log Analytics provides Oracle-defined dashboards that help you understand the environment, identify potential issues, and inspect workloads, nodes, and pods. These dashboards provide a starting point for investigation without requiring you to build every query and visualization yourself.
Operational question: Which pod is failed, pending, or generating unusual activity?
Recommended dashboard: Kubernetes Pods
Primary takeaway: Pod status, events, scheduling context, and log distribution
Operational question: Where should we investigate first?
Recommended dashboard: Kubernetes Cluster Summary-Potential Issues
Primary takeaway: Potential issues organized by time, frequency, log source, node, and pod
Operational question: What is happening across the Kubernetes environment?
Recommended dashboard: Kubernetes Cluster Summary-Overview
Primary takeaway: Cluster-wide resource state, log distribution, events, and trends
Operational question: Is node health, capacity, or pod placement contributing to a problem?
Recommended dashboard: Kubernetes Nodes
Primary takeaway: Node readiness, pressure, configuration, capacity, and pod distribution
Operational question: Is an application rollout or workload operating as intended?
Recommended dashboard: Kubernetes Workloads
Primary takeaway: Desired, ready, available, scheduled, and completed workload states
Understand the Environment with Cluster Summary-Overview
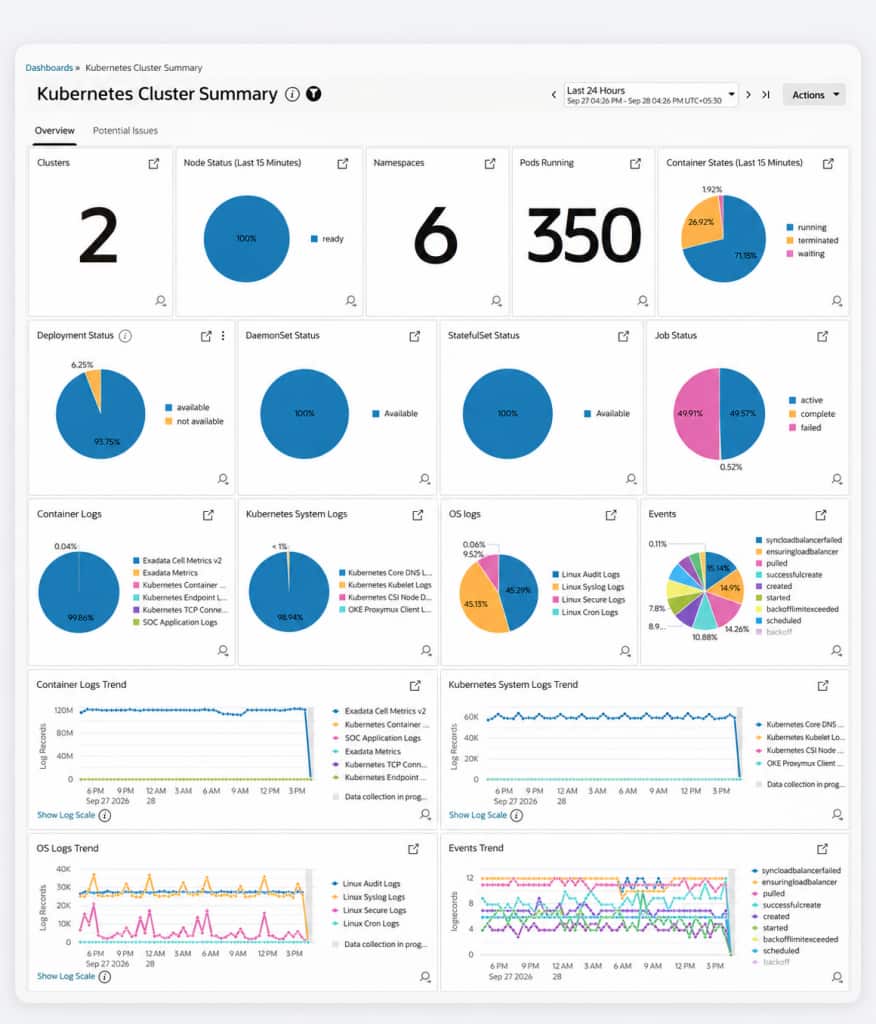
The Overview tab provides a cluster-wide operational summary. It combines:
- Cluster, namespace, and running-pod counts
- Recent node and container states
- Deployment, DaemonSet, StatefulSet, and Job status
- Container, Kubernetes system, OS, and event-log distribution
- Historical log and event trends
Use it when the scope of a change or incident is unclear. It can show whether increased activity is confined to application containers or accompanied by Kubernetes system, OS, or event signals. To refine your view, use the Scope Filter to select the exact cluster for which you want to view the summary and potential issues.
Example scenarios
- Online retail: Seasonal spikes, checkout activity
- SaaS: Multi-namespace scope, tenant isolation
- Financial services: Transaction and platform context
- AI and analytics: Workload and system activity
Prioritize Signals with Cluster Summary-Potential Issues
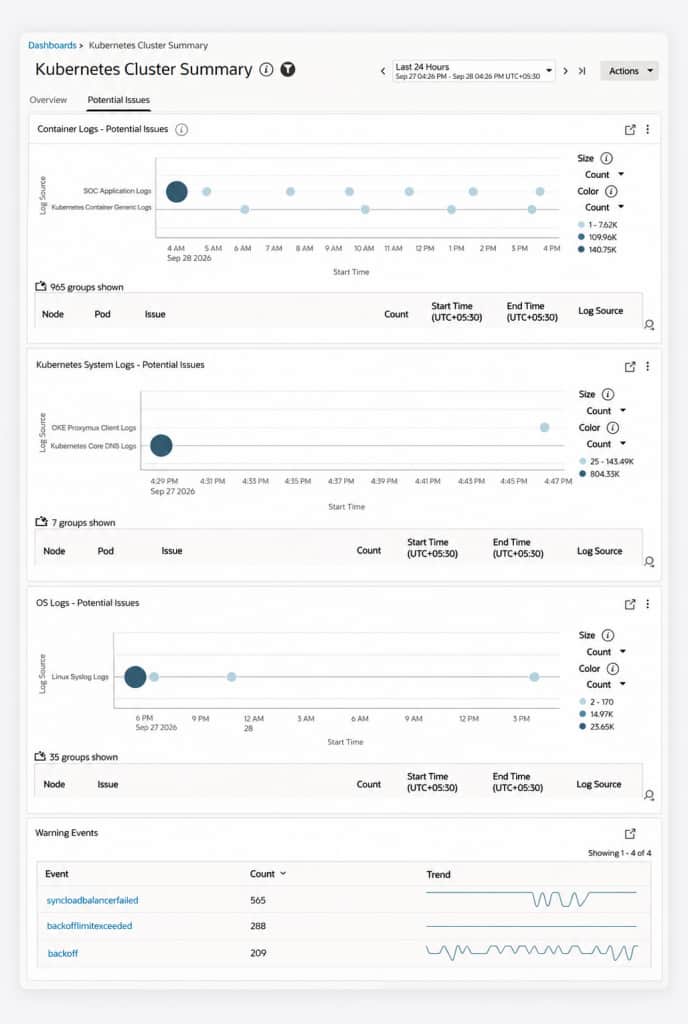
The Potential Issues tab highlights suspicious activity across:
- Container logs
- Kubernetes system logs
- OS logs
- Kubernetes warning events
Its visualizations show when potential issues occurred, their frequency, and the originating log sources. Tables add affected nodes or pods, issue samples, occurrence counts, and start and end times. To refine your view, use the Scope Filter to select the exact cluster for which you want to view the summary and potential issues.
Example scenarios
- Payments: Intermittent failures, cross-layer correlation
- Telecommunications: Recurring versus isolated signals
- Web applications: Repeated error patterns
- Shared platforms: Common node or pod causes
Validate Application State with Kubernetes Workloads
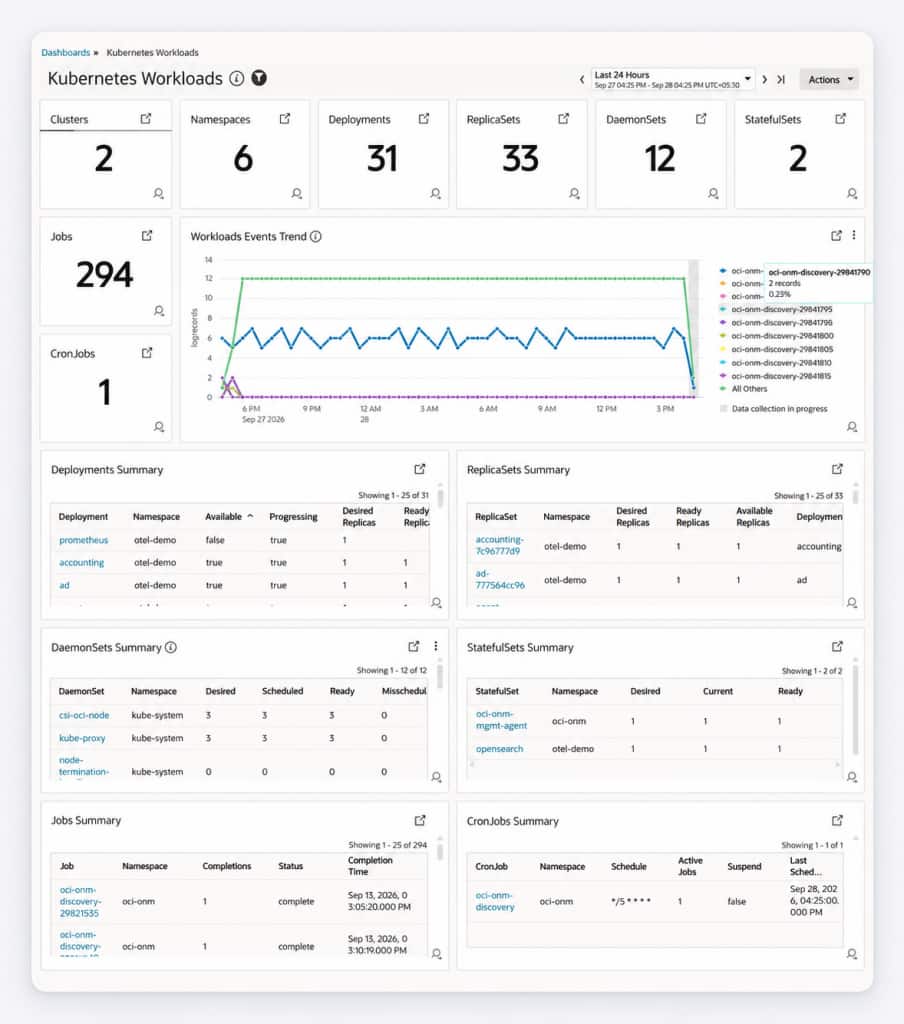
The Kubernetes Workloads dashboard covers Deployments, ReplicaSets, DaemonSets, StatefulSets, Jobs, and CronJobs. It combines resource counts, an events trend, and summaries of desired, scheduled, ready, available, or completed states. To refine your view, use the Scope Filter to select the exact cluster and namespace for which you want to view the workload details.
Typical questions include:
- Did a rollout reach its desired replica count?
- Are all expected StatefulSet instances ready?
- Are DaemonSets scheduled across the required nodes?
- Did a Job complete?
- Is a CronJob active, suspended, or delayed?
Example scenarios
- Web applications: Deployment and replica readiness
- Stateful services: Current and ready instances
- Platform services: DaemonSet coverage
- Data pipelines: Job completion, CronJob schedules
- CI/CD: Post-release workload events
Investigate Infrastructure with Kubernetes Nodes
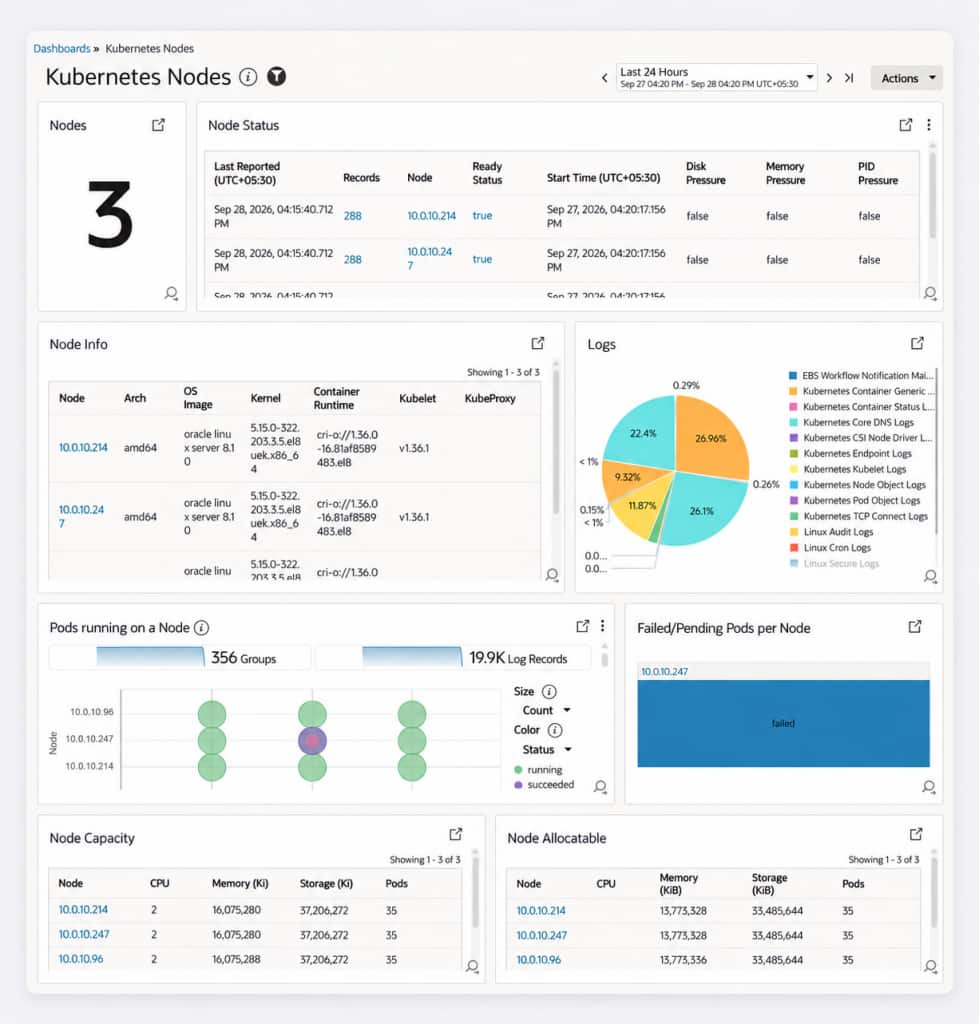
The Kubernetes Nodes dashboard brings together node health, configuration, capacity, and workload placement. It includes:
- Readiness and pressure conditions
- OS, kernel, container runtime, kubelet, and kube-proxy information
- Node-related log distribution
- Pods running on each node
- Failed or pending pods by node
- Capacity and allocatable resources
Use it when pods from different applications fail on the same node, new pods cannot be scheduled, or node capacity may be affecting a workload. To refine your view, use the Scope Filter to select the exact cluster and worker nodes for which you want to view the details.
Example scenarios
- Retail: Peak-readiness planning
- AI and machine learning: Resource availability, workload concentration
- Telecommunications and edge: Localized node conditions
- Regulated environments: Software-version consistency
- Shared platforms: Cross-application node failures
Examine Runtime Instances with Kubernetes Pods
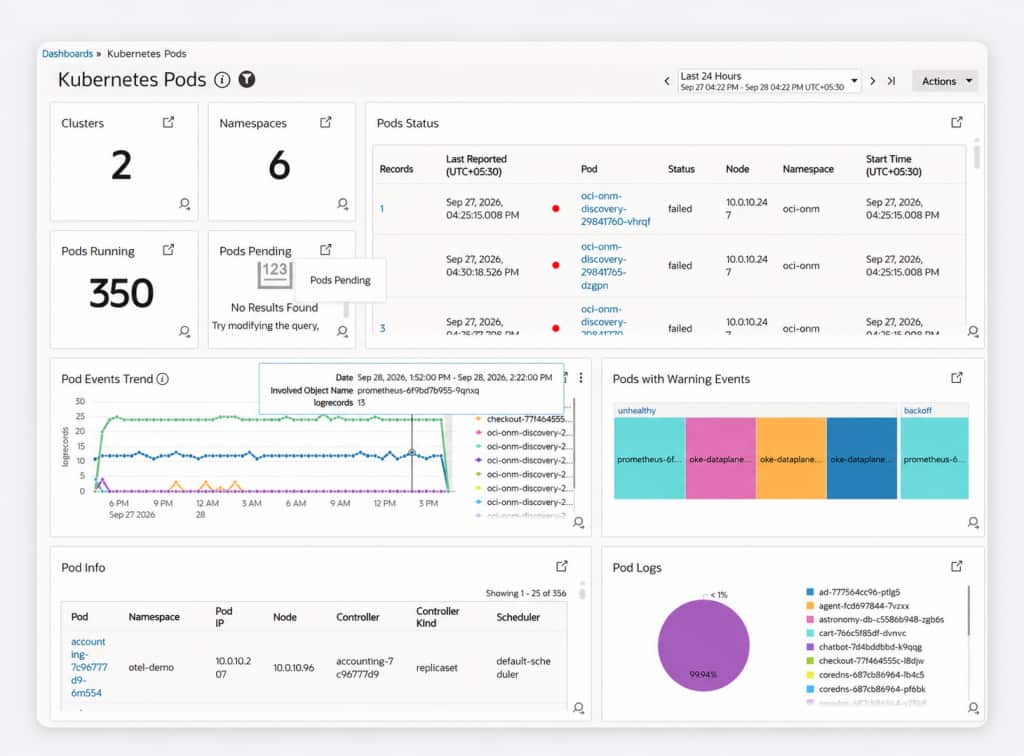
The Kubernetes Pods dashboard provides the most granular view. It shows running and pending counts, individual pod status, warning events, event trends, scheduling information, controller relationships, and log distribution.
It can help teams:
- Identify a failed replica
- Distinguish pending from failed pods
- Locate node-specific warnings
- Find pods generating unusual log volumes
- Trace a pod to its controller and workload
To refine your view, use the Scope Filter to select the exact cluster and namespace for which you want to view the pod details.
Example scenarios
- Microservices: Individual replica failures
- Media and streaming: Distributed pod warnings
- Batch processing: Pending versus failed execution
- Customer-facing services: Pod-specific error volume
- Platform engineering: Scheduling and controller context
Investigate Current and Historical Conditions
Kubernetes resources change quickly. Pods are replaced, Jobs finish, nodes recover, and deployments move to new states. The current environment may no longer contain the evidence needed to explain an earlier incident.
The dashboards can display the historical Kubernetes log information available in Oracle Log Analytics for the selected time range. Teams can use it to:
- Reconstruct incidents after pods have been replaced
- Compare activity before and after a release
- Analyze completed Jobs and CronJobs
- Find recurring warning or error patterns
- Correlate application, Kubernetes system, OS, and event activity
Widgets explicitly labeled Last 15 Minutes provide recent-state context, while trend and potential-issue visualizations support broader historical analysis.
Customize Without Starting Over
Oracle-defined dashboards provide a ready-to-use baseline. They cannot be edited directly, but customers can duplicate them and customize the copies.
Common customization targets include:
- Business-critical namespaces
- Production and development environments
- Application-specific log sources
- Workload types such as StatefulSets or Jobs
- Peak-period and release-related trends
Teams can adapt an existing Kubernetes view instead of starting with a blank dashboard.
Use the Dashboards Together When an Issue Crosses Layers
Each dashboard can be used independently. A failed scheduled process might lead directly to Kubernetes Workloads, a capacity problem to Kubernetes Nodes, and an unhealthy replica to Kubernetes Pods.
When the scope is uncertain or the evidence crosses multiple layers, teams can apply a broader troubleshooting pattern:
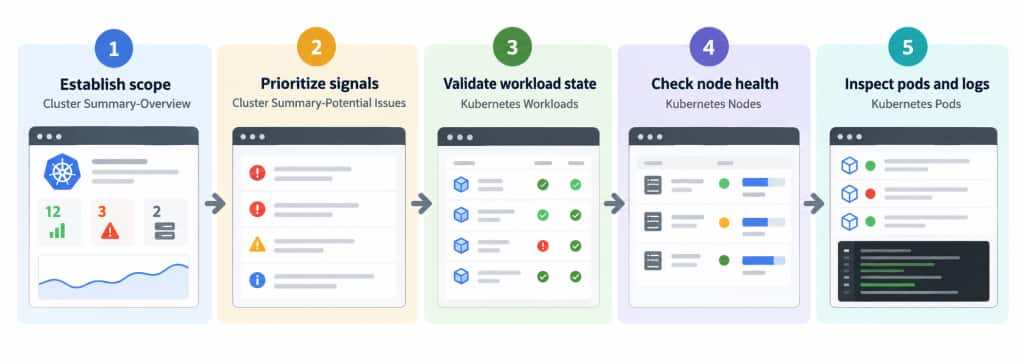
- Establish scope with Cluster Summary-Overview.
- Prioritize signals with Cluster Summary-Potential Issues.
- Validate the workload’s intended and actual state.
- Check supporting nodes for health and capacity conditions.
- Inspect the affected pods and associated logs.
This is an analytical pattern, not a required navigation sequence. Teams can begin with the dashboard closest to their question and bring in other dashboards as the evidence expands. For example, if a potential issue is noticed in the Cluster Summary-Potential Issues dashboard, you can drill down the issue by visiting the Kubernetes Nodes and Kubernetes Pods dashboards and filtering your search for specific cluster, node, or pod.
Oracle Log Analytics gives application developers, SREs, platform teams, and infrastructure administrators a shared set of ready-to-use Kubernetes views while preserving the flexibility to choose the dashboard that best matches the task.
For more information, see the Oracle documentation for the Kubernetes Monitoring Solution and Oracle-defined dashboards for Log Analytics.