
Exawatcher VMStat logs contain dense numeric system metrics mixed with headers, sample markers, and repeated column labels. This structure makes the raw logs difficult to analyze directly in Oracle Log Analytics.
This walkthrough shows how to use parser functions and source-level data filters to transform the numeric Exawatcher VMStat rows into timestamped, structured log records for search, analysis, and visualization.
Although the example focuses on Exawatcher VMStat, the same approach can be applied to other log formats where useful data is embedded within repeated sections, headers, or mixed content.
Example Exawatcher VMStat Log
The following sample uses May 2026 timestamps:
############################################################
# Starting Time:        05/11/2026 02:07:55
# Sample Interval(s):   5
# Archive Count:        720
# Collection Module:    VmstatExaWatcher
# Collection Command:   /usr/bin/vmstat  5  2
############################################################
zzz <05/11/2026 02:07:55> Count:0
procs -----------memory---------- ---swap-- -----io---- --system-- -----cpu-----
 r  b   swpd   free   buff  cache   si   so    bi    bo   in   cs us sy id wa st
 1  0      0 28826708 792788 12473196    0    0     2    15    0    0  3  1 96  0  0
 0  0      0 28883436 792788 12473444    0    0     4   212 8103 12800  3  0 97  0  0
zzz <05/11/2026 02:08:00> Count:1
procs -----------memory---------- ---swap-- -----io---- --system-- -----cpu-----
 r  b   swpd   free   buff  cache   si   so    bi    bo   in   cs us sy id wa st
 0  0      0 28883436 792788 12473444    0    0     2    15    0    0  3  1 96  0  0
 0  0      0 28883436 792788 12473628    0    0     6    99 6970 12419  1  0 99  0  0
zzz <05/11/2026 02:08:05> Count:2
procs -----------memory---------- ---swap-- -----io---- --system-- -----cpu-----
 r  b   swpd   free   buff  cache   si   so    bi    bo   in   cs us sy id wa st
 0  0      0 28883932 792788 12473628    0    0     2    15    0    0  3  1 96  0  0
 0  0      0 28890564 792788 12473808    0    0     2    59 6652 12126  0  0 99  0  0
The objective is to extract only the six numeric metric rows as log entries. The header rows, sample marker rows, and repeated column headings are useful during parsing, but they should not become final log records.
Create the Parser
In the OCI Console, open the navigation menu. Select Observability & Management. Under Log Analytics, select Administration. In the Administration navigation pane, select Parsers, and then select Create.
Select Regex Type. The Create Parser page opens in Guided mode by default. Switch to Advanced mode so that you can enter the regular expression directly.
| Field | Value |
|---|---|
| Name | Exawatcher VMStat Format |
| Type | Regex Type |
| Mode | Advanced mode |
| Log Record Span | One line per entry |
| Example Log Content | Paste the May 2026 VMStat sample log |
| Parse Expression | Use the regular expression shown below |
The regular expression used for parsing:
{TIMEDATE}\s+(\d+)\s+(\d+)\s+(\d+)\s+(\d+)\s+(\d+)\s+(\d+)\s+(\d+)\s+(\d+)\s+(\d+)\s+(\d+)\s+(\d+)\s+(\d+)\s+(\d+)\s+(\d+)\s+(\d+)\s+(\d+)\s+\d+\s*\[Sample:(\d+)\]\s\[mod:([^\]]+)\]\s\[cmd:\s*([^\]]+)\]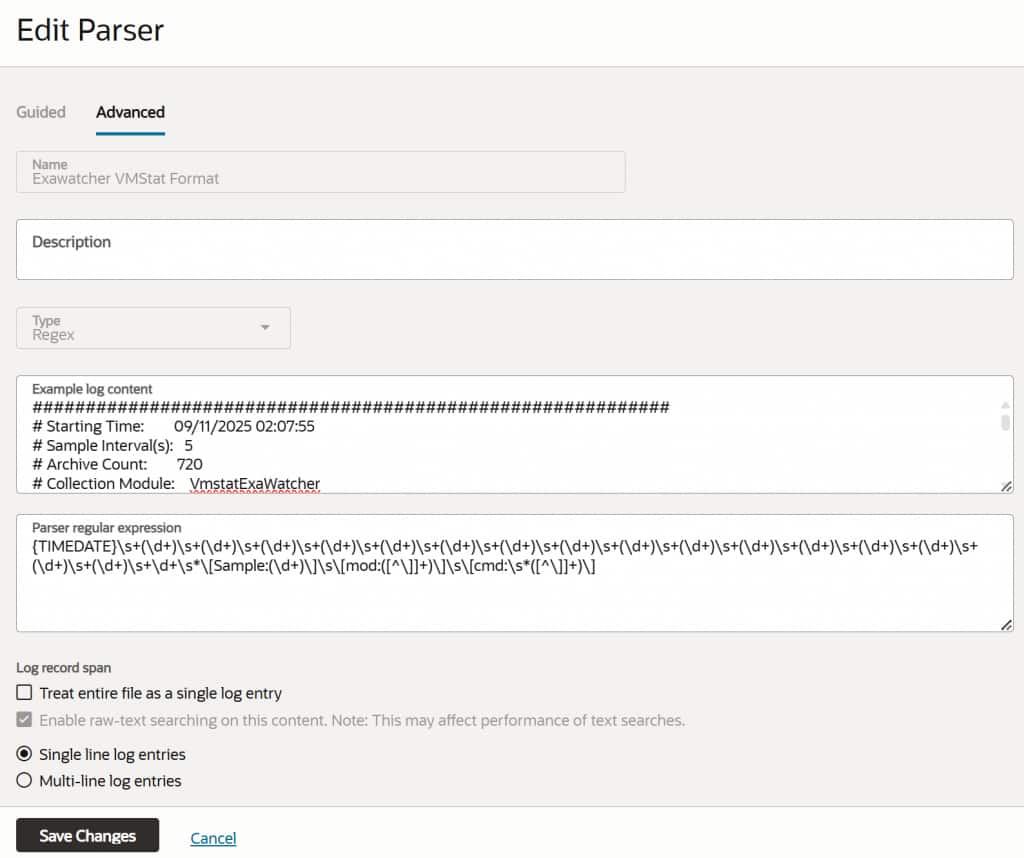
Map the captured groups to these fields in order:
| Group | VMStat value | Oracle Log Analytics field |
|---|---|---|
| 1 | r | Processes Waiting Run |
| 2 | b | Processes Sleeping |
| 3 | swpd | Swap Space Used |
| 4 | free | Memory Available |
| 5 | buff | Buffer Memory Used |
| 6 | cache | Cache Memory Used |
| 7 | si | Swap In/Second |
| 8 | so | Swap Out/Second |
| 9 | bi | Blocks In/Second |
| 10 | bo | Blocks Out/Second |
| 11 | in | Interrupts/Second |
| 12 | cs | Context Switches/Second |
| 13 | us | CPU User Time (%) |
| 14 | sy | CPU System Time (%) |
| 15 | id | CPU Idle Time (%) |
| 16 | wa | CPU IO Wait Time (%) |
| 17 | Sample value | Sequence |
| 18 | Header value | Module |
| 19 | Header value | Command |
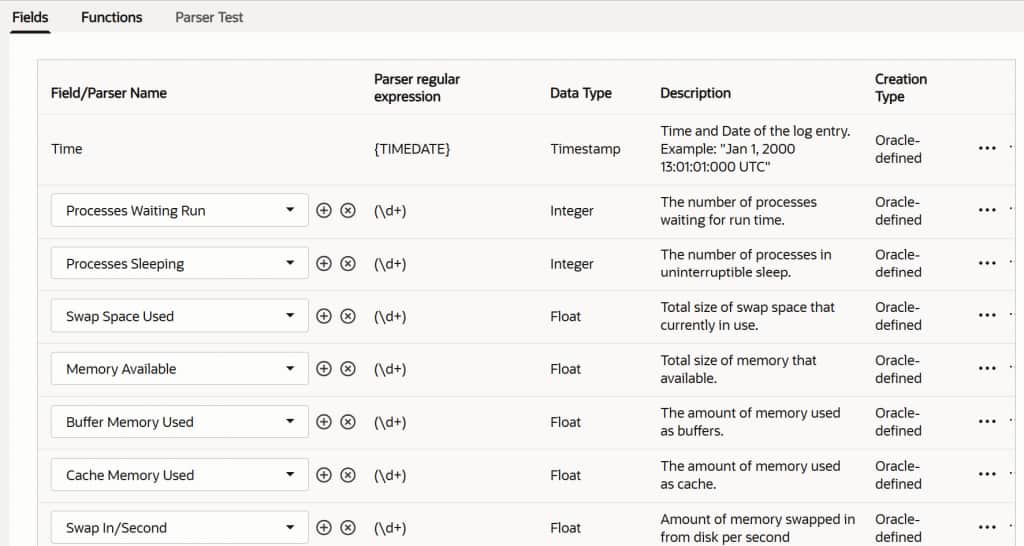
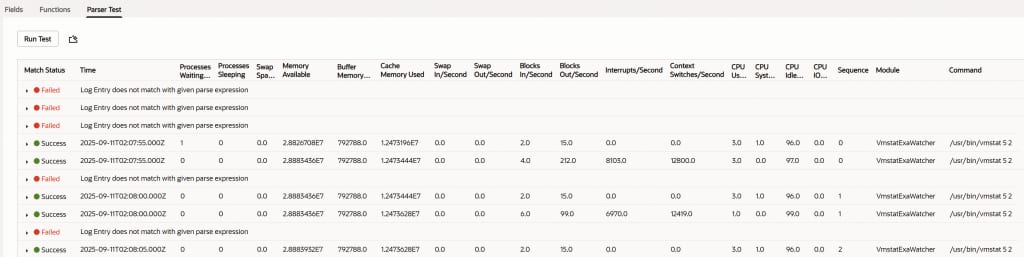
At this point, the parser test will not yet succeed for the metric rows. The original VMStat rows do not contain all the information expected by the parse expression. The next step adds parser functions that enrich each numeric row before parsing.
Add Parser Functions
Parser functions copy important context from the timestamp and header rows onto each numeric metric row. This lets each metric row become a complete standalone log record.
Create the following functions from the parser’s Functions tab.
| Function name | Purpose | Value to enter |
|---|---|---|
copy interval number | Captures the Count value from the zzz sample marker row and appends it to each numeric metric row as the sample sequence. This preserves the sample interval number after the original sample marker row is filtered out. | Function: find replaceCatch Expression: zzz\s\<\d+/\d+/\d+\s\d+:\d+:\d+\>\sCount:(?<cnt>\d+)Find Expression: ^\s+\d+.*($)\nReplace String: [Sample:(cnt)] |
copy module | Captures the collection module from the file header and appends it to each numeric metric row. This keeps the module value available on every parsed record instead of leaving it only in the header. | Function: find replaceCatch Expression: \#\sCollection\sModule:\s+(?<module>VmstatExaWatcher)Find Expression: ^\s+\d+.*($)\nReplace String: [mod:(module)] |
copy command | Captures the collection command from the file header and appends it to each numeric metric row. This preserves the command used to collect the VMStat data after the header rows are removed. | Function: find replaceCatch Expression: \#\sCollection\sCommand:\s(?<cmd>.*)\nFind Expression: ^\s+\d+.*($)\nReplace String: [cmd:(cmd)] |
copy timestamp | Captures the timestamp from each zzz sample marker row and inserts it at the beginning of the numeric metric rows that belong to that sample. This makes each metric row independently parseable as a timestamped log entry. | Function: find replaceCatch Expression: zzz\s+\<(?<timestr>\d+/\d+/\d+\s\d+:\d+:\d+)\>\s+\S+Find Expression: (^)\s+\d+\s+\d+.*Replace String: (timestr) |
Note: The replace strings for the functions copy interval number, copy command, and copy module have a space character at the beginning.
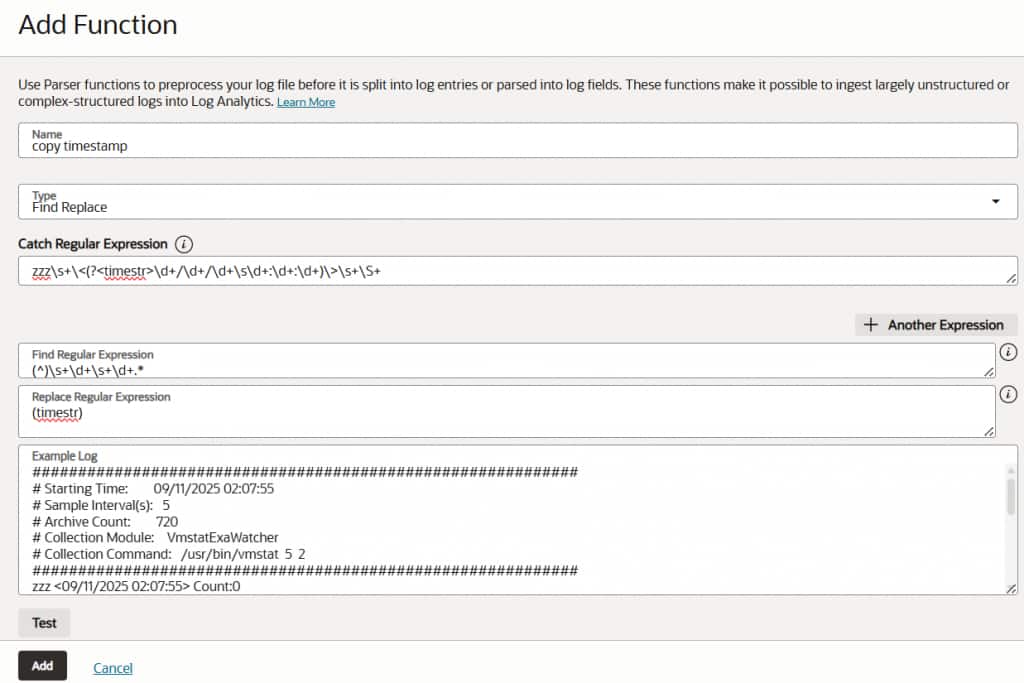
After creating the functions, arrange them in this order:
| Order | Function name | Reason |
|---|---|---|
| 1 | copy interval number | Adds the sample sequence before other metadata is appended. |
| 2 | copy module | Adds the collection module metadata to each metric row. |
| 3 | copy command | Adds the collection command metadata to each metric row. |
| 4 | copy timestamp | Adds the timestamp at the beginning of the enriched row. |
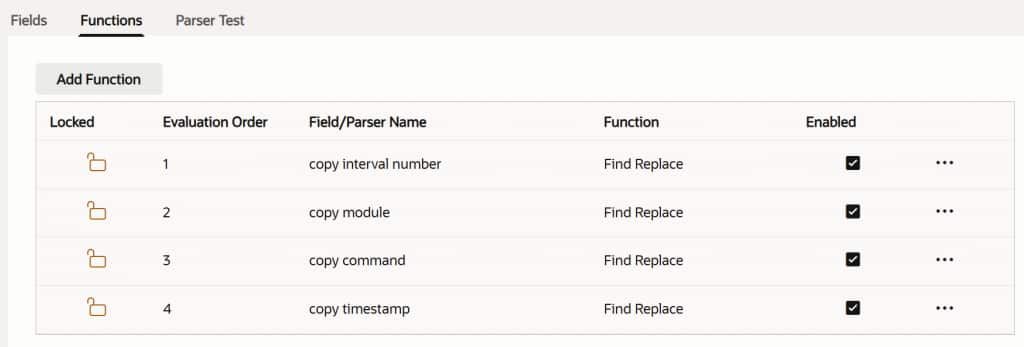
After the functions run, each metric row is transformed into a parseable record like this:
05/11/2026 02:07:55 1 0 0 28826708 792788 12473196 0 0 2 15 0 0 3 1 96 0 0 [Sample:0] [mod:VmstatExaWatcher] [cmd: /usr/bin/vmstat 5 2]Open the Parser Test tab and run the test. The numeric VMStat rows should parse successfully into the selected fields. Some non-metric rows may still fail parsing, which is expected. Those rows are removed later by source data filters.
Save the parser.
Create the Log Source
In the OCI Console, open the navigation menu. Select Observability & Management. Under Log Analytics, select Administration. In the Administration navigation pane, select Sources, and then select Create Source.
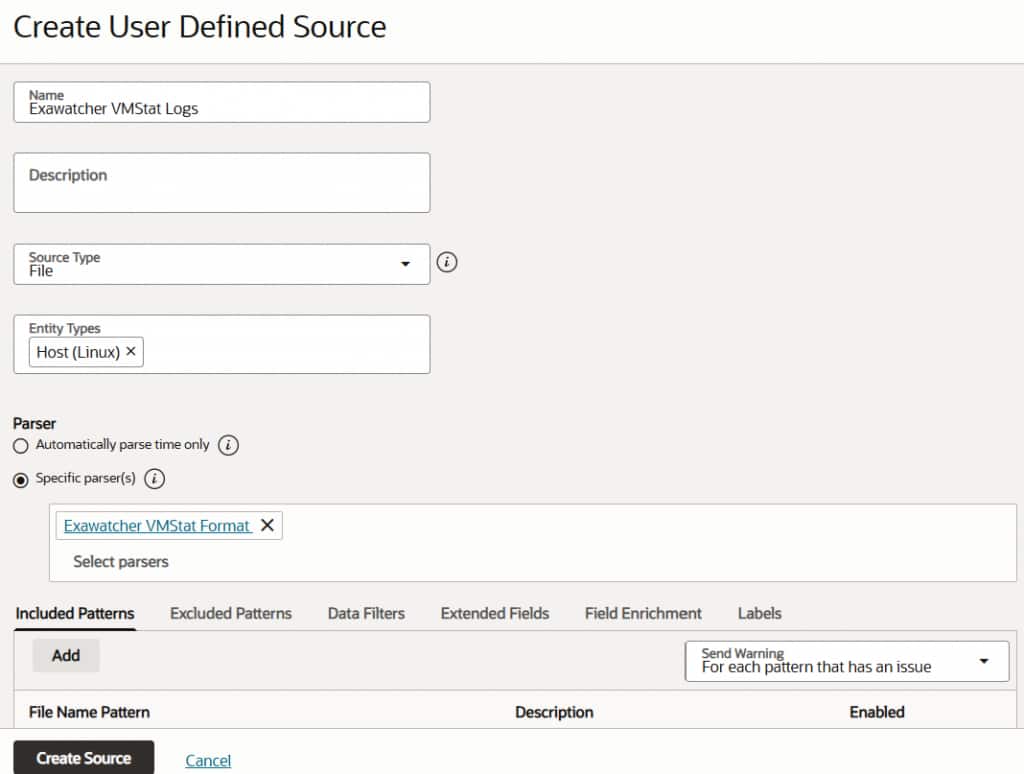
Enter the following source details:
| Field | Value |
|---|---|
| Name | Exawatcher VMStat Logs |
| Source Type | File |
| Entity Type | Host (Linux) |
| Parser selection | Select Specific Parsers |
| Parser | Exawatcher VMStat Format |
The file path pattern depends on where Exawatcher VMStat files are stored in your environment and where the OCI Management Agent can read them.
Add Source Data Filters
The parser functions copied the useful timestamp and header context onto each metric row. The remaining header and marker rows can now be dropped before ingestion.
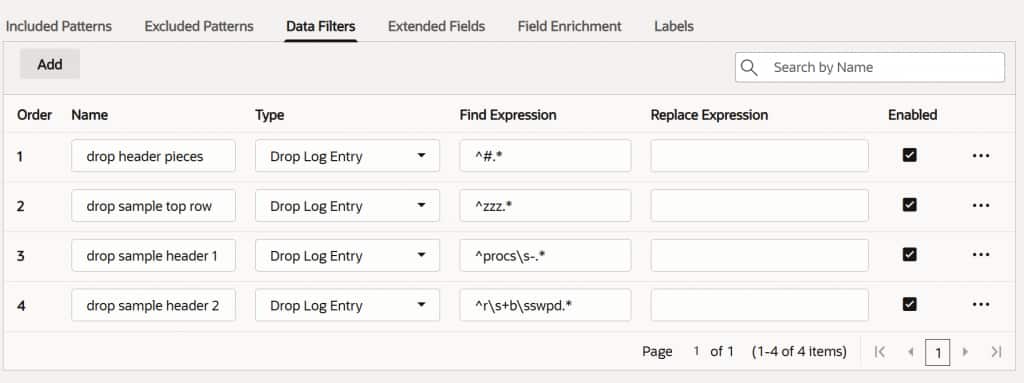
Open the source’s Data Filters tab and add these filters:
| Filter name | Find expression | What it does |
|---|---|---|
drop header pieces | ^#.* | Drops the file header rows that begin with #. These rows contain useful metadata, but the parser functions have already copied the needed values into each metric row. |
drop sample top row | ^zzz.* | Drops the sample marker rows that begin with zzz. These rows provide the timestamp and count for each sample block, but those values have already been copied to the metric rows. |
drop sample header 1 | ^procs\s-.* | Drops the repeated VMStat section header row that starts with procs. This row describes the column groups, but it does not contain metric values. |
drop sample header 2 | ^r\s+b\sswpd.* | Drops the repeated VMStat column name row that starts with r b swpd. This row identifies the VMStat columns, but it should not become a log record. |
For each data filter, set Type to Drop Log Entry.
Save the source.
Collect or Upload the Logs
After the source is saved, associate it with the appropriate Linux host entity to collect logs continuously through the OCI Management Agent.
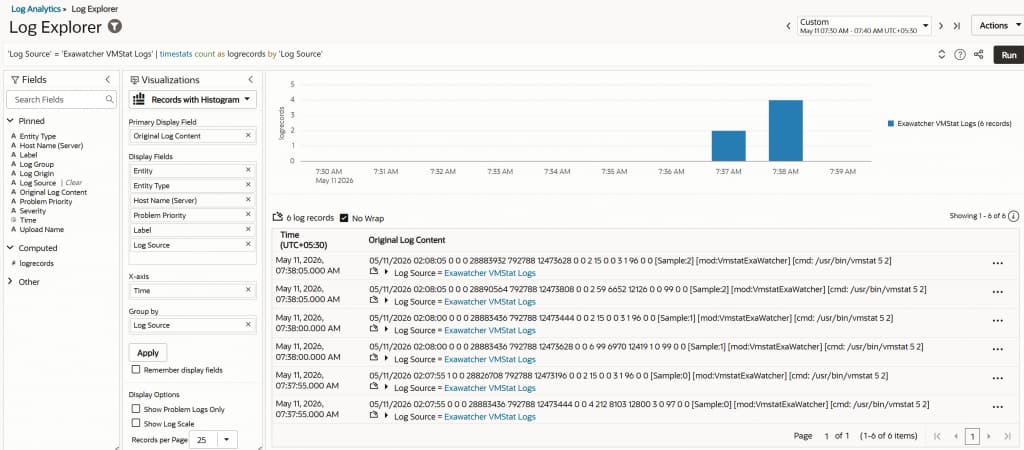
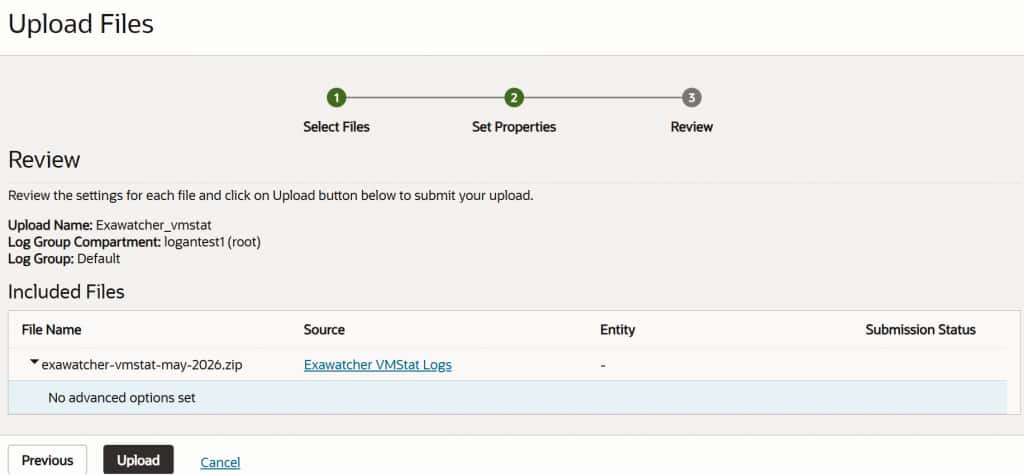
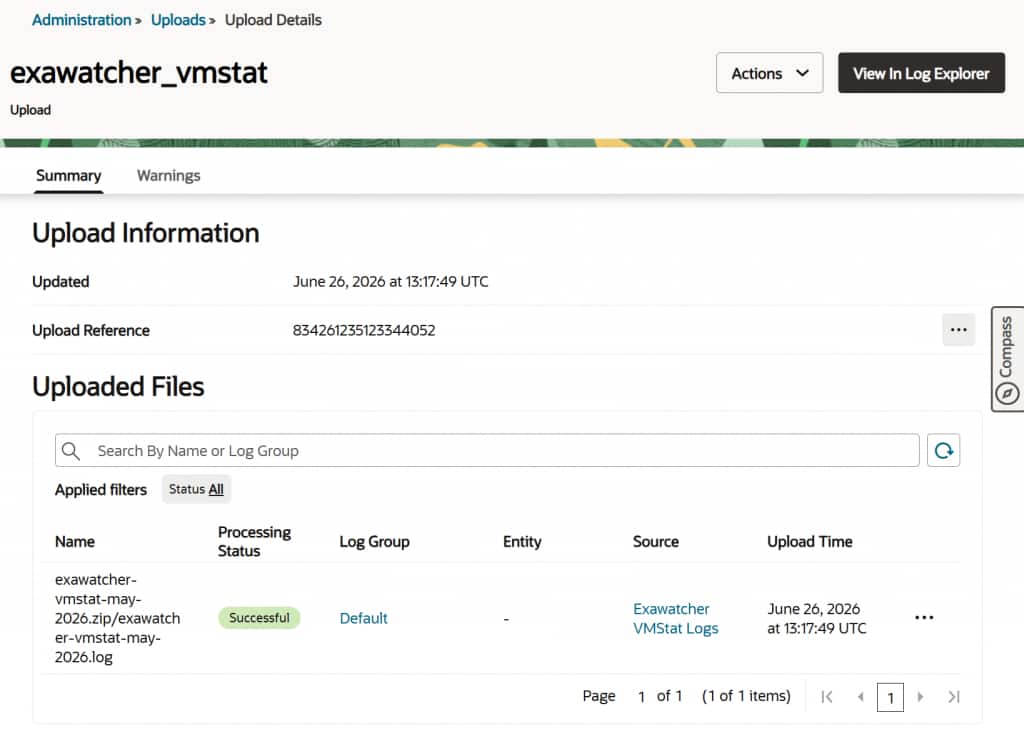
You can also use on-demand upload to test a sample file before enabling continuous collection. When using the sample log shown in this blog, the final result should be six parsed records, one for each numeric VMStat row.
Click View in Log Explorer:
Analyze the Parsed VMStat Metrics
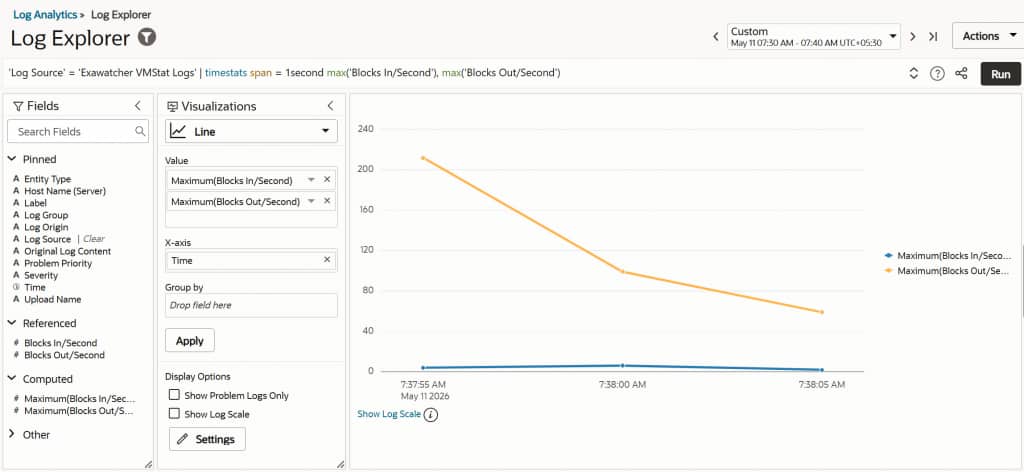
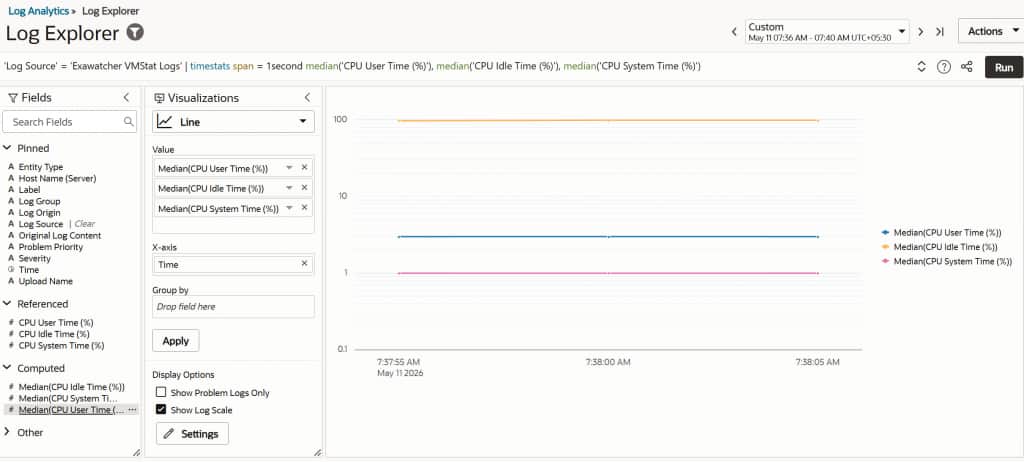
After ingestion, the VMStat values are available as structured fields. You can use them in searches, visualizations, and dashboards.
The Blocks In/Second and Blocks Out/Second line chart shows the maximum block input and output activity across the sample intervals, making it easy to compare read and write volume over time.
The CPU line chart shows median CPU user, idle, and system time across the same sample period, helping you quickly confirm whether the host was mostly idle or spending time on user or system activity.
Conclusion
Exawatcher VMStat logs contain valuable performance data, but the raw format includes headers, repeated column labels, sample markers, and metric rows mixed together. A basic parser alone is not enough to turn this file into clean analytical records.
By using Oracle Log Analytics parser functions, you can copy timestamp and header context onto each metric row. By using source data filters, you can drop rows that are no longer needed after enrichment. The result is a clean set of structured VMStat log records that can be searched, graphed, and correlated with other operational data in Oracle Log Analytics.