

OCI Compute instances often host some of an organization’s most critical workloads. They run applications, services, automation scripts, agents, and custom software that support day-to-day business operations. At the same time, these instances generate valuable activity records that help security and operations teams understand what is happening inside the host environment.
While OCI Compute monitoring provides visibility into resource health, utilization, and performance, security investigations often require deeper context. You may need to know who tried to access the instance, which accounts were targeted, whether privilege escalation was attempted, and whether the same pattern is appearing across multiple compute resources.
Oracle Log Analytics extends visibility beyond infrastructure metrics by bringing host-level activity into a centralized security monitoring experience. Using the Add Data workflow for OCI Compute instances, administrators can configure log collection from selected compute resources and begin analyzing security-relevant events. Once log collection is enabled, the Compute dashboard within the Oracle Log Analytics Security Monitoring Solution provides a consolidated view of access activity, authentication events, and other indicators of suspicious behavior, helping security teams investigate and respond more effectively.
Why Compute Logs Matter for Security
Compute instances are where operating system activity, user access, privilege changes, scheduled jobs, package updates, agents, and application processes come together. That makes compute logs valuable for security monitoring.
For example, security teams may need to answer questions such as:
- Which accounts are seeing repeated failed SSH login attempts?
- Are multiple failed sudo commands coming from the same user or session?
- Are Windows servers seeing repeated failed RDP logins?
- Did access-control changes occur on a Windows host?
- Are suspicious access patterns concentrated on a specific compute instance?
These are not just infrastructure questions. They are security questions. Logs provide the event detail needed to understand access behavior, investigate potential brute-force attempts, and identify privilege escalation patterns.
Start with Add Data
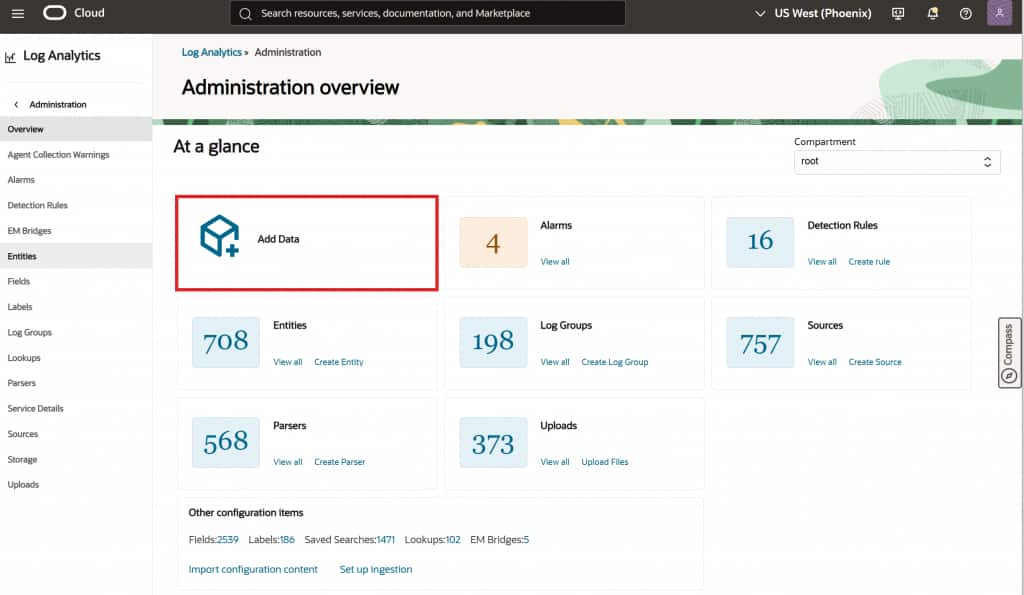
The workflow starts in Oracle Log Analytics Administration. From the Administration overview, select Add Data and choose OCI Compute Instances.
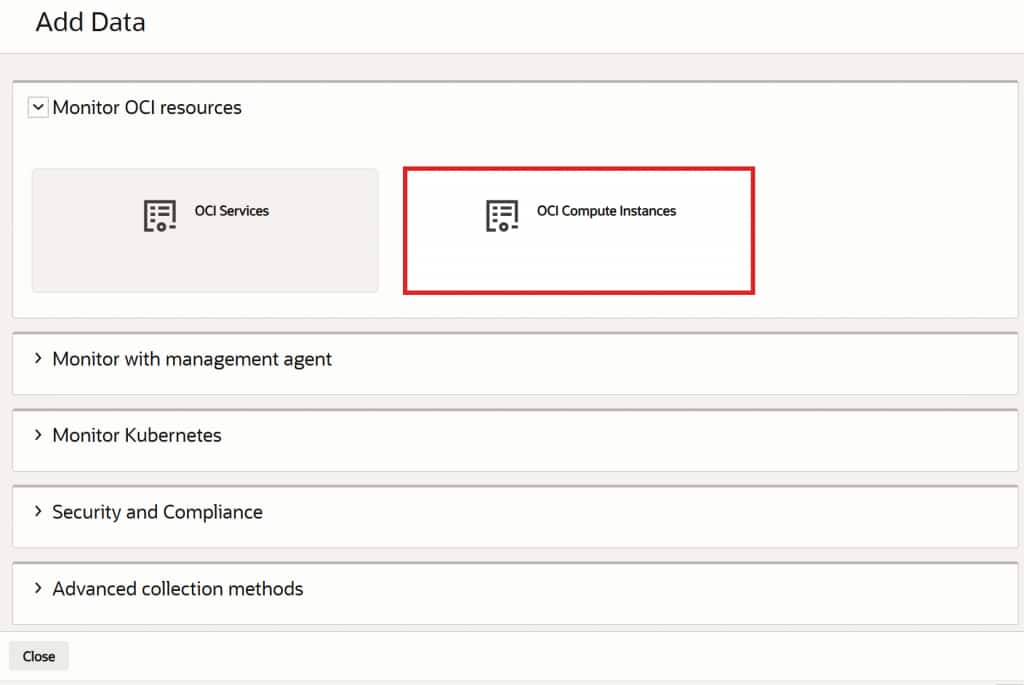
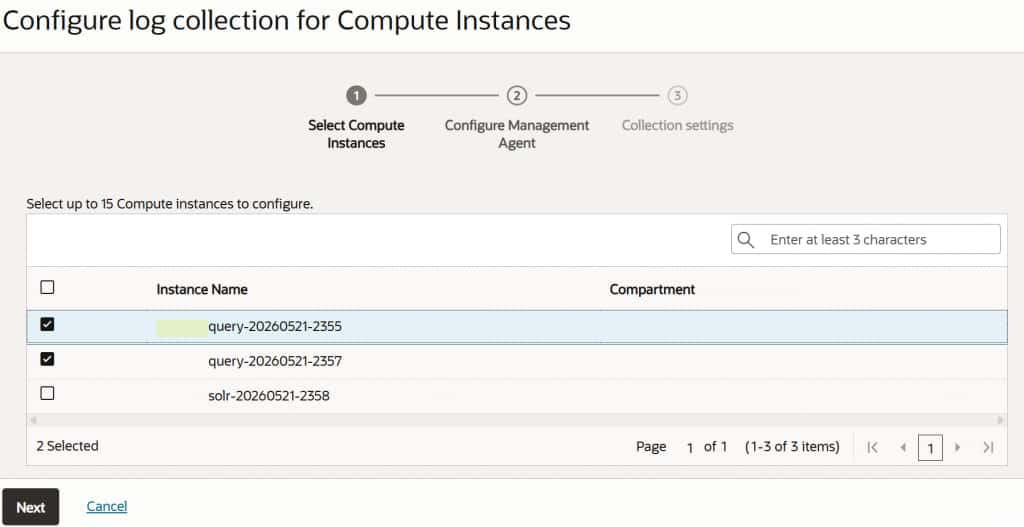
You can then select the compute instances that should send logs to Oracle Log Analytics.
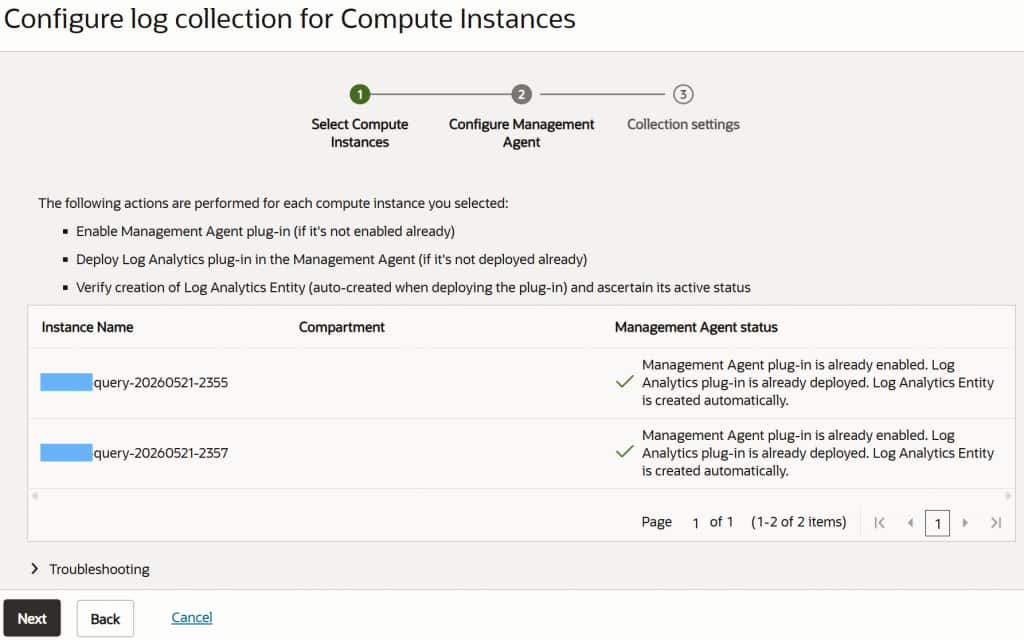
Because Oracle Cloud Agent is already installed on OCI Compute instances, the setup can use that foundation to prepare the instance for log collection. As part of the guided flow, Oracle Log Analytics can enable the Management Agent plug-in on Oracle Cloud Agent, deploy the Oracle Log Analytics plug-in on Management Agent, verify the auto-created Oracle Log Analytics entity, and confirm that the entity is active.
Before configuring collection, make sure the logs you want to collect are readable to the agent user on the compute instance. The agent can collect only the log files it has permission to access, so file permissions and log locations should be part of your onboarding checklist.
Next, select the log sources that are relevant for security monitoring. These can include Linux Audit Logs, Linux Secure Logs, SUDO Logs, Linux Syslog Logs, Linux Cron Logs, and Linux YUM Logs. Also, select the log group where collected data should be stored.
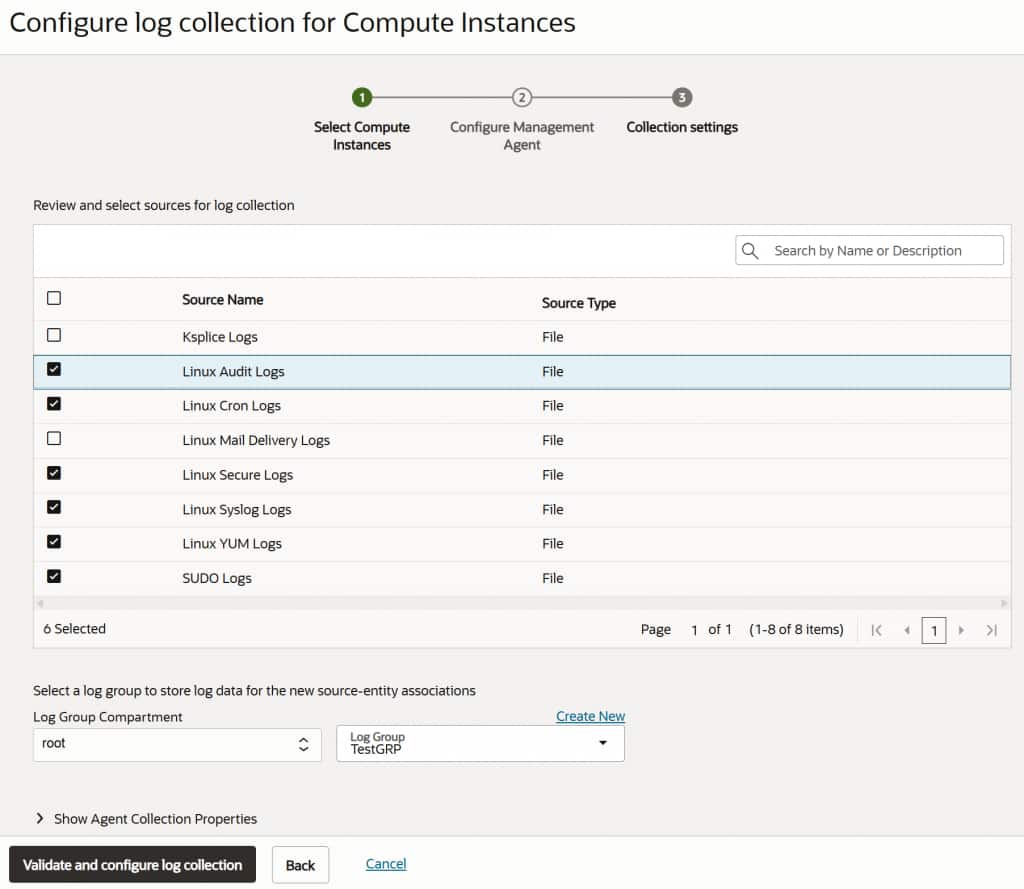
At the end of setup, you can download a mapping file that connects each compute instance with its corresponding Oracle Log Analytics entity. This gives teams a simple way to track which cloud resources are represented in Oracle Log Analytics.
Move from Collection to Security Monitoring
After compute logs are collected, the next step is to use them. Oracle Log Analytics Security Monitoring Solution provides curated dashboards for Virtual Cloud Network, Compute, and OCI Audit. Together, these views help teams monitor security activity across the network, compute, and control planes.
For compute security, open the Security Monitoring Solution and go to the Compute view.
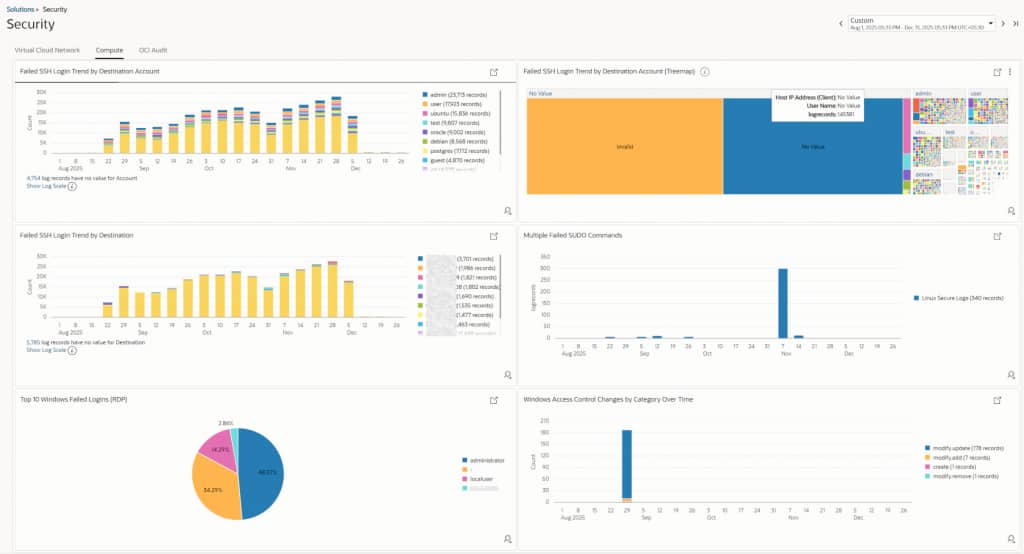
The Compute dashboard focuses on access-related activity across compute resources. It helps teams review failed Linux SSH login attempts, failed Windows RDP logins, failed sudo activity, and Windows access-control changes. These widgets help identify targeted accounts, destination compute instances under repeated login pressure, possible brute-force attempts, privilege escalation behavior, and policy or access-control changes that may require review.
The dashboard includes widgets such as:
- Failed SSH Login Trend by Destination Account
- Failed SSH Login Trend by Destination
- Multiple Failed SUDO Commands
- Top 10 Windows Failed Logins through RDP
- Windows Access Control Changes by Category Over Time
From the dashboard, you can also move deeper into investigation. Widgets can be opened in Log Explorer, maximized for review, exported to CSV, or inspected through the query behind the widget. This gives analysts a path from dashboard signal to the underlying log records.
Why This Matters
This flow helps close the gap between log collection and security investigation.
With Oracle Log Analytics, OCI Compute users can:
- Quickly configure security-relevant compute log collection with Add Data wizard.
- Associate collected logs with Log Analytics entities and log groups.
- Use curated security dashboards instead of starting from raw log search.
- Review failed login activity across Linux and Windows compute resources.
- Detect repeated sudo failures and possible privilege escalation attempts.
- Pivot from dashboard widgets into Log Explorer for deeper analysis.
The result is a more practical path for compute security monitoring. You collect the right logs, map them to the right entities, and use a dashboard designed to surface access-related activity across your compute environment.
Take the Next Step with Your Compute Fleet
Security monitoring starts with the logs your compute instances already generate. Use Add Data in Oracle Log Analytics to configure log collection for OCI Compute instances, then use the Compute dashboard in the Security Monitoring Solution to review security activity and investigate suspicious patterns.