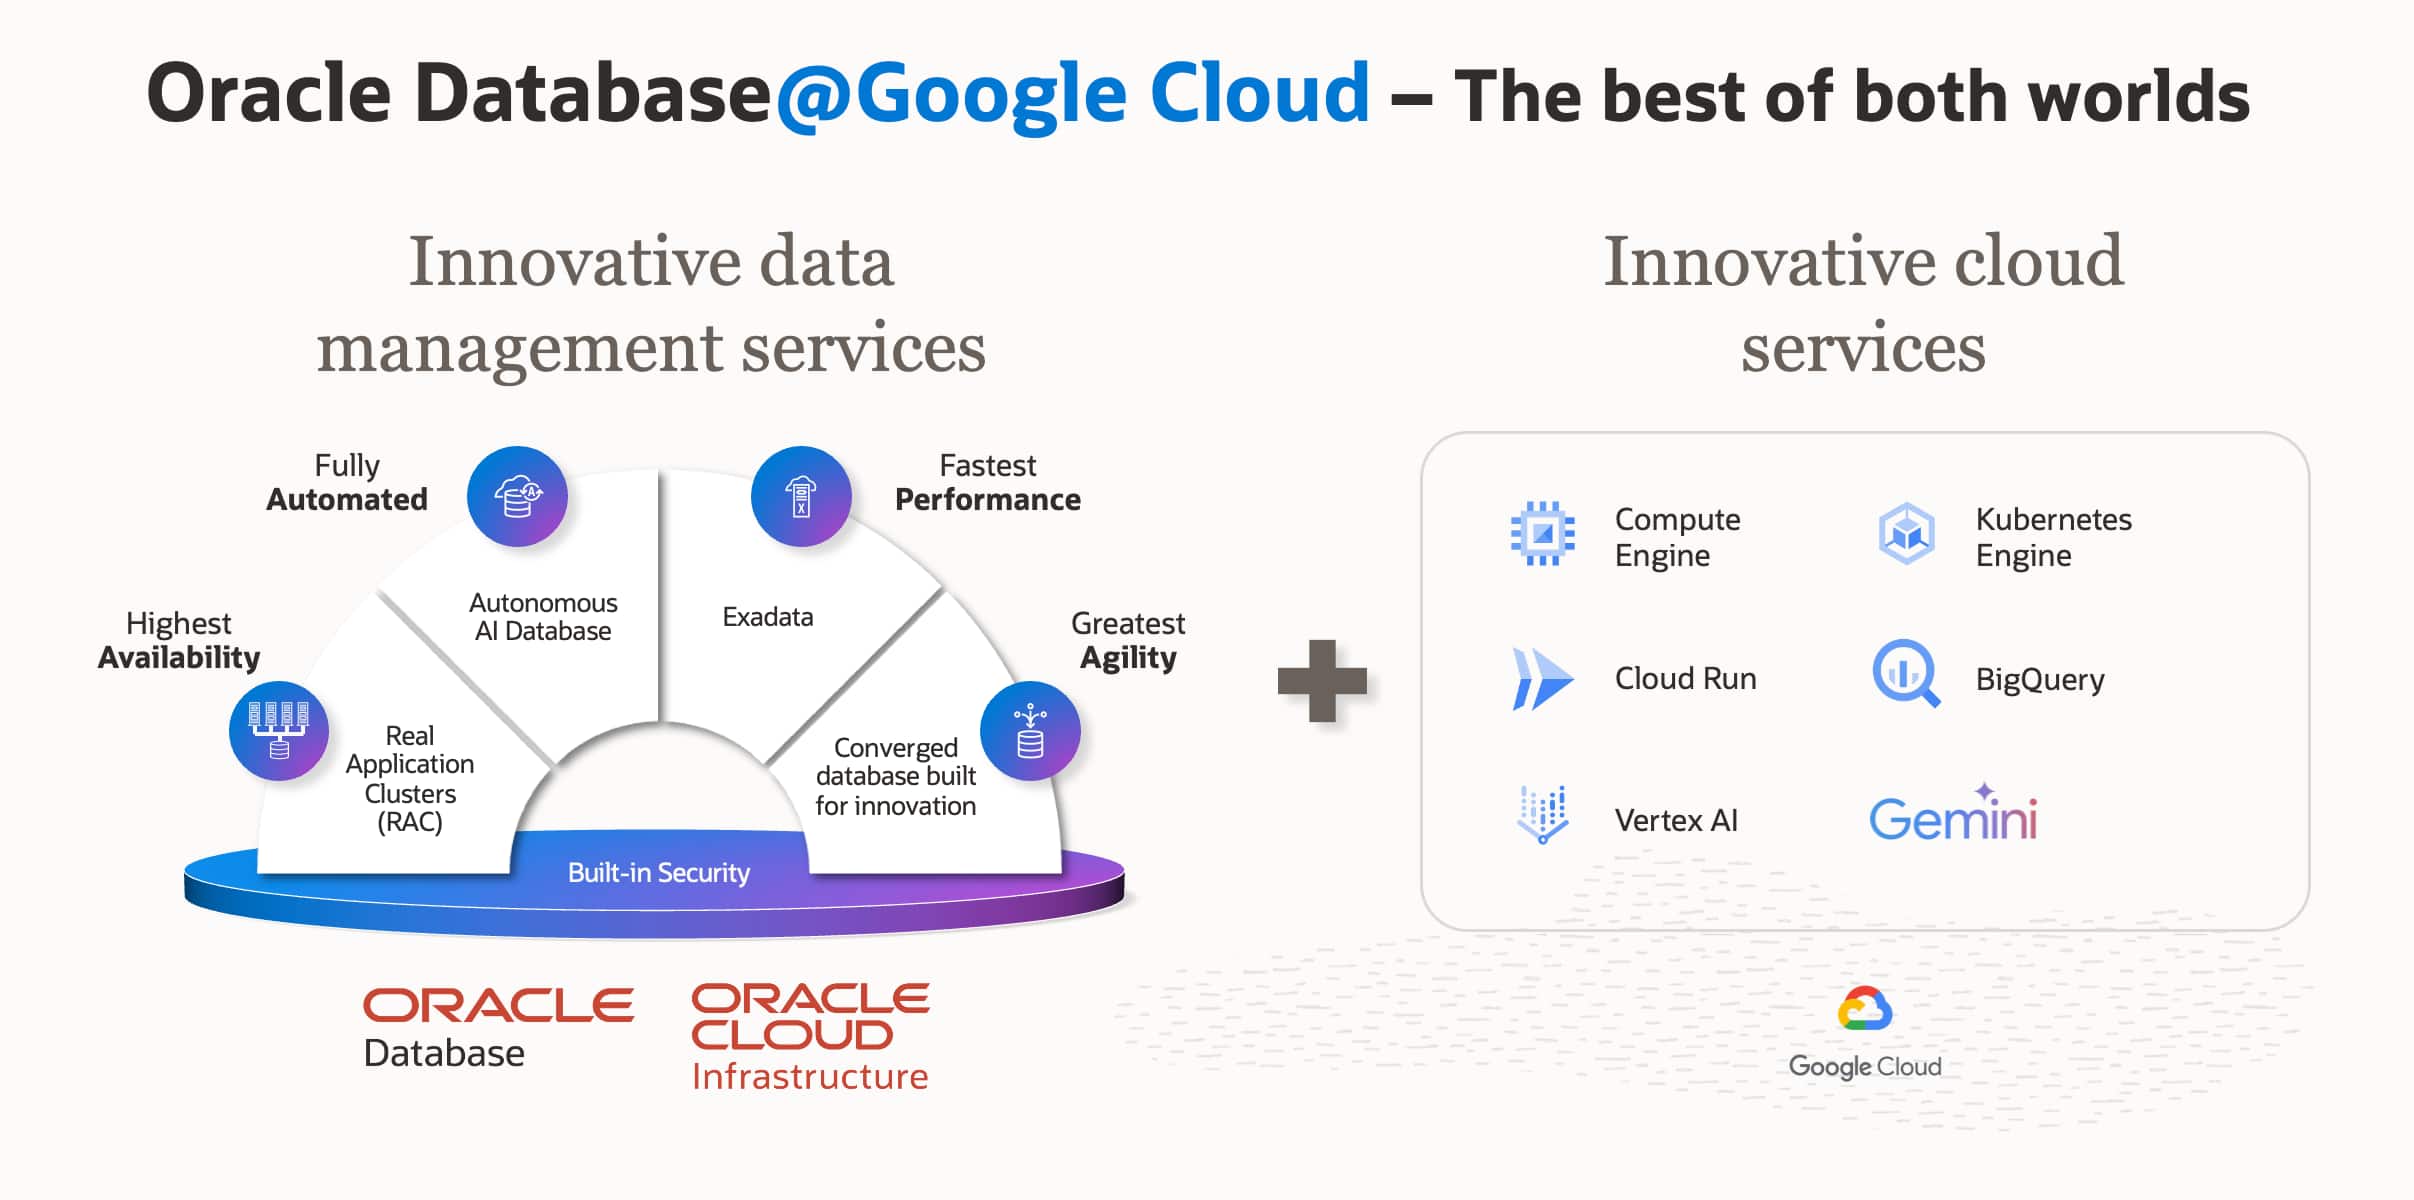
As organizations increasingly adopt multi-cloud strategies, Oracle Database@Google Cloud seamlessly brings the unparalleled performance and high availability of Oracle Exadata to the Google Cloud Platform (GCP). However, running mission-critical Oracle workloads across cloud platforms introduces a familiar challenge: maintaining clear visibility into what’s really happening inside the database.
While cloud architects and Site Reliability Engineers (SREs) are generally comfortable utilizing standard cloud-native monitoring, database administrators (DBAs) require specialized tools capable of analyzing microscopic database anomalies, execution plans, and memory structures. In this post, we’ll explore how to establish a unified monitoring strategy that embraces both Google Cloud’s native infrastructure metrics and Oracle’s deep, specialized database telemetry.
Managing the Gap: Foundational vs. Deep Observability
There is a distinct difference between “infrastructure monitoring” and “database observability.” Native cloud monitoring is excellent at confirming that a system is “up” and identifying top-level resource constraints. Advanced observability, however, tells you exactly “why” a database workload is underperforming by correlating deep internal telemetry. You need both—one without the other either leaves you guessing or digging too late.
To achieve a true “single pane of glass” without sacrificing troubleshooting depth, organizations should adopt a layered monitoring strategy.
Why two layers, not one? It comes down to where the observation happens. Google Cloud Monitoring receives metrics exported from the Oracle Cloud Infrastructure (OCI)-managed infrastructure running your Exadata nodes—it is observing from the outside. It never connects to the database session layer, never reads v$ views, and never sees an individual SQL execution. That boundary is not a limitation of the product—it is the design. OCI Database Management runs inside the database. It queries v$, samples Active Session History (ASH), pulls Automatic Workload Repository (AWR) snapshots—asking the database directly rather than interpreting host metrics. A 95% CPU spike looks identical from both vantage points. Only one of them can tell you which SQL_ID burned the cores.
Layer 1: Baseline Observability with Google Cloud Monitoring
The first layer of any cloud operations strategy relies on native tooling. For Oracle Database@Google Cloud, foundational infrastructure metrics are automatically streamed directly into the Google Cloud Console, specifically integrated with Google Cloud Monitoring.
This baseline observability is crucial for basic management, routing, and high-level capacity alerting. It tells you something is wrong—not what caused it.
Native Metrics Available in Google Cloud Monitoring
By default, the integration provides SREs and cloud operators with essential telemetry, including:
- Compute and Resource Utilization: CPU usage, memory utilization trends, and high-level node performance metrics.
- Network Telemetry: Inbound and outbound traffic flows and latency tracking across your Virtual Private Cloud (VPC) network.
- Storage Metrics: Basic utilization tracking for database storage.
- Status & Availability: Node up/down status and basic health checks.
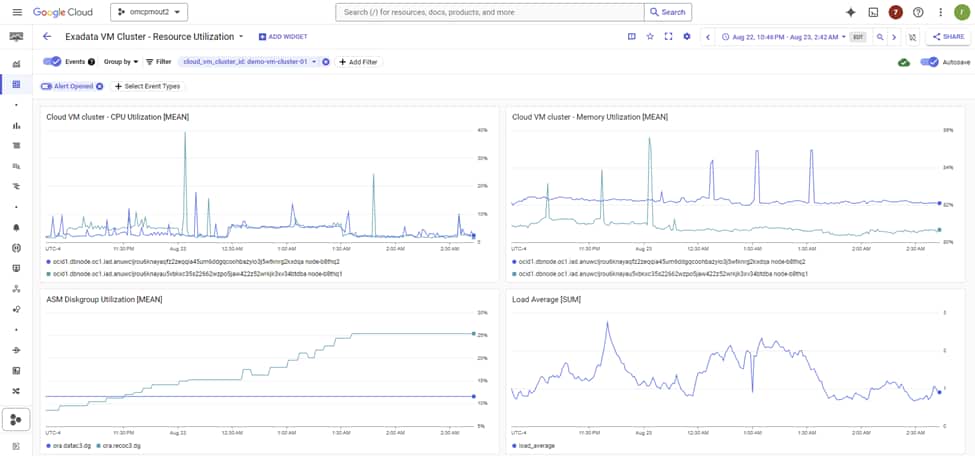
A Concrete Example: Alerting on a Saturated VM Cluster
In Cloud Monitoring’s Metrics Explorer, Oracle Database@Google Cloud exposes five resource types: Exadata Infrastructure, Cloud VM Cluster, Container Database, Pluggable Database, and Autonomous AI Database. Each ships its own set of metrics covering CPU, memory, storage utilization, and availability. A practical starting alert on a Cloud VM Cluster looks like this:
- Resource type: Cloud VM Cluster
- Metric: CPU Utilization
- Condition: mean > 80% sustained for 10 minutes (metric-threshold alerting policy)
- Notification channel: PagerDuty, Slack, or email
Pair that with a metric-absence policy on the same resource: if metrics stop arriving for five minutes or more, this is often a routing, agent, or provider-integration issue worth paging on independently of database health. Both policy types are first-class citizens in Cloud Monitoring alerting.
What this layer catches reliably: node-level CPU saturation, memory pressure, storage approaching capacity, and a VM cluster going unreachable. What it will miss: a single runaway SQL consuming four cores while the other twenty-eight are idle, a row lock contention storm where CPU barely moves, or a ten-fold regression in log file sync masked by plenty of free memory. For those, you are in Layer 2 territory.
Using Google Cloud Monitoring, teams can build custom dashboards and configure standard alerts (via Email, Webhooks, or PagerDuty integration) for when foundational infrastructure resources approach critical thresholds. However, while these metrics are vital for operations, they lack the granularity required to debug complex Oracle Database performance issues, such as lock contention or degrading SQL statements.
Layer 2: Deep Database Observability with OCI Database Management and Ops Insights
When an SRE alerts a DBA to a CPU spike seen in Google Cloud Monitoring, the DBA needs to “look under the hood.” This relies on unlocking advanced, deep database metrics that become available when you augment your environment with OCI specialized tooling.
By enabling OCI Database Management (DBM) and OCI Ops Insights (OPSI) (or leveraging Oracle Enterprise Manager), you gain access to internal Oracle metrics that cannot be captured by standard, agent-less cloud monitoring.
Real-Time Troubleshooting with Database Management
DBM acts as the real-time command center for DBAs, offering immediate capabilities to diagnose live performance issues:
- Real-Time Fleet Management: Deep insights into locking, blocking, and wait events across your exadata fleet.
- Performance Hub & AWR Explorer: Direct access to ASH and AWR data to identify the exact SQL or session causing issues.
- SQL Tuning Advisor: Automated recommendations for execution plan improvements and indexing strategies directly within the cloud console.
Performance Hub exposes ASH at 1-second granularity alongside AWR at its default 1-hour snapshot interval, giving DBAs both a real-time and historical lens into database activity. When a CPU alert fires at 3 AM, the first step is to understand where time is actually being spent—whether the system is CPU-bound or waiting on specific resources.
The wait profile quickly frames the problem space. Common signals emerge immediately:
log file sync (commit or redo bottlenecks), db file sequential read (single-block I/O, typically index-driven), gc buffer busy acquire (RAC cache contention), enq: TX – row lock contention (application-level locking), and library cache: mutex X (parse contention).
From there, Top SQL by elapsed time and CPU surfaces the offending SQL_ID within seconds, along with its current execution plan and relevant historical plan context—allowing you to understand not just what is slow, but why.
On Exadata, additional signals come into play: Smart Scan offload efficiency, flash cache hit ratio, and cell single-block read latency. These indicate whether the storage tier is doing the heavy lifting it should. When offload efficiency drops, full scans that should be processed in the cells shift back to the database layer, driving up CPU consumption.
The blocking tree completes the picture, pinpointing the exact blocking session and its dependency chain—so you can act decisively, rather than guess.
None of these signals exist in Google Cloud Monitoring. They live in the database’s memory structures, and only something running inside the database can see them. That is the trade-off Layer 2 is solving.
Proactive Analytics with OCI Ops Insights
If DBM is for real-time firefighting, OPSI is for long-term strategic prevention. OPSI leverages machine learning on long-term data sets (up to 25 months) to forecast future needs:
- Database Capacity Planning: ML-driven forecasting predicting exactly when your Exadata infrastructure on Google Cloud will exhaust its CPU or storage resources.
- SQL Insights: Proactive identification of SQL statements whose performance is structurally degrading over time or across application releases.
- Exadata Insights: An aggregated view of your entire Exadata infrastructure, tracking resource contention and ensuring optimal balancing.
Broader Management with Oracle Enterprise Manager
For organizations with heavy existing investments in Oracle environments across both on-premises and multiple clouds, OEM 24ai serves as the ultimate deep lifecycle management tool bridging all environments. It supports patching, deep compliance checking, and complete hybrid-cloud management.
Bringing It Together: A Practical Approach
A successful strategy for Oracle Database@Google Cloud doesn’t force a choice between GCP and Oracle workflows. Instead, it utilizes both:
- Stream the Basics: Automatically ingest node health and resource saturation metrics into Google Cloud Monitoring for uniform, high-level alerting across all your cloud applications.
- Context-Switch for Depth: Use the GCP portal for basic management, but when anomalies occur, pivot to OCI DBM and OCI OPSI—where the additional, deep internal metrics (AWR, ASH, SQL execution plans) have been seamlessly unlocked and correlated.
This way:
- SREs stay in familiar tooling for day-to-day monitoring
- DBAs get the depth they need without compromise
- The organization gets unified visibility without forcing either team to abandon familiar workflows
Conclusion
Oracle Database@Google Cloud fundamentally breaks down the barriers of multi-cloud architectures. By implementing a layered approach starting with Google Cloud Monitoring for baseline observability and layering OCI Database Management and Ops Insights for specialized, deep diagnostics, organizations enable both their SREs and DBAs. This ensures Oracle workloads deliver the unparalleled performance, reliability, and security your business demands on Google Cloud.