Maintaining the health and performance of complex business workflows, especially those utilizing sophisticated Oracle Integration Cloud (OIC) integrations, demands continuous collection, enrichment, and monitoring of key business metrics. This enables quick identification, troubleshooting, and resolution of issues.
The Oracle Cloud Infrastructure (OCI) Logging Analytics now offers an Oracle Integration Insight dashboard for Oracle Integration 3 (OIC3). Oracle Integration 3 is a fully managed, preconfigured environment that gives you the power to integrate your cloud and on-premises applications, automate business processes, develop visual applications, use an SFTP-compliant file server to store and retrieve files, and exchange business documents with a B2B trading partner. The Oracle Insight dashboard is designed to simplify the management of OIC integrations within your business workflows by leveraging OIC Activity Stream Logs. This dashboard provides comprehensive visibility into essential business metrics defined in OIC integrations, along with a visual chronology of the actions generating these events. In this blog, we’ll explore the various visualizations available in the Integration Insight dashboard.
This new dashboard provides answers to several key questions, including:
- How many orders are being processed at their stages?
- What are the processing times stats for each step within different transaction types?
- What are the common bottlenecks or delays in the order processing workflow?
- Which steps in the business flow failed, based on integration tracking fields such as OrderId, Order Amount, and Region?
- Are there common patterns such as order type, order size for failed or long running transactions?
- What is the overall time taken to complete a transaction, and how does it compare to other transactions?
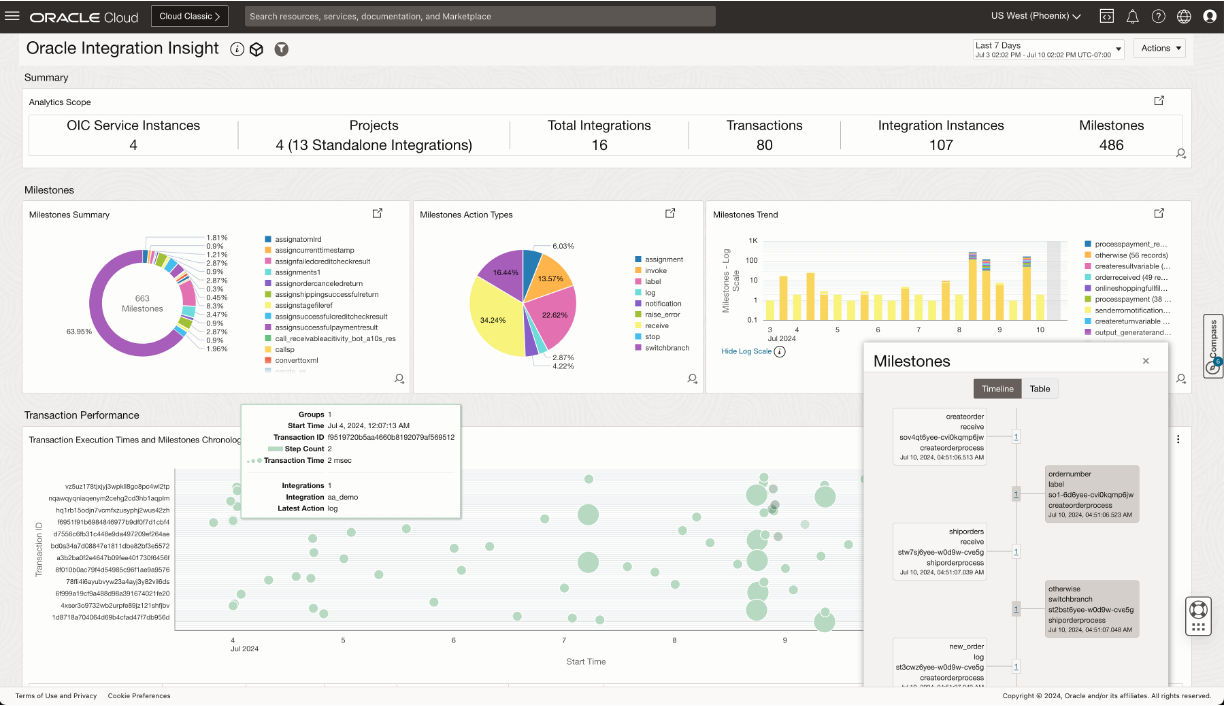
Let’s look at the dashboard in more detail
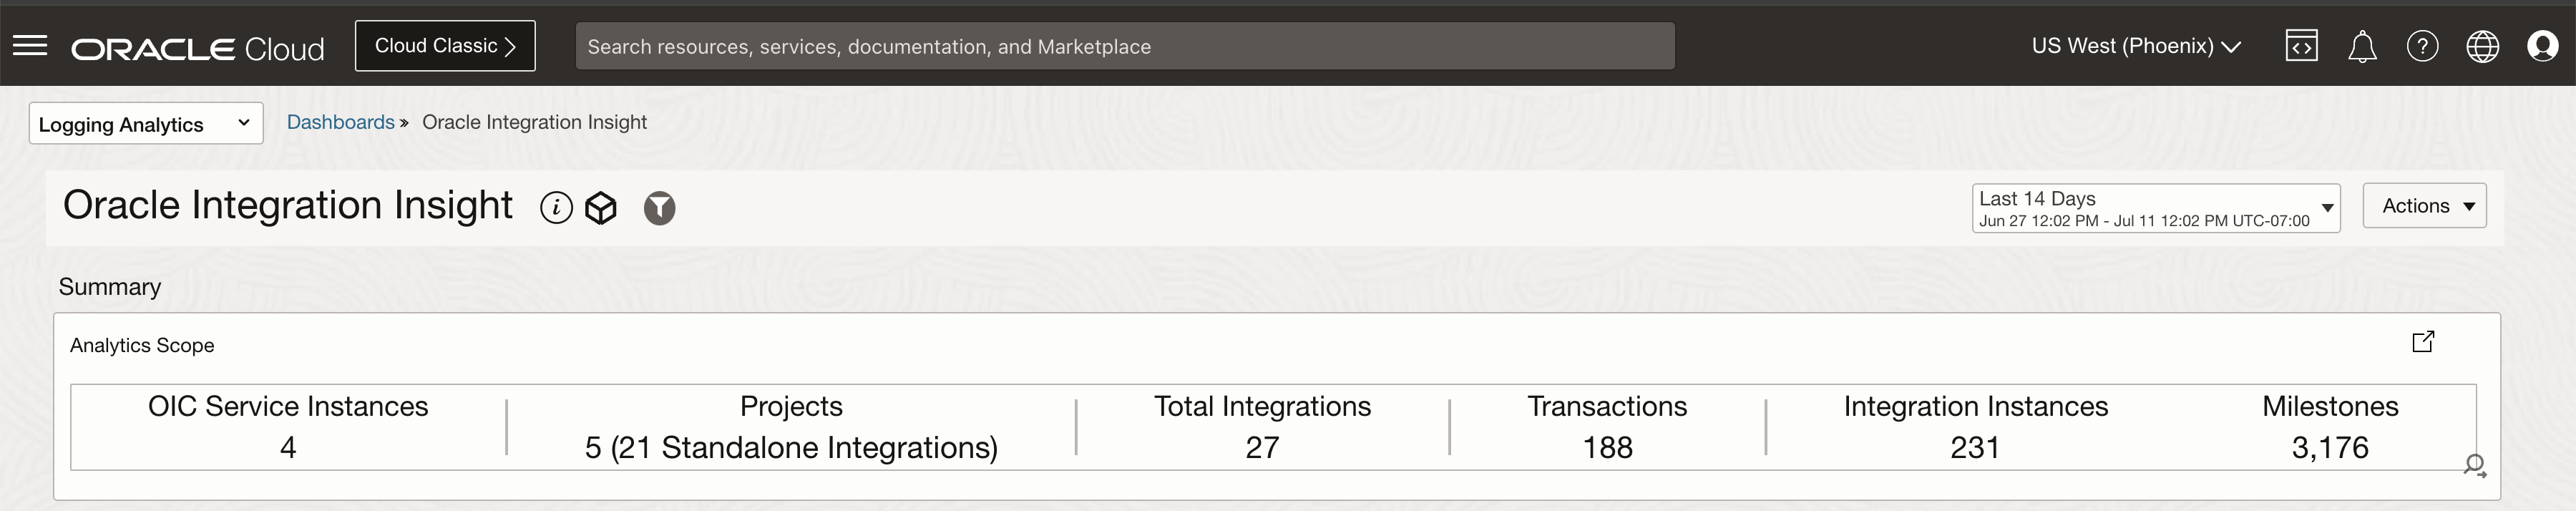
Summary
Summary section provides overview of the data being analyzed in this dashboard based on the dashboard selected filters/
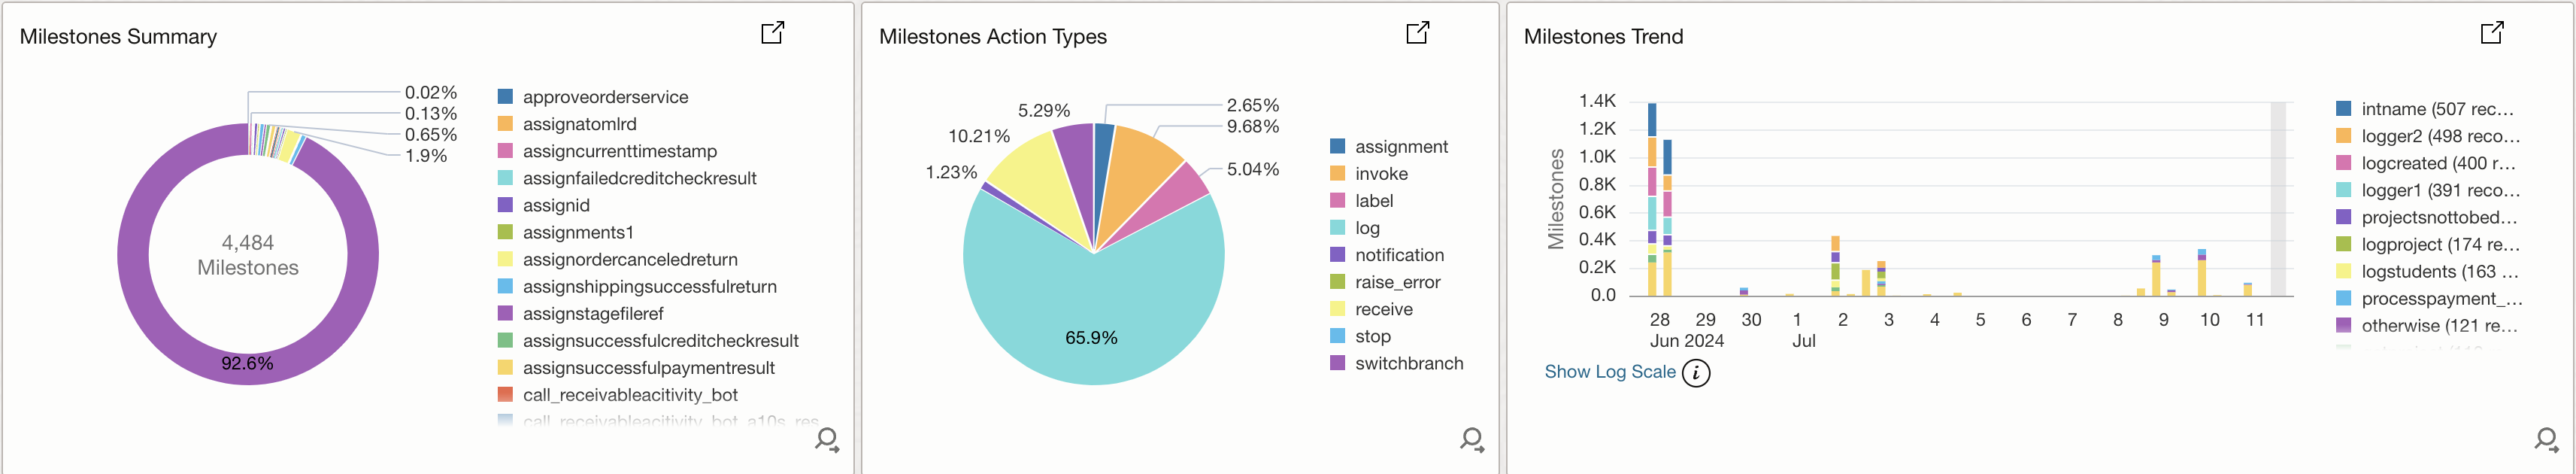
Milestone distribution and trend details for Oracle Integration Cloud
Next, the Milestones section provides details of the distribution and trends of Milestones and Milestone Types based on your filter values. Milestones are the Integration Actions that were executed in OIC3 runtime.
- Milestone Summary: Distribution of number of different actions that were run.
- Milestone Action Types: Distribution of number of different action types executied.
- Milestones Trend- Trend different actions executed over the selected time-range.
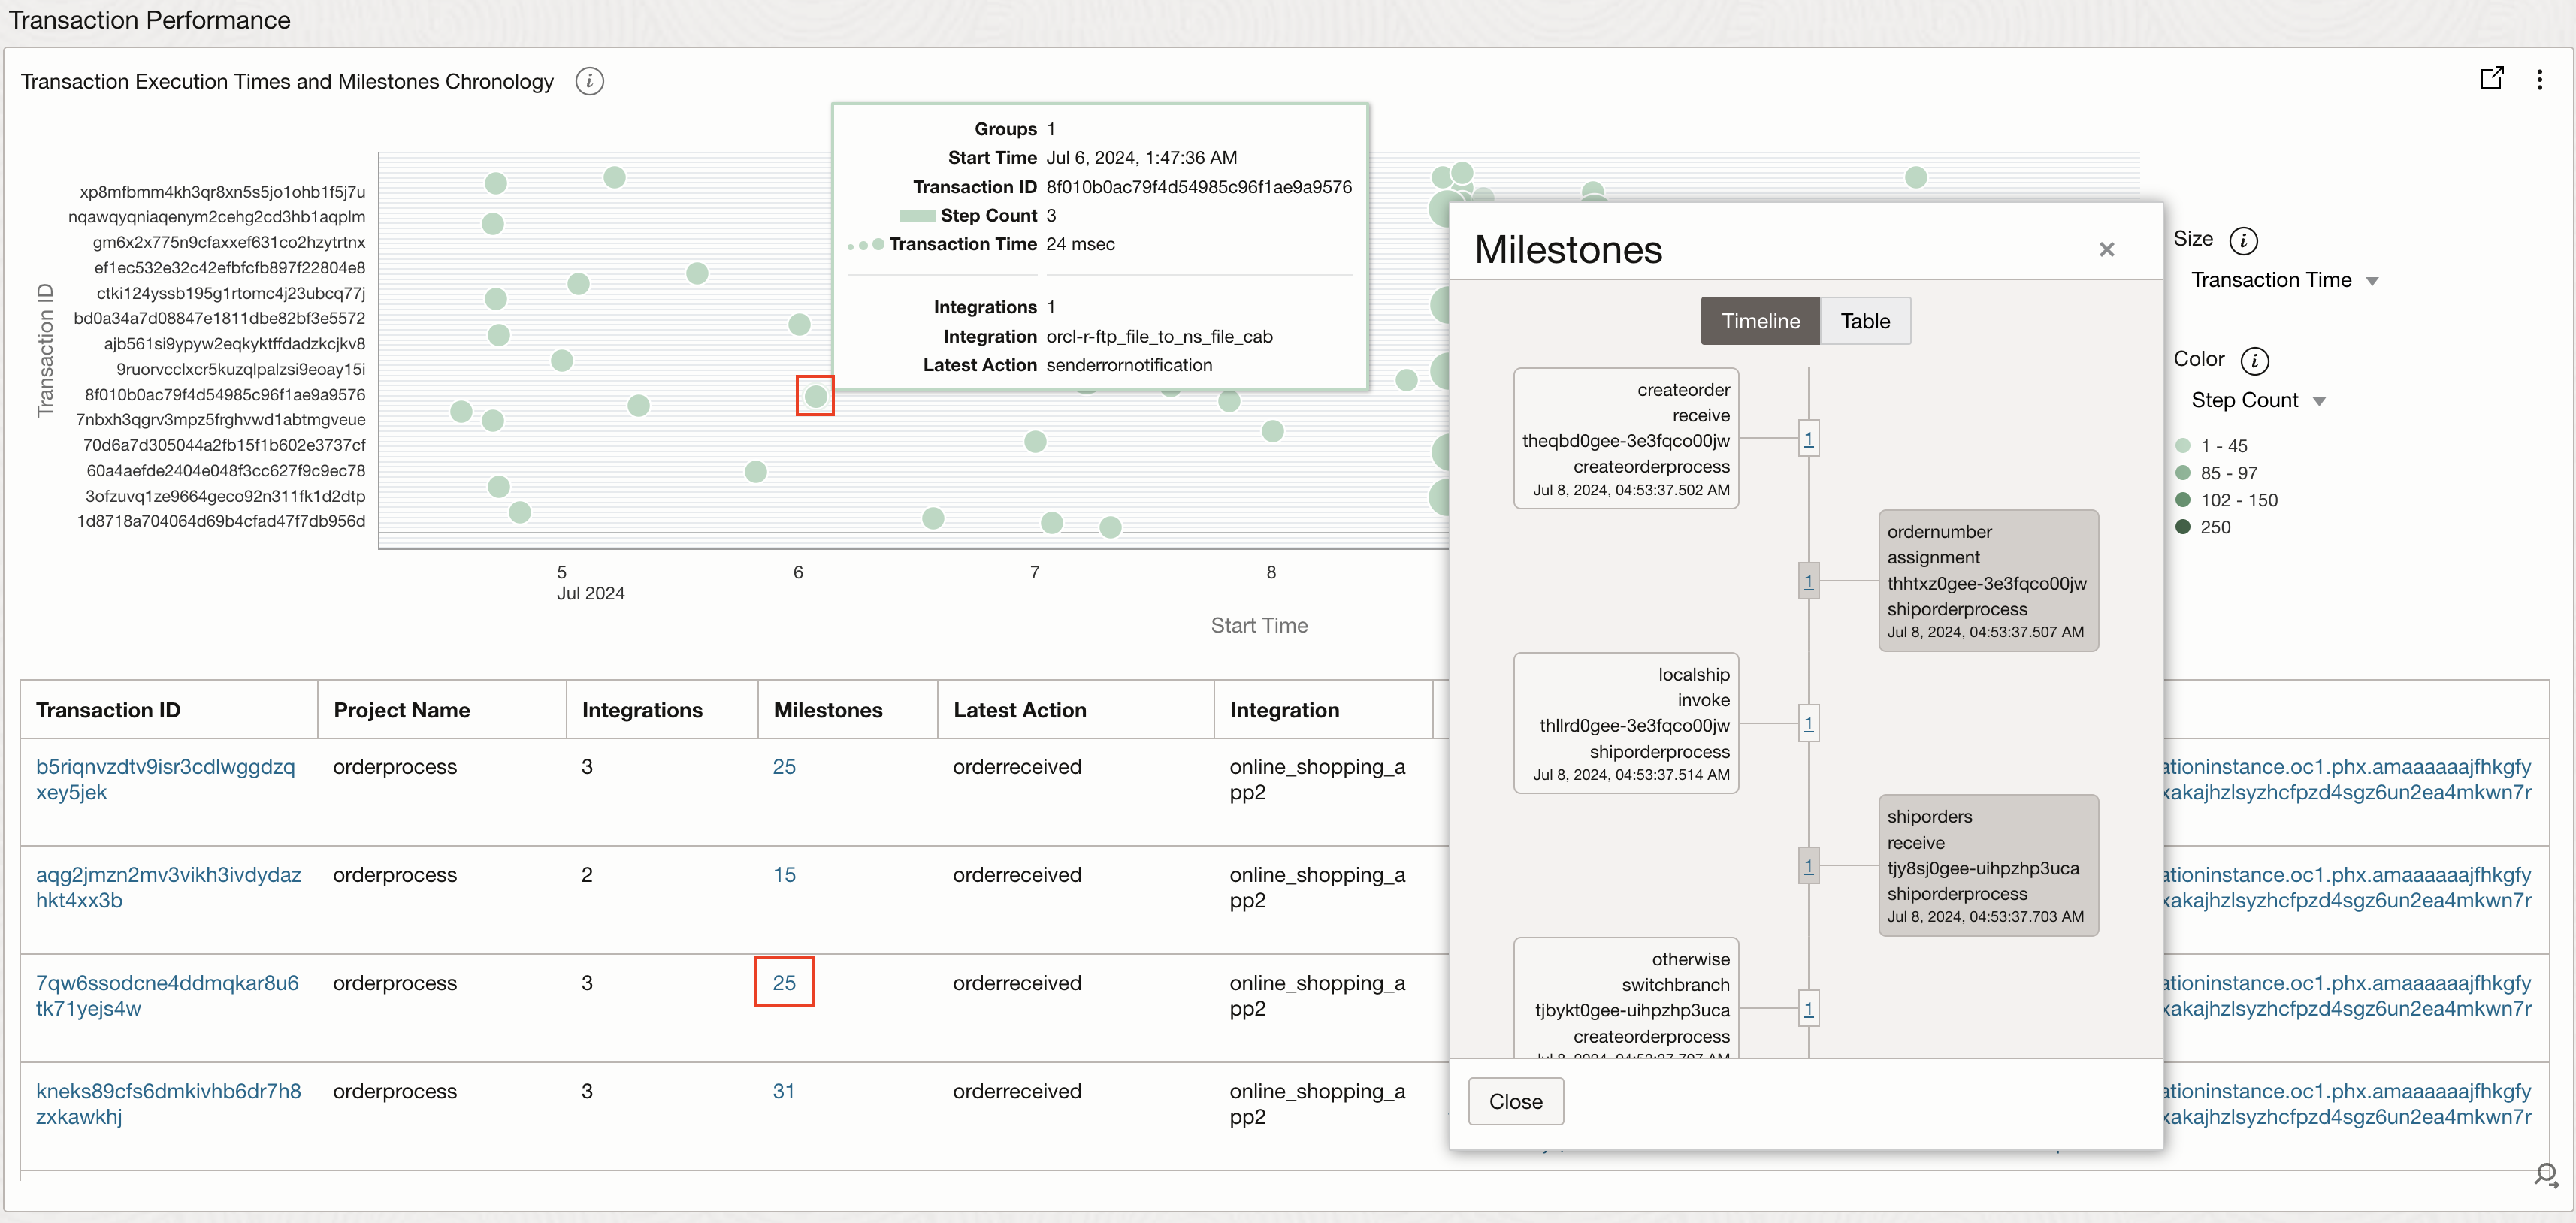
Transaction Performance
The Transaction Performance section provides analytic Insight into the transaction performance based on the execution times of specific steps and overall transaction. This visualization has two parts. The bubble chart at the top is a correlation across different transactions, their execution times, and a number of steps in each transaction. Appropriate filter values must be selected so that this correlation is for same type of transactions which in turn, typically are expected to have similar execution times and steps.
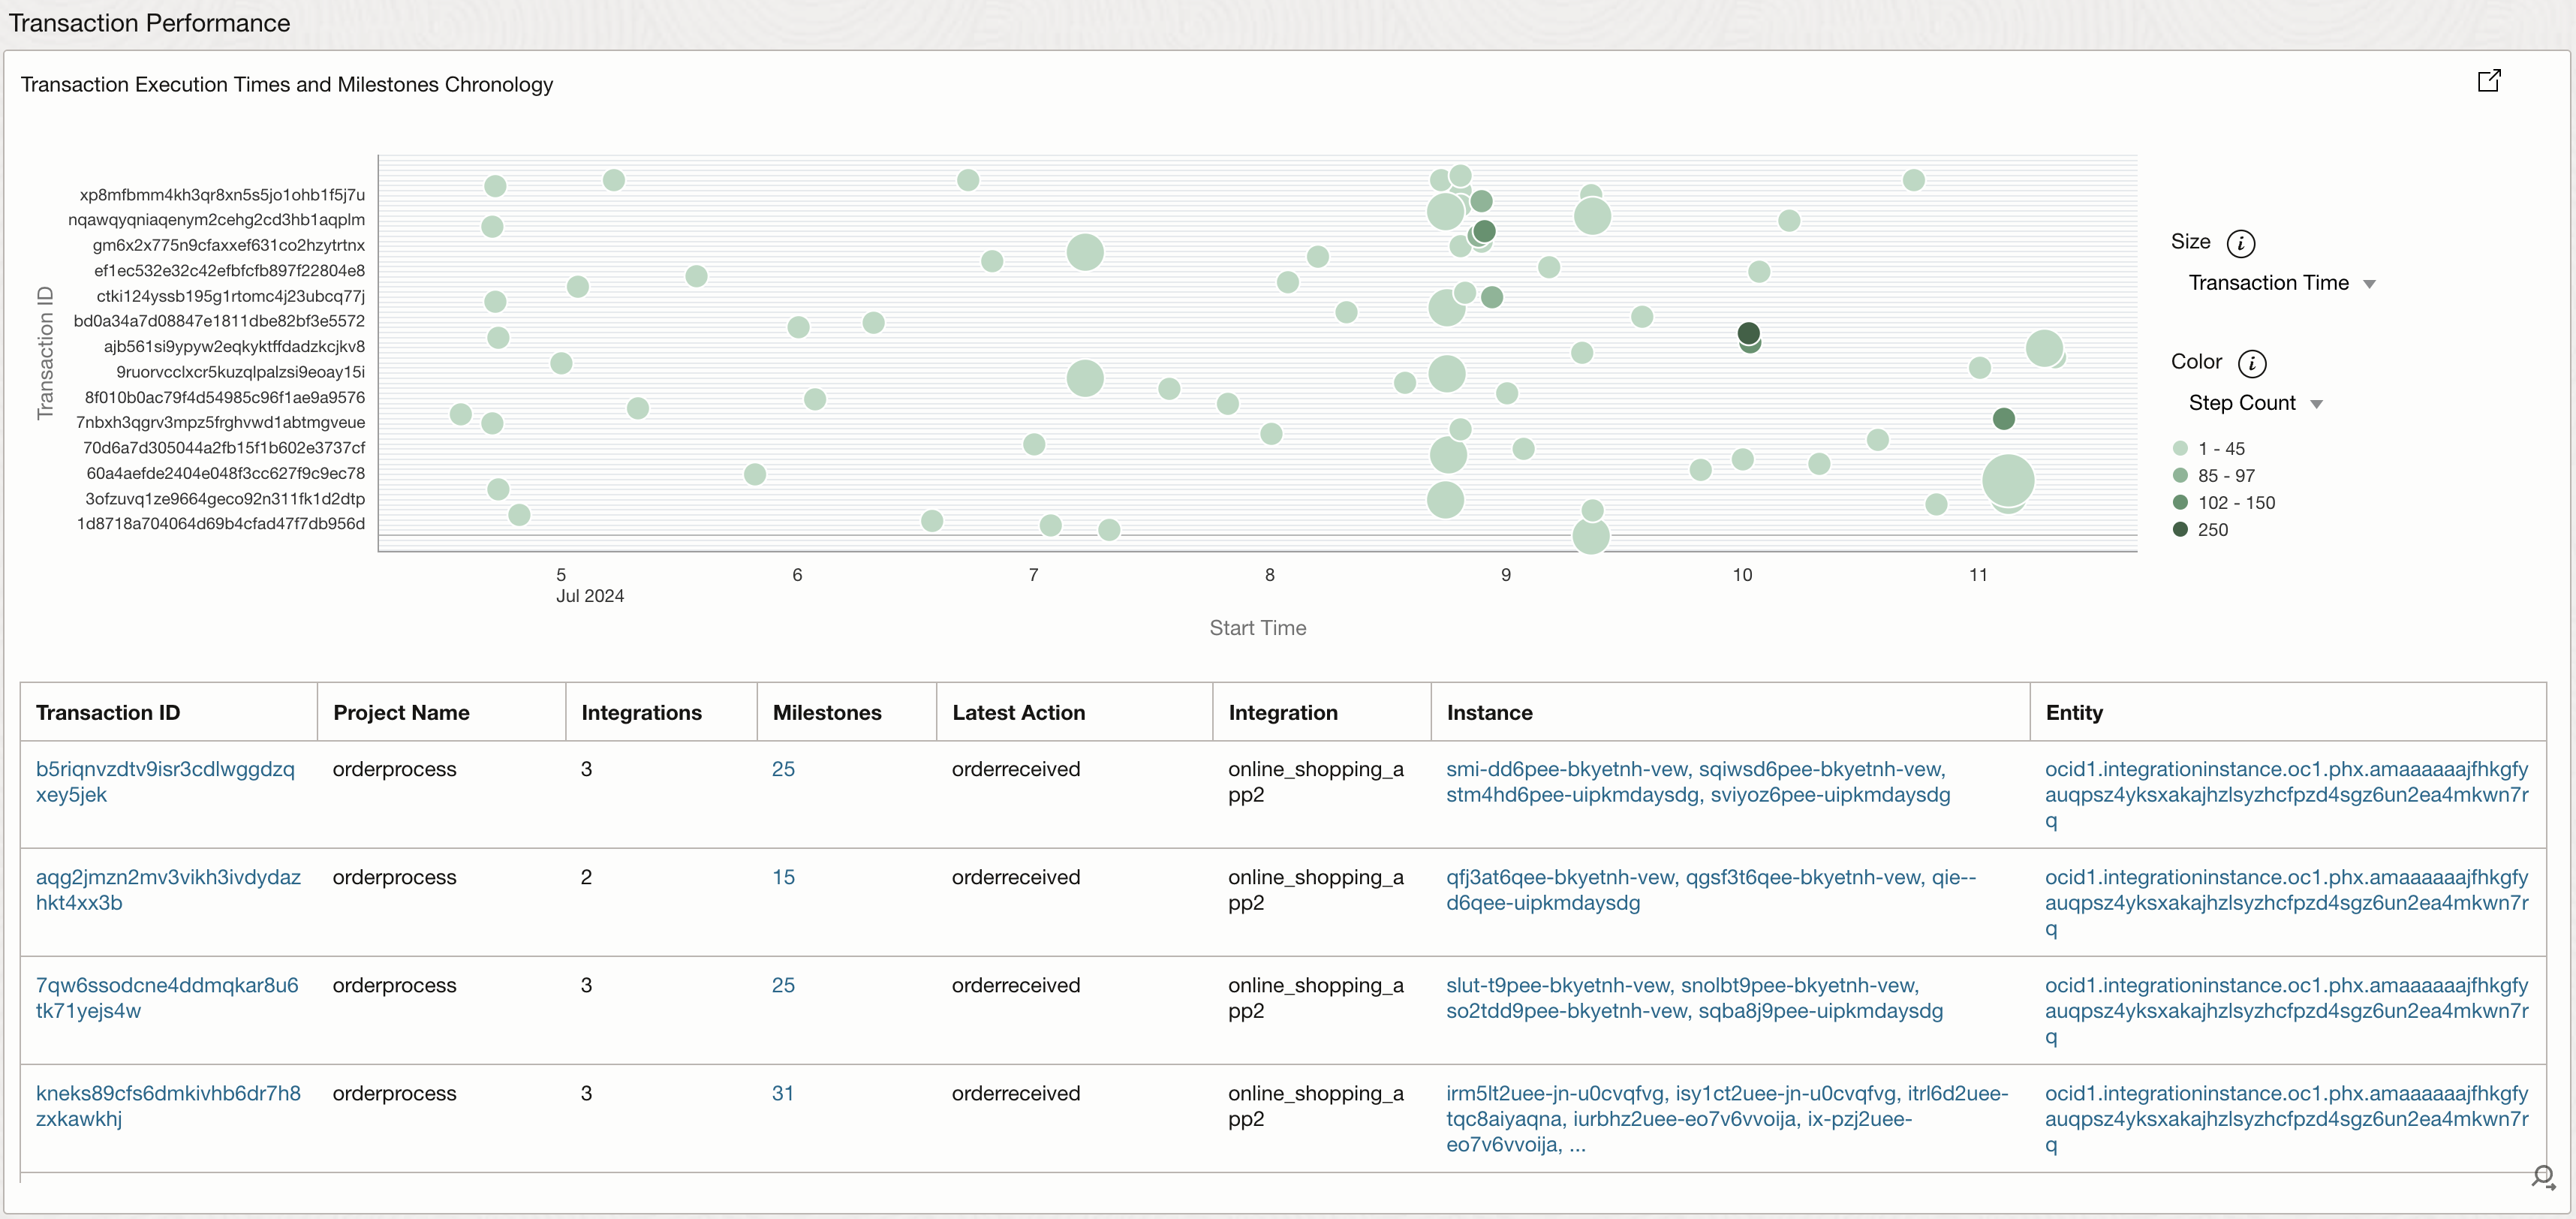
The second part of this widget shows these values in tabular format and you can click on the number shown in the Milestones column to view the chronological sequence of actions in each transaction with additional details.
Transaction Tracking Fields
The last section analyzes transactions based on tracking field names and values that you defined in your Integrations. Drill down on each of these to get more information like the last action execution, tracking field values, etc. Search the table for a specific tracking field (e.g. Orderid) or Tracking Field Value (e.g. order number: 123799)
Oracle Integration Insight dashboard is available in early preview for you to try! Checkout this blog for details. It will be available out-of-box in Logging Analytics with OIC3 24.08 Release.
Resources
- Blog: OIC3 Business Insight with OCI Logging Analytics
- Logging Analytics Dashboards and Visualizations
- Logging Analytics Documentation
- Oracle Integration Cloud Gen3 Documentation
- Logging Analytics Demo Videos
- Instructions for importing dashboard json file (See attachments or download from here ).