OCI Observability and Management services (O&M) provides a solution to help enrich Enterprise Manager (EM) monitoring. Any kind of target in your data center or on-premises may be monitored and managed by EM, but what about visibility into EM itself? This blog identifies the value that O&M services can offer to proactively identify health problems with an EM environment.
Oracle’s O&M solution includes two key services that can monitor EM sites running in OCI, on-premises, or another cloud provider.
Gain insight into the application stack’s activities, including database calls to the EM repository, by using O&M APM. The APM service provides deep visibility into the performance of applications and provides the ability to diagnose issues quickly to deliver a consistent level of service. Typically, EM admins use a third party tool to perform this monitoring. Now this can be done with O&M services. Since synthetic tests are inexpensive and easy to implement, let’s start with APM’s Availability Monitoring (the rebranded name for Synthetic Monitoring).
Availability Monitoring evaluates the availability of your application by testing it periodically from multiple vantage points. For example, you can place these synthetic tests throughout the application stack. These tests ensure that while WebLogic is running, scripted user activity can successfully be performed, and a page or REST endpoint is available and responding as planned.
Customers benefit from the easy setup of the Availability Monitoring, with little to no intrusion at all to the EM application. You can detect connectivity issues of the EM graphical interface or REST endpoints. This is an added level of monitoring that allows you to test the user experience, response time, availability of the UI, and if a component is not working correctly. Before this capability was available in APM, EM admins performed manual troubleshooting and added third party application complexities that drained resources. Availability Monitoring makes it easier for you to troubleshoot and identify the problem areas quickly. As a result, EM response times are reduced and performance is increased. For any customer with multiple databases or complex environments this helps streamline monitoring. No longer are you manually troubleshooting monitoring issues and utilizing key resources to unlock where a problem is, it is done automatically with APM.
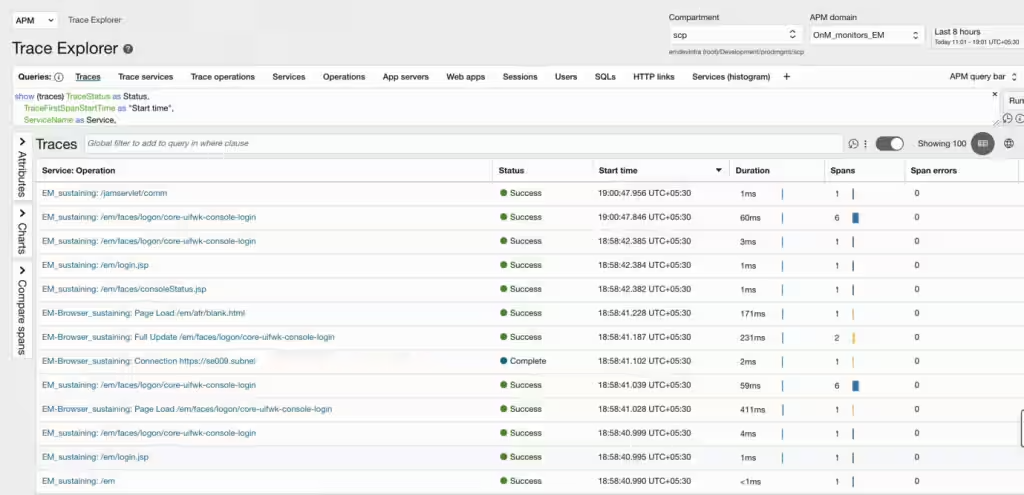
APM’s Distributed Tracing creates a view for the exact amount of time that the EM application spends on each EM component level. When browser instrumentation is enabled, backend calls are entirely traceable to the user experiences, and you can pinpoint what the end user is experiencing with the EM application.
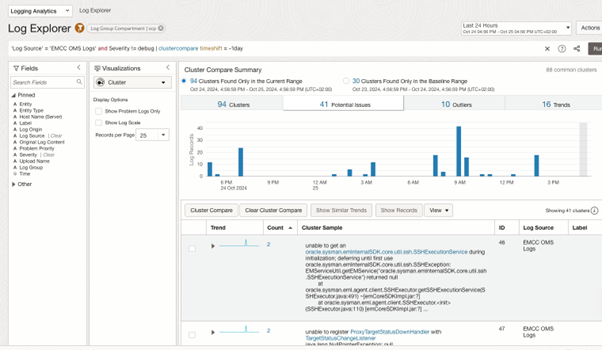
OCI Logging Analytics is a cloud solution that lets you index, enrich, aggregate, explore, search, analyze, correlate, visualize and monitor all log data from your applications and system infrastructure on cloud or on-premises. Configure LA to ingest WebLogic’s OMS logs, EM Agent logs and the Oracle Database OMR database logs, and set up alerts when errors occur. These logs can be utilized to gain greater insights into the performance and health of EM.
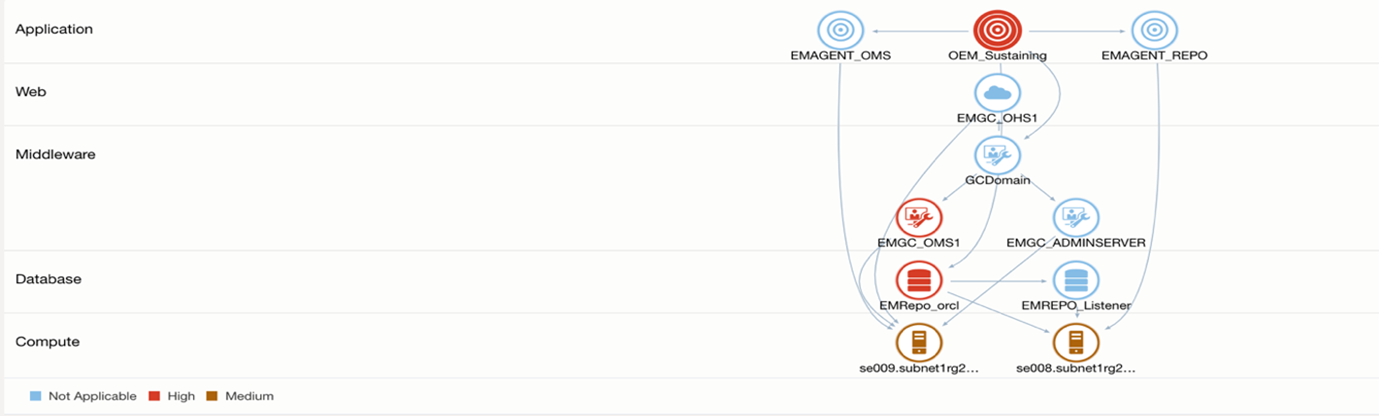
Logging Analytics EM topology driven troubleshooting can help you quickly identify the root cause of a problem. In the past, EM customers had to log service requests to troubleshoot and now it can be done automatically. Within minutes, issues can be identified amidst thousands of lines of log records.
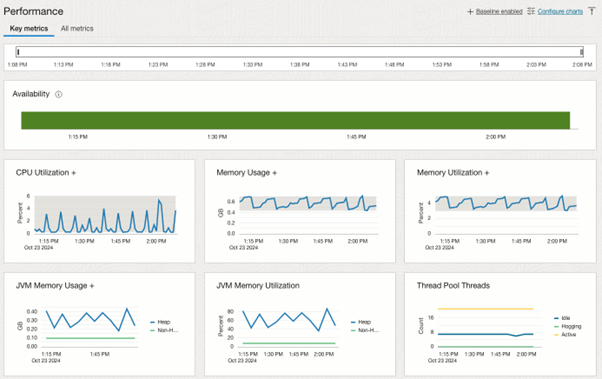
Other O&M services can be also utilized in your monitoring of Enterprise Manager. Depending on your business needs, you can keep an eye on every element of the EM application stack by using the Stack Monitoring service. Once the components of EM stack are discovered, this service begins gathering metrics proactively for all components of the stack, offering anomaly detection for the gathered metrics.
With monitoring implemented and alarms defined, you can create an EM health dashboard to assimilate metric data across all O&M services. The dashboards can include synthetic test results with latency from APM, error counts from Logging Analytics, and availability and performance charts from Stack Monitoring.
In addition, the Database Management service can be enabled for the repository database which aids in further performance analysis and monitoring. Ops Insights can help with capacity planning for the repository host and database. Based on AutoML forecasting and other models for the collected data, you can trend and forecast resources such as CPU, memory, and storage utilization.
For full details on setting up these services for your EM environment, visit this GitHub repository.