Docker Engine is a well-known industry container runtime that runs on various Linux (CentOS, Oracle Linux, RHEL, SUSE, Ubuntu and others) and Windows Server operating systems. Docker Engine monitoring is critical for running containerized applications. Observability and management of mission-critical containerized applications requires robust tools. The agent offers out-of-the-box capabilities to collect metrics using Prometheus exporter scrapping. In this blog we will describe how to collect Prometheus metrics from Docker Engine using the agent.
Prerequisites for OCI Management Agent
Depending on your environment/cloud you can choose from multiple ways to set up the agent. If you are using non-OCI compute instances (on-premises environments or 3rd party cloud VMs), you can download the installers available for your platforms from the OCI Console (refer to the Management Agent documentation).
If you are using OCI Compute instances, you can enable the agent from the OCI Console directly. You do not need to download and install the agent (refer to Deploying Management Agent on Compute Instances).
The agent is also available as a container image and is hosted on Oracle Container Registry for use in containerized environments (Docker, Kubernetes, and so on).
Dynamic Group and Policies for OCI Management Agent
OCI relies on Identity policies to allow access to your resources in the Oracle Cloud.
Create a dynamic group for the agent if it doesn’t already exist, for example, Management-Agent-Dynamic-Group:
Management-Agent-Dynamic-Group
ALL {resource.type='managementagent', resource.compartment.id='ocid1.compartment.oc1..aaaaaaaa ...mia'}
Where: resource.compartment.id is the compartment OCID of the agent.
Visit the Managing Dynamic Groups documentation for details on how to create a Dynamic Group.
The following policy statement will allow the agent to post the metrics to the intended OCI Monitoring namespace.
allow dynamic-group Management-Agent-Dynamic-Group to use metrics in compartment <PROMETHEUS METRIC COMPARTMENT> where target.metrics.namespace = '<OCI_MONITORING_NAMESPACE>'
Note:
- The compartment should be the name of the compartment where the agent is expected to emit metrics to.
- The namespace must be the OCI Monitoring Namespace into which you expect the agent to emit the metrics to.
You will need to restart the agent before the policy changes will be applied to the agent.
Enable Docker engine to emit Prometheus metrics to OCI
The Docker engine can be enabled to emit Prometheus Metrics. Instructions to enable emitting Prometheus metrics are available in the official Docker documentation.
In some cases, based on the version of Docker engine you may have to add the experimental flag along with the metrics-addr.
The experimental flag in daemon.json:
{

"metrics-addr" : "0.0.0.0:9323",
"experimental" : true

}
You will need to restart your Docker daemon after making the change.
This configuration will allow the metrics to be pulled from the port 9323 on the host.
Example: If the fully qualified hostname is myhost.abc.com then the URL for scraping the metrics would be: http://myhost.abc.com:9323/metrics
Configure OCI Management Agent to scrape Prometheus metrics
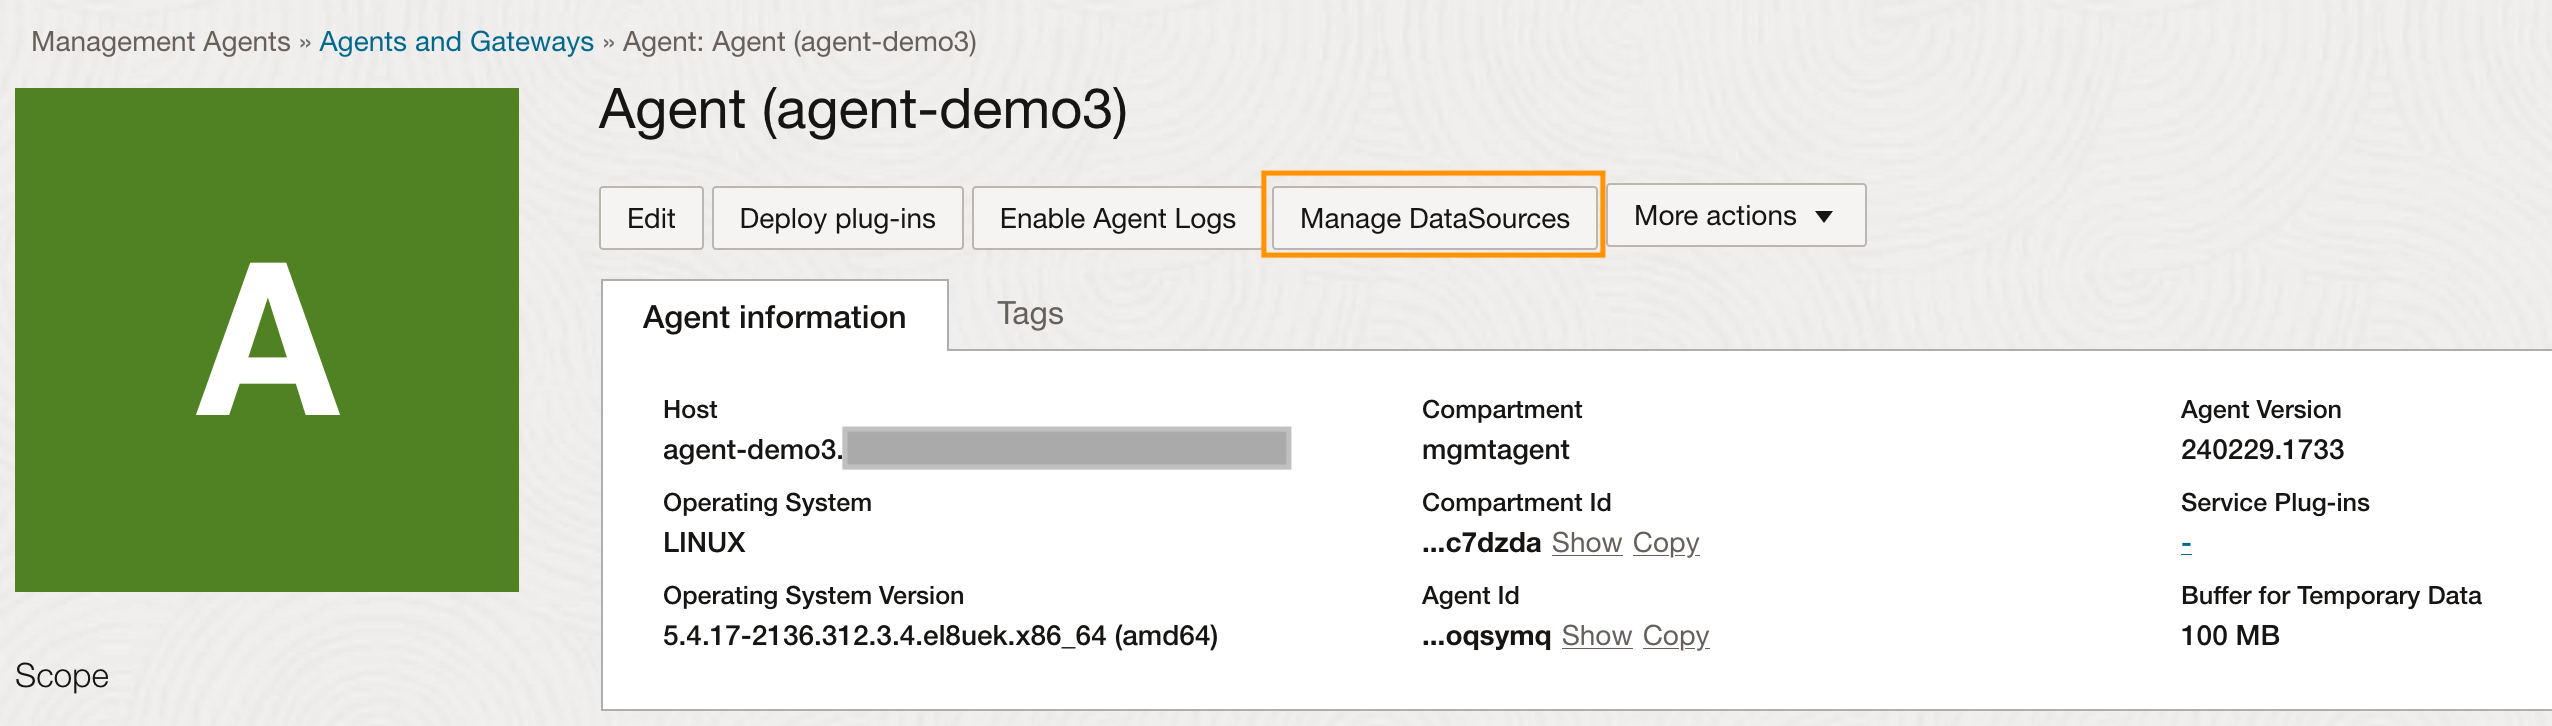
Navigate to the agent in the OCI Console and click on the “Manage DataSources”.
Click on the Add DataSource button to configure the agent with the Prometheus Emitter for Docker Engine that was configured in the previous step.
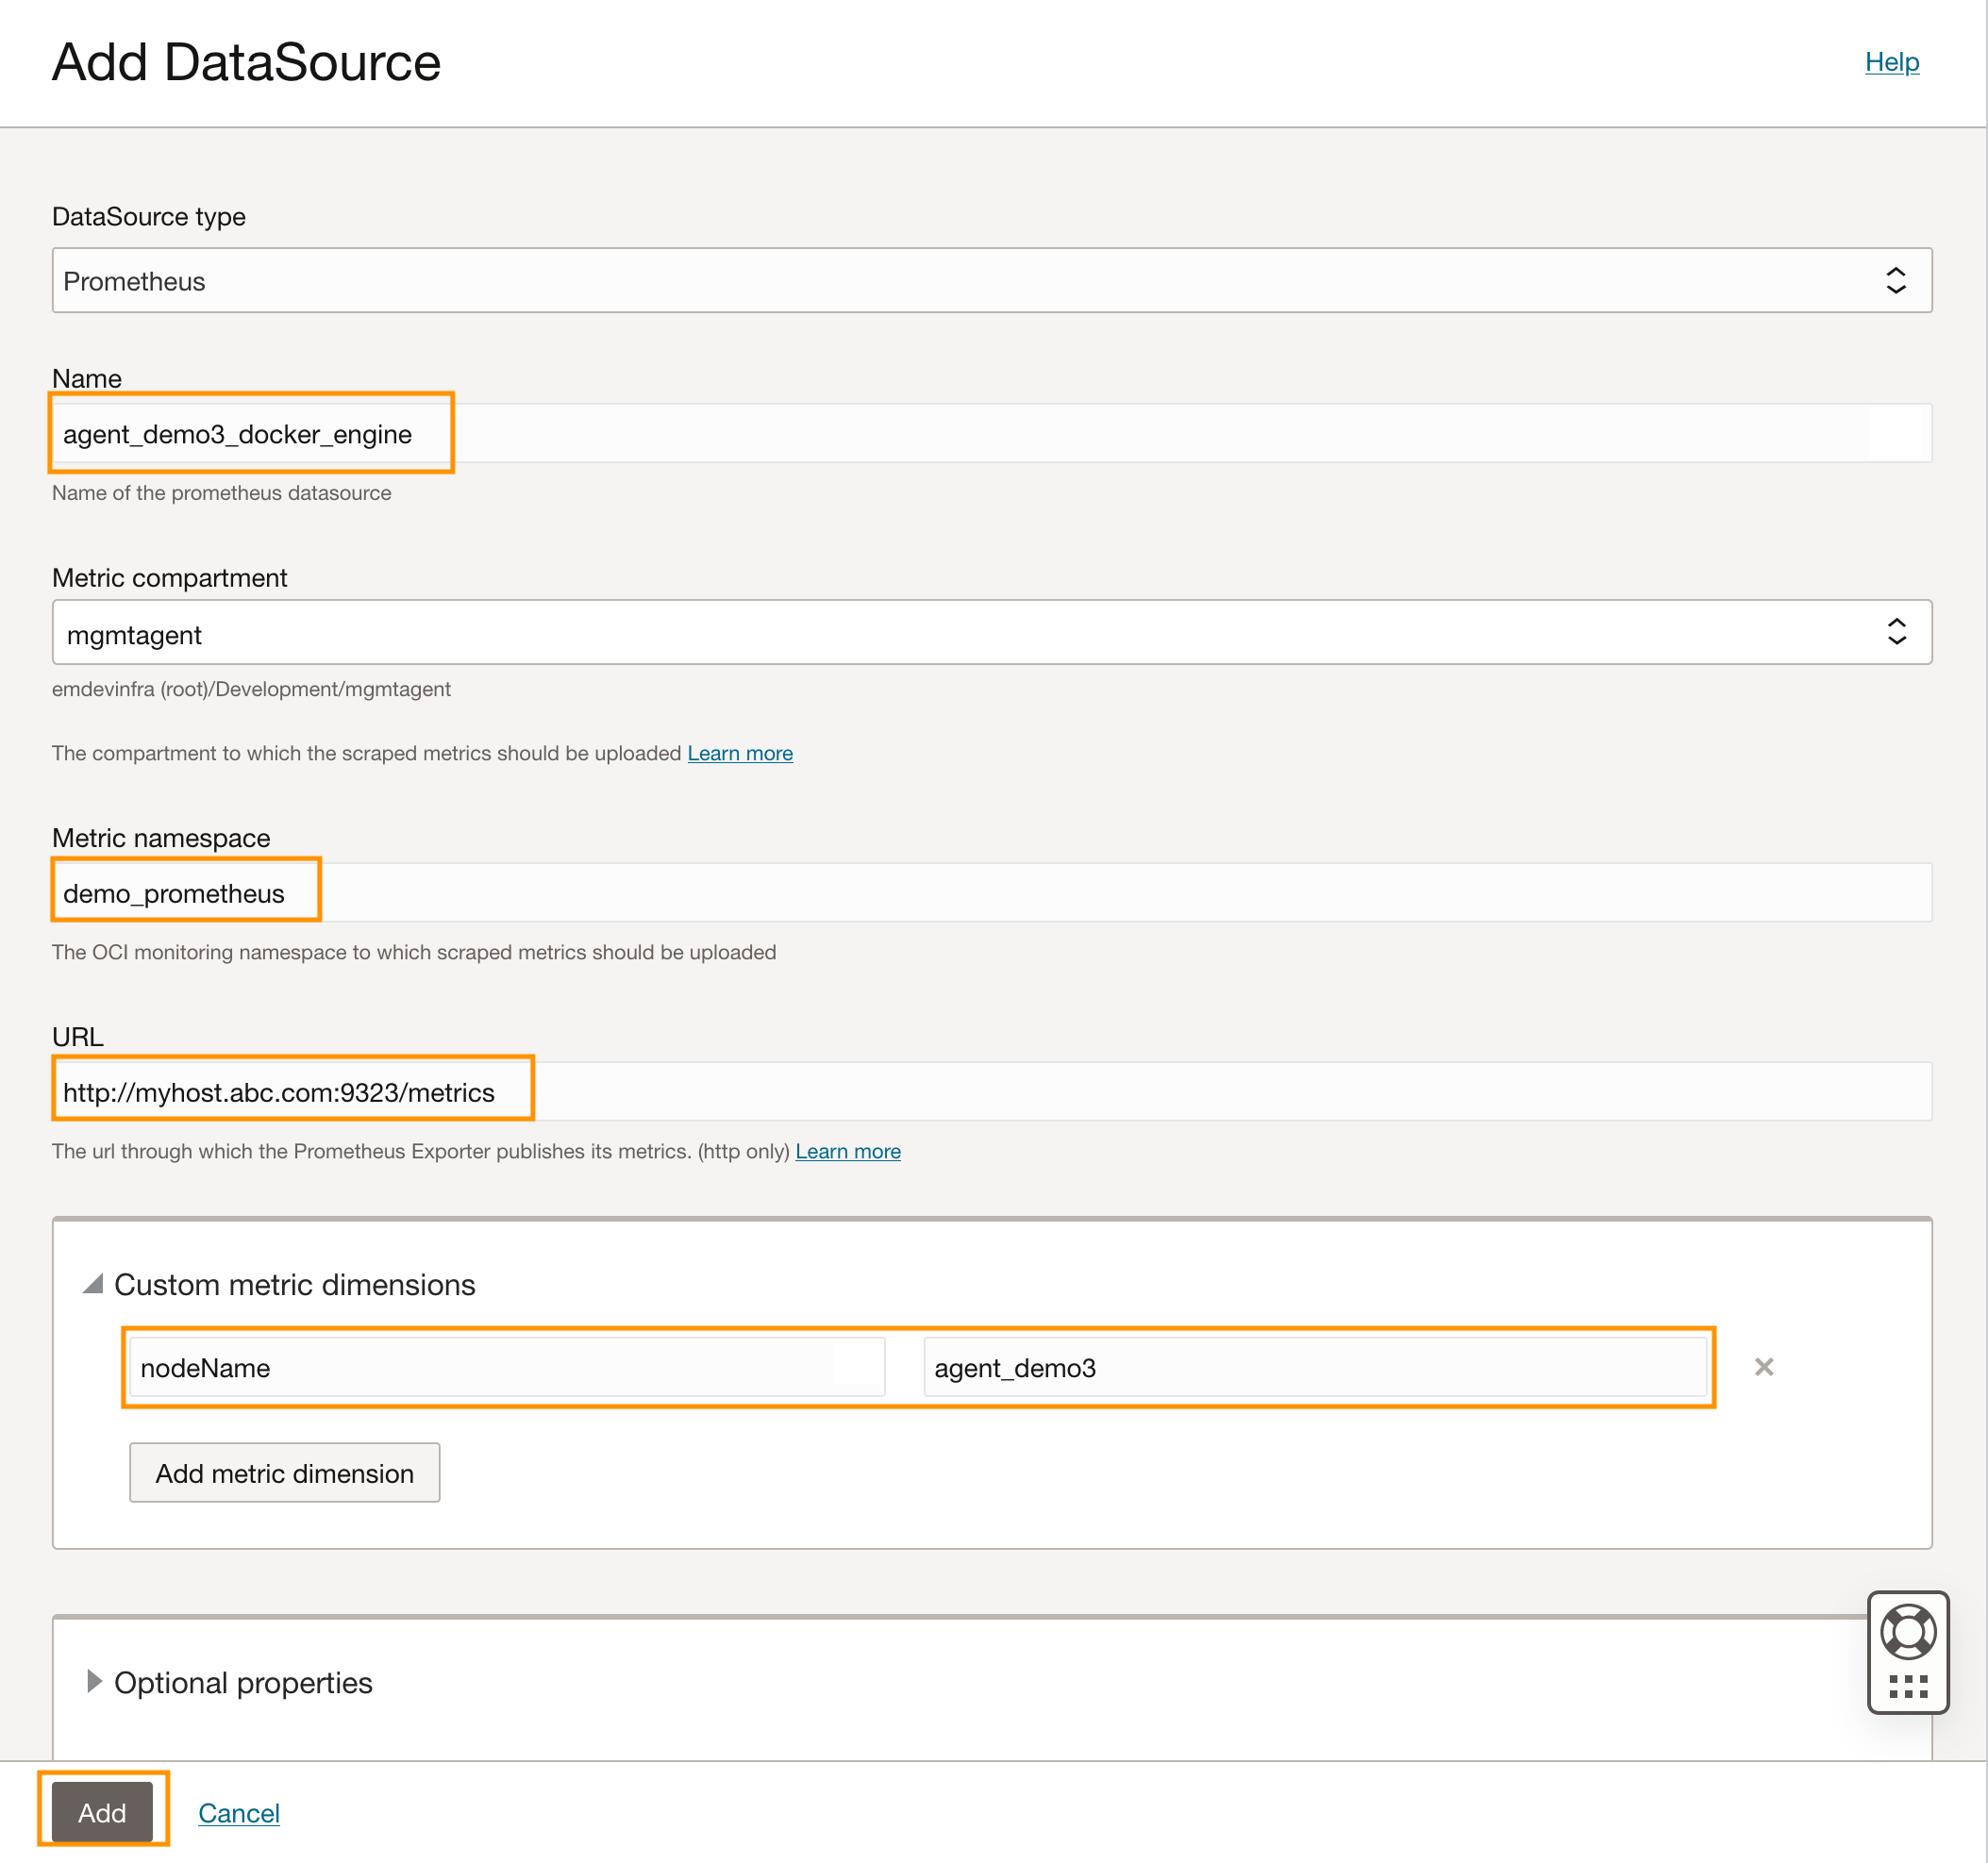
Fill in the highlighted text which provides details about the data source you are adding to the agent.
| Field | Description |
|---|---|
| Name | This is the name given to the datasource |
| Metric Namespace | This is the metric namespace in OCI Monitoring where the docker engine metrics would end up in. You need to ensure that the policy is set for the agent to emit metrics to the compartment and the namespace chosen in this screen. |
| URL | This is the URL of the docker engine from which the agent will scrape the metrics. See previous step for setting up the Docker Engine to emit Prometheus metrics. |
| Custom metric dimensions (optional) | This allows you to specify any optional dimensions that you want associated with every metric emitted to OCI Monitoring. In this case, you will be able to attach a nodeName dimension that has a value of agent-demo3 associated with every docker engine metric. |
Clicking on the Add button will push this configuration down to the agent and in a few minutes, you should start seeing metrics in OCI Monitoring.
Note: This assumes that:
- You have set up the correct policies to allow the agent to emit metrics to OCI Monitoring
- The agent is able to connect to http://myhost.mycompany.com:9323/metrics
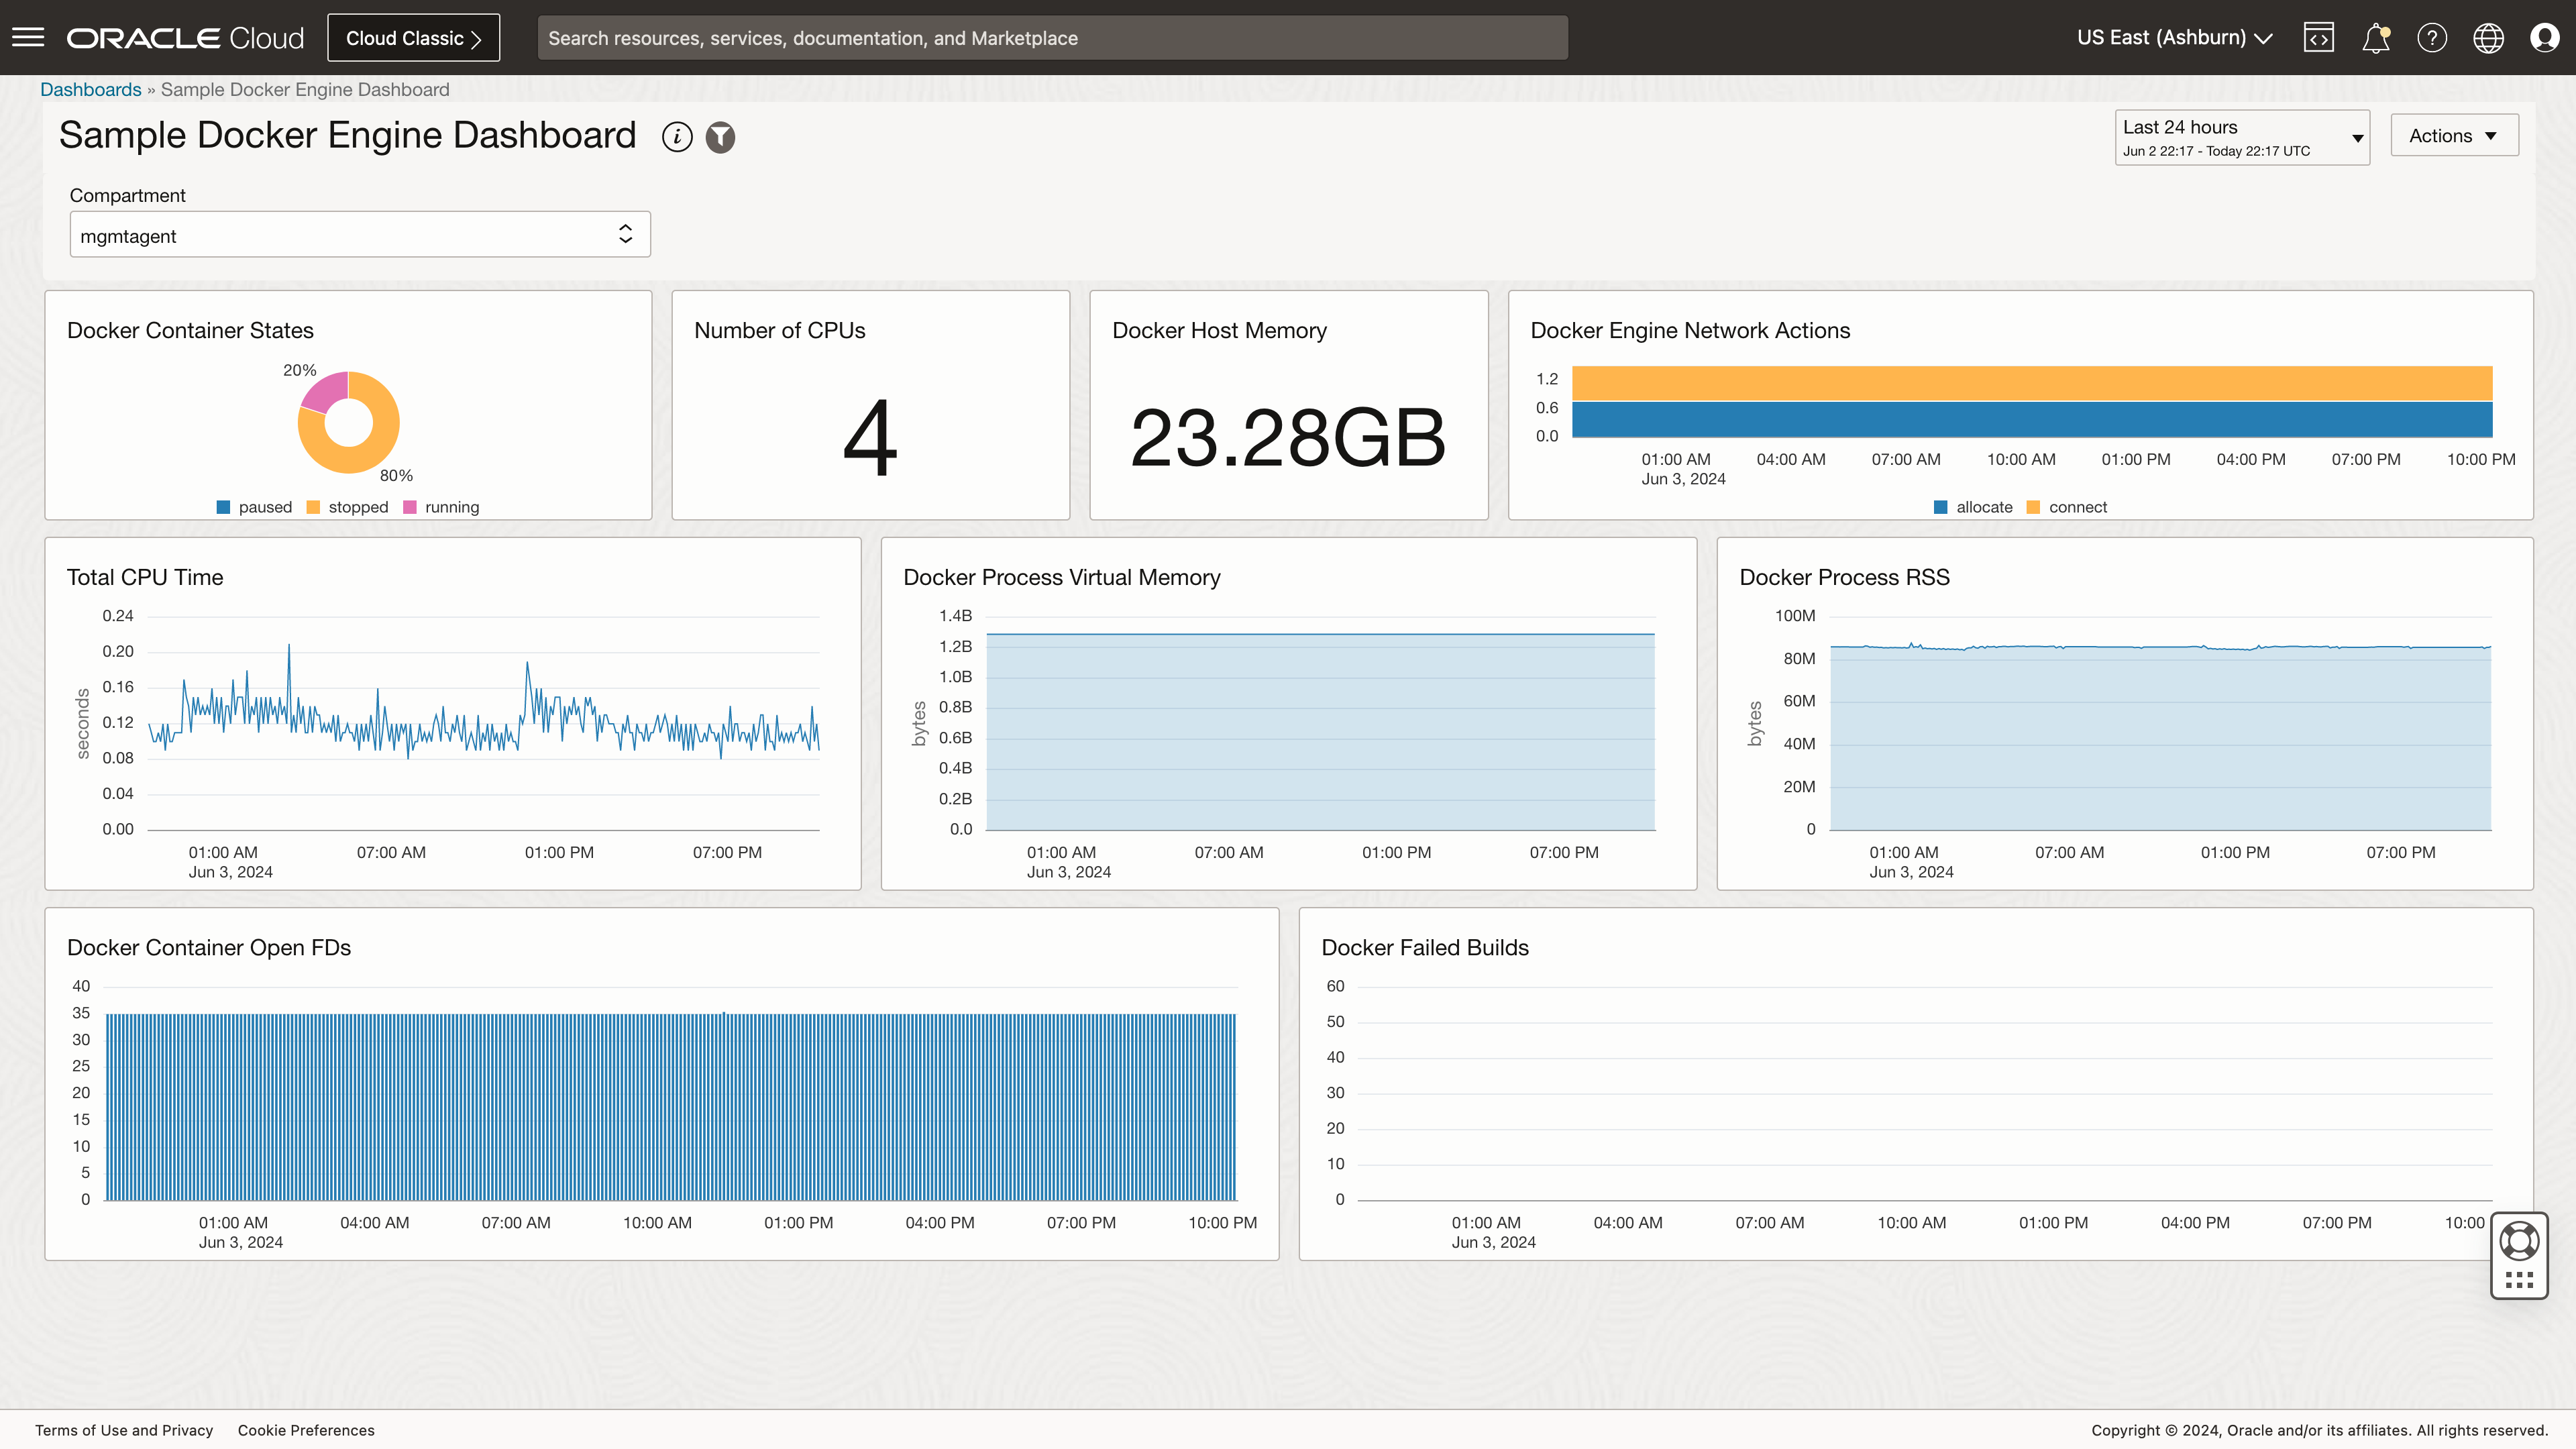
Import the sample dashboard to visualize the metrics collected by OCI Management Agent
The sample dashboard JSON file is available here.
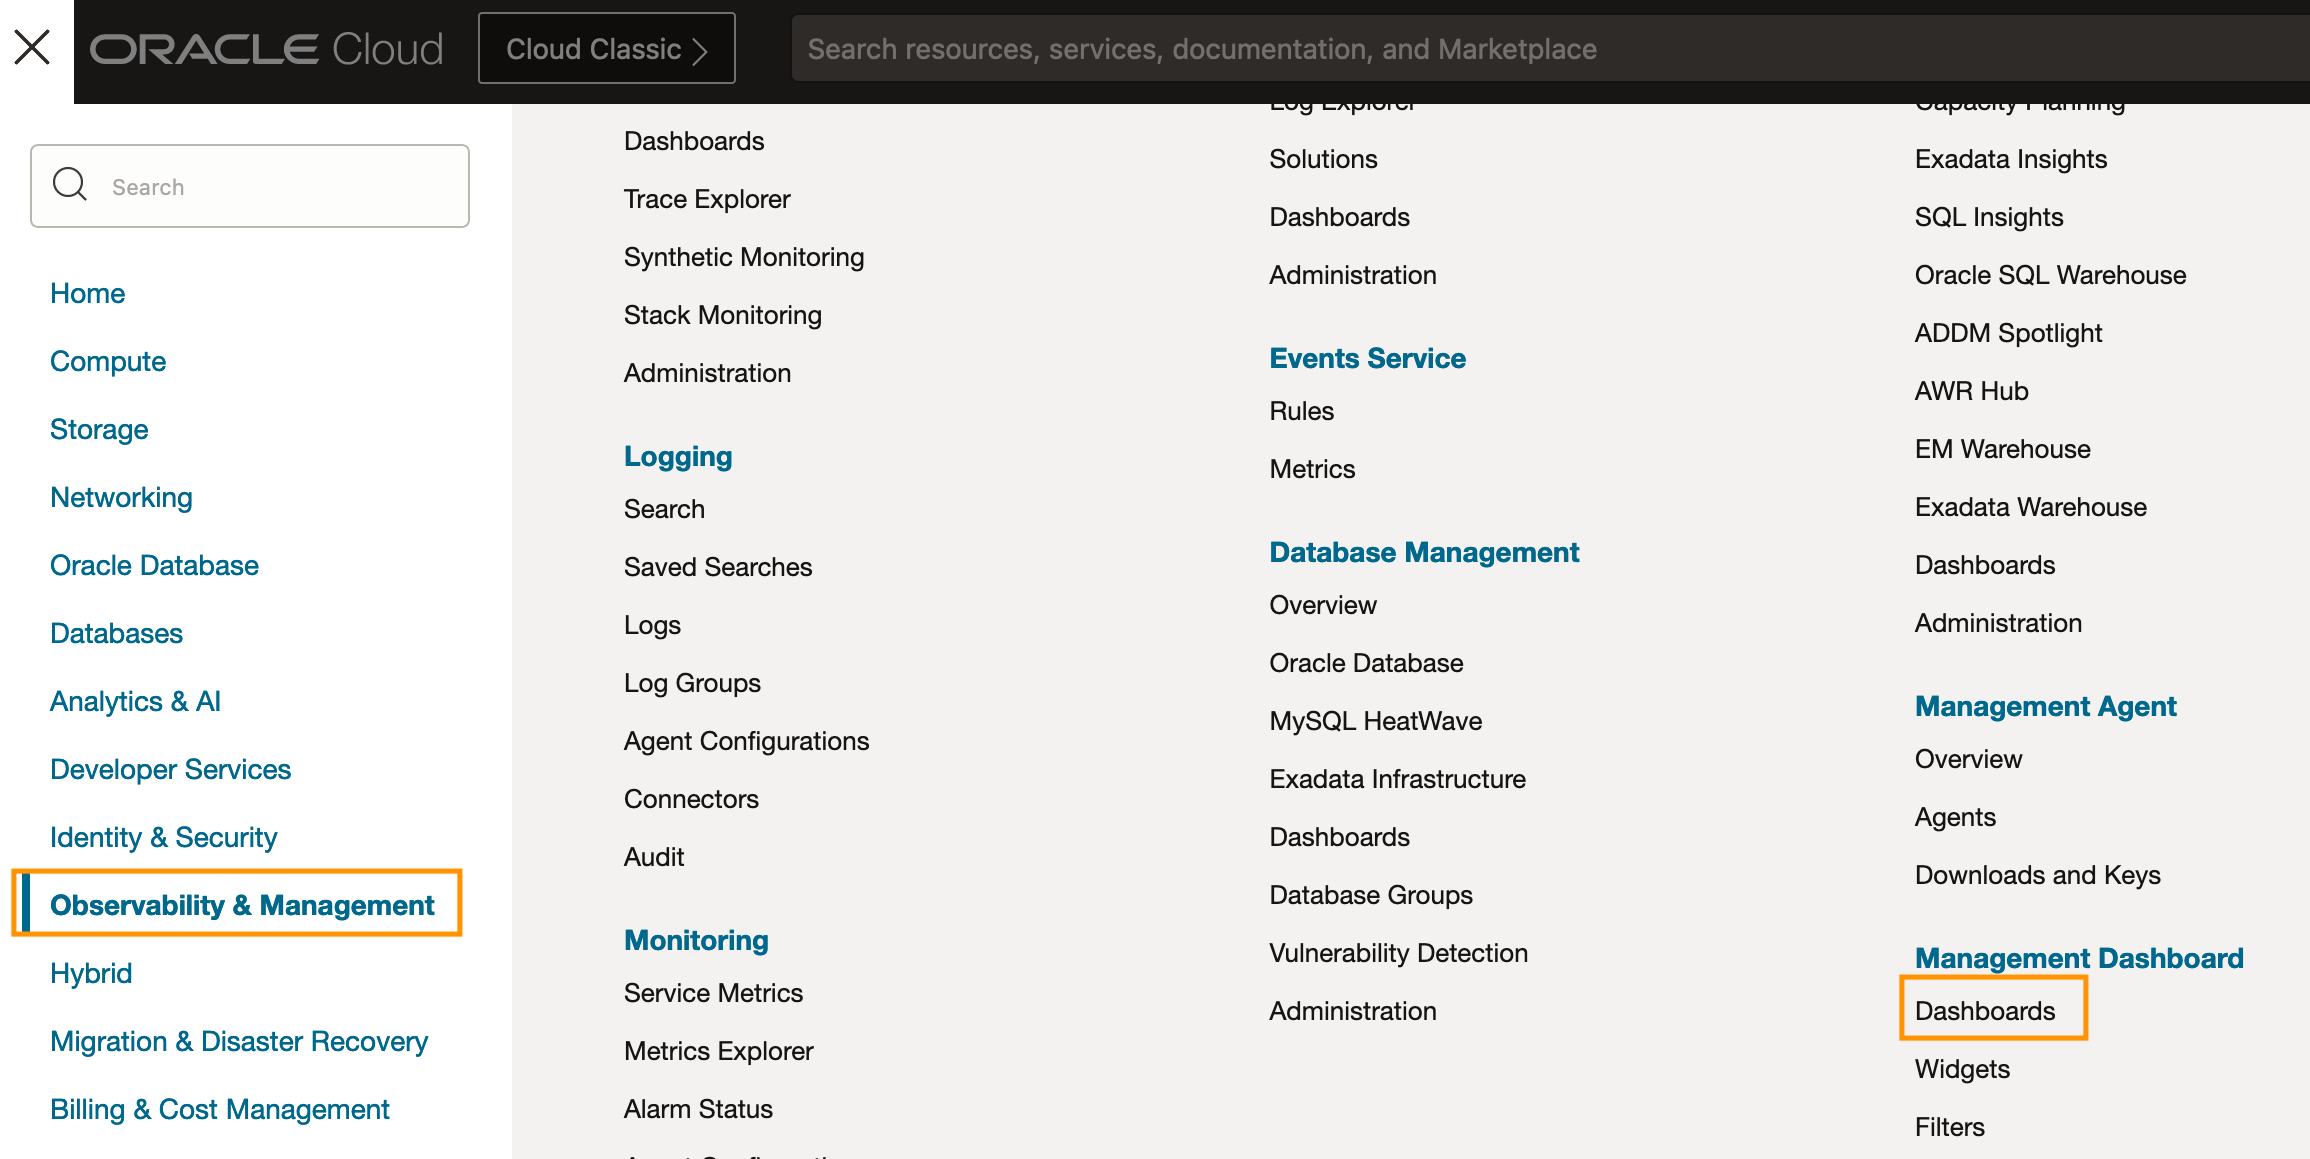
Navigate to the agent Dashboards listing:
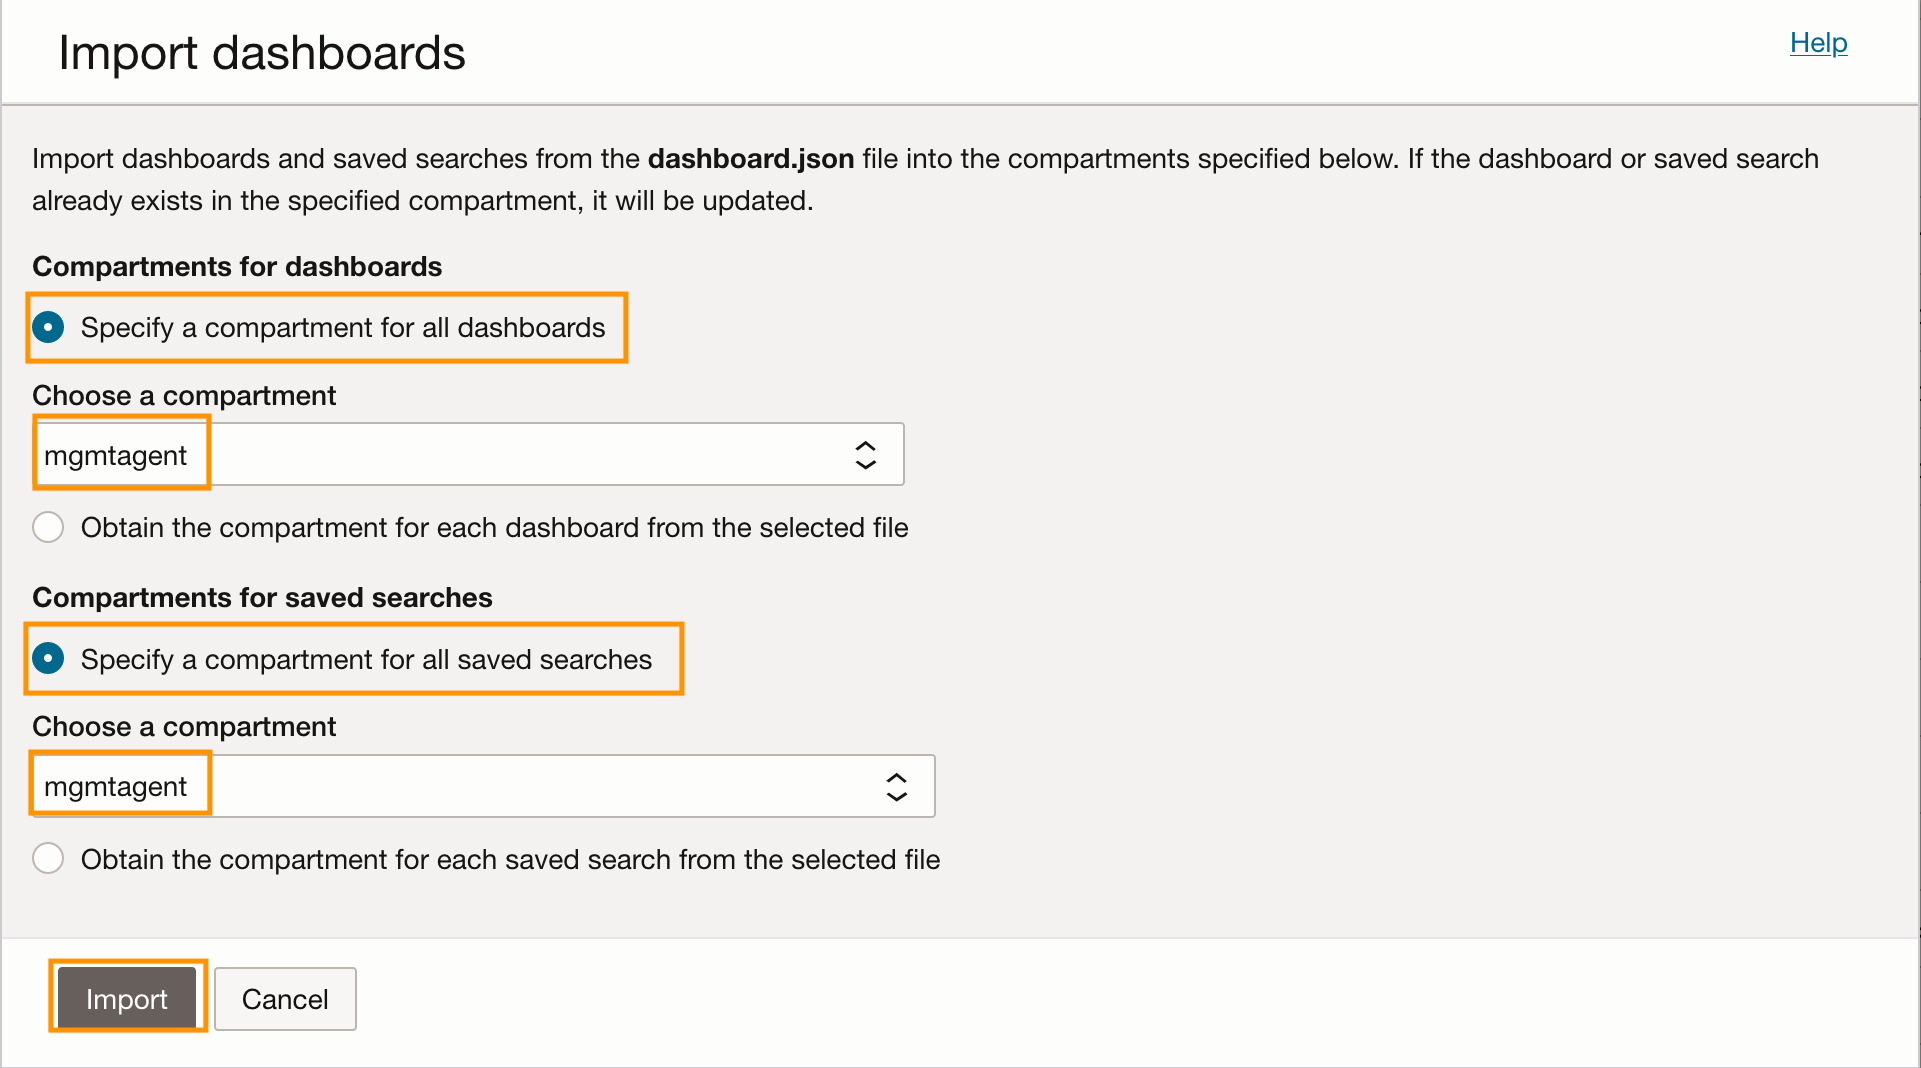
Import the Dashboard by clicking on the Import dashboards button and selecting the JSON file that you have downloaded. Ensure that you import the dashboard and the saved searches in the right compartment. See highlighted text here:
Click on the imported dashboard to view the metrics.
Conclusion for using OCI Management Agent to monitor Docker environment
Oracle Cloud Observability and Management platform provides pre-integrated and ready-to-use services that build on each other. The agent is a foundational component of OCI Observability and Management, offering Swiss-knife-like capabilities for data collection. Prometheus scrapping based collection is built in the agent and can be setup using UI wizard to bring rich metric data into OCI Observability and Management services.
References for using OCI Management Agent to monitor Docker environment
- Setting up Prometheus collections using Management Agent
- Sample Docker Engine Dashboard
- Learn about OCI Observability and Managment