Oracle Application Performance Monitoring (APM) provides deep visibility into the performance of applications, allowing you to quickly diagnose problems and deliver the desired level of service. This includes the monitoring of the multiple components and application logic spread across clients, third-party services, and back-end computing tiers, on-premises or on the cloud.
Introducing APM Learning Guides
Oracle Guided Learning (OGL) in-application interactive guides make it easy to provide personalized, immersive assistance directly into our application interfaces. They allow you to experience APM and other O&M services in a brand new way! These tours and guides can provide continuous learning opportunities for various capabilities, in real time, while using the product.
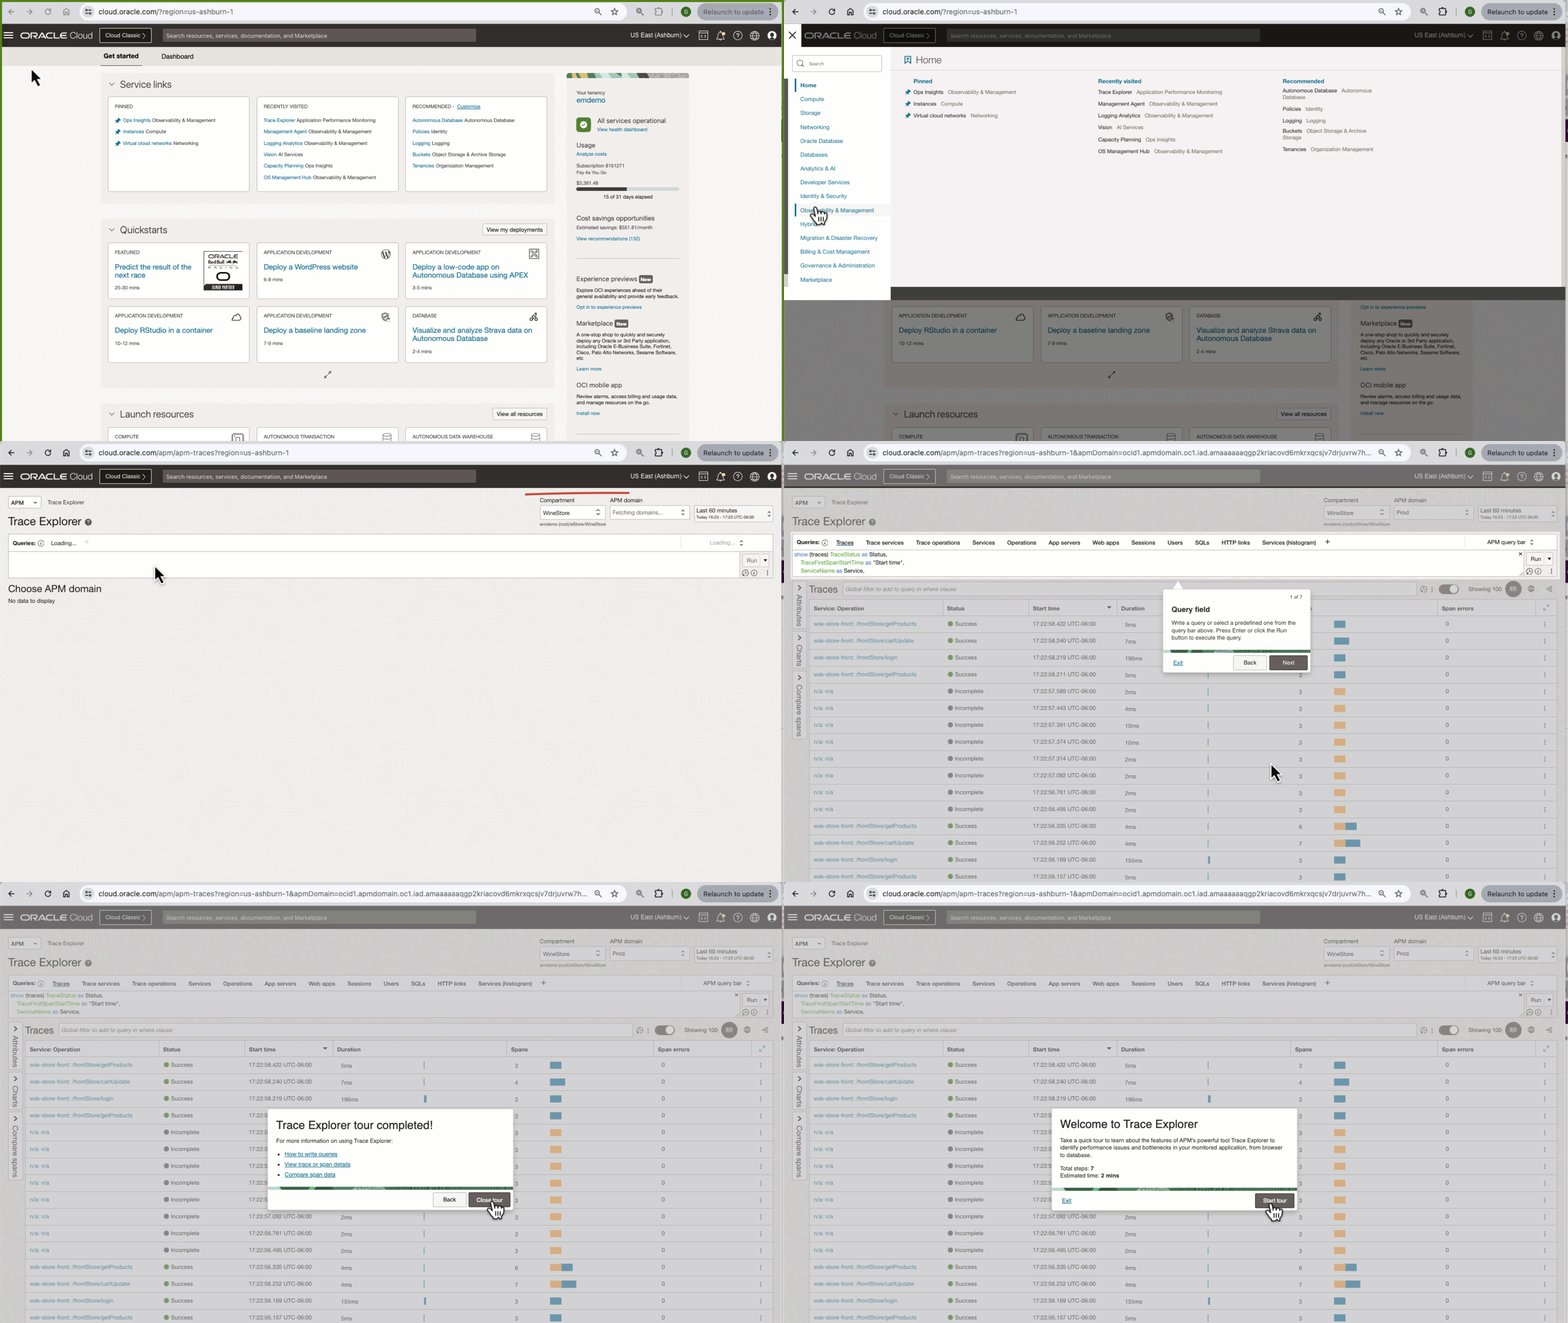
An introductory OGL-based guide was just released and it features APM’s traces and spans analysis interface, Trace Explorer. This tour is automatically launched when you navigate to the Trace Explorer main page, in an APM-enabled environment, with an APM domain and data sources configured. The guide can also be launched on-demand later from the “?” icon located next to the page title.
This guide may look familiar since it provides a similar guided learning experience to other OCI services and Oracle Cloud applications. See it in action below:

Or, better yet, enable APM in your compartment, collect data, and learn about Trace Explorer directly in the product!
Enjoy learning Trace Explorer’s key components and capabilities today!
To learn more about Application Performance Monitoring, visit:
- Oracle Cloud Observability and Management Platform
- Application Performance Monitoring Technical Content
- Hands-on APM Oracle LiveLabs Workshops
Other Resources
For more blogs on Oracle APM, visit the Observability and Management – Application Performance Monitoring blog space.
