We’ll show how you can source Oracle GoldenGate (OGG) server logs with OCI Log to proactively notify through OCI Notification when an error is detected in the logs. Then use Service Connector Hub to route the logs into Lo Analytics for detailed analysi and root-cause identification.
You can use the OGG error log to view:
- See a history of GGSCI commands used
- View the Oracle GoldenGate processes that started and stopped
- Understand what processing was performed
- Check if any errors occurred or if there were any informational and warning messages
Since the OGG error log details events as they occurred in sequence, it is a good method to use for detecting the cause of an error. For example, you might discover that:
- Someone stopped a process
- A process failed to make a TCP/IP or database connection
- A process could not open a file
The are several ways the error log can be natively viewed:
- Standard shell command to view the ggserr.log file within the root Oracle GoldenGate directory
- Using Oracle GoldenGate Director or Oracle GoldenGate Monitor
- VIEW GGSEVT command in GGSCI. See Reference for Oracle GoldenGate for Windows and UNIX.
Directing GoldenGate Error Logs From OCI Log to OCI Log Analytics
Oracle Cloud Infrastructure Log Analytics service enables you to index, enrich, aggregate, explore, search, analyze, correlate, visualize and monitor all log data from your applications and system infrastructure.
In this example, where the OCI Log service is already being used, we will cover how you can use it to also source logs from OGG. OCI Log service is a fully managed, scalable log management and search platform that simplifies collecting, managing and exploring logs.
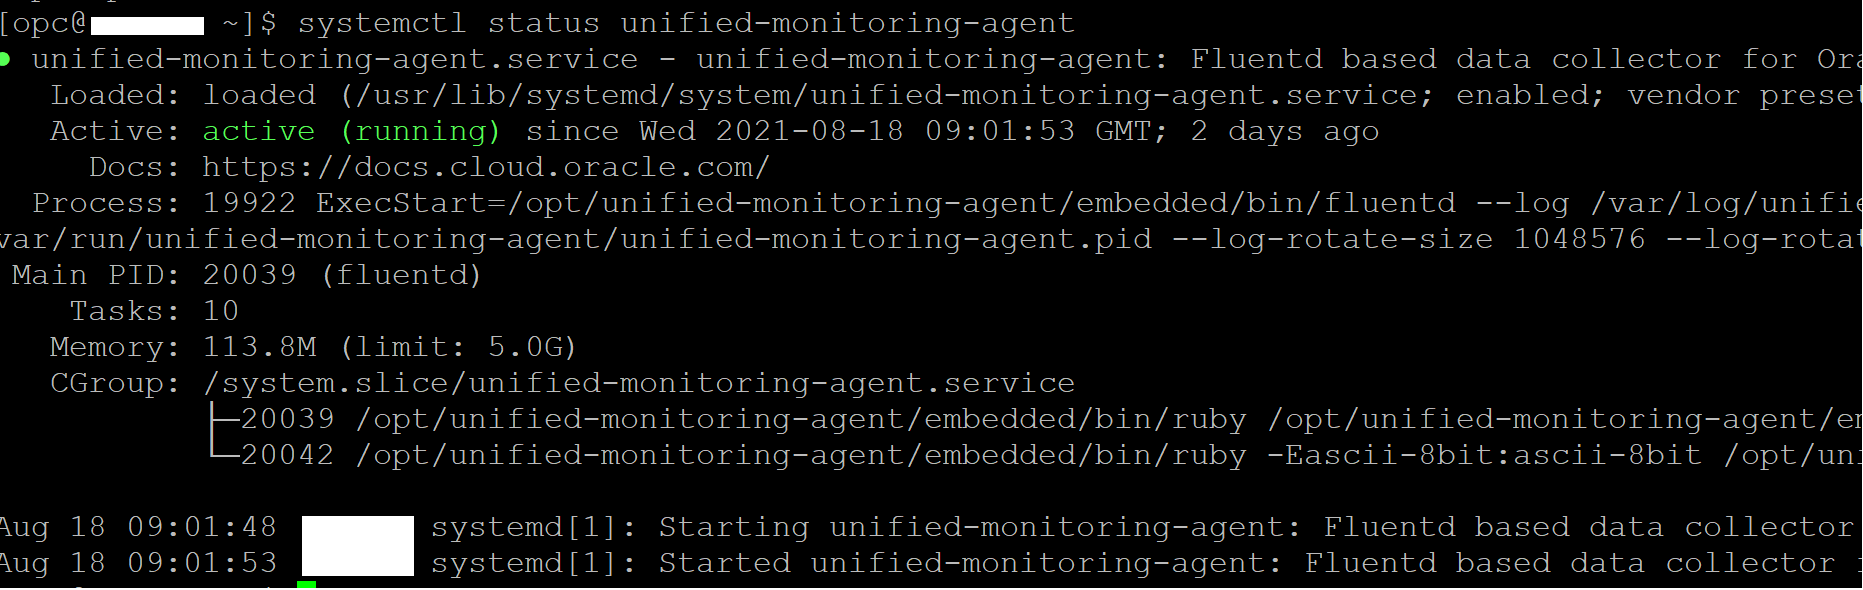
1. To get started, you will use the OCI Log custom log capability, since OGG logs are not supported Out of Box with this service. The Oracle Unified Monitoring agent is included by default on the latest Oracle Linux images. View the instructions in the OCI Log Documentation on how to install and verify the agent. We can check if the agent is installed and running by executing this via ssh on the server where OGG logs exist.
systemctl status unified-monitoring-agent
The underlying OGG error logs in one of the below OCI compute instance where there is Unified Monitoring Agent running and enabled.
Also, validate that Custom Logs Monitoring is enabled for the same OCI compute instance from the OCI Console Compute Instances page.

2. After the agent is installed, a dynamic group needs to be created. Dynamic groups allow you to assign permissions to Virtual Machines and allow these systems to autonomously perform specific actions against Oracle Cloud Infrastructure services. In this manner you allow applications and systems running on your Virtual Machines to use the Logging Service, for example, to dynamically push logs to the centralized service in near-real-time. See Dynamic Group for more information.
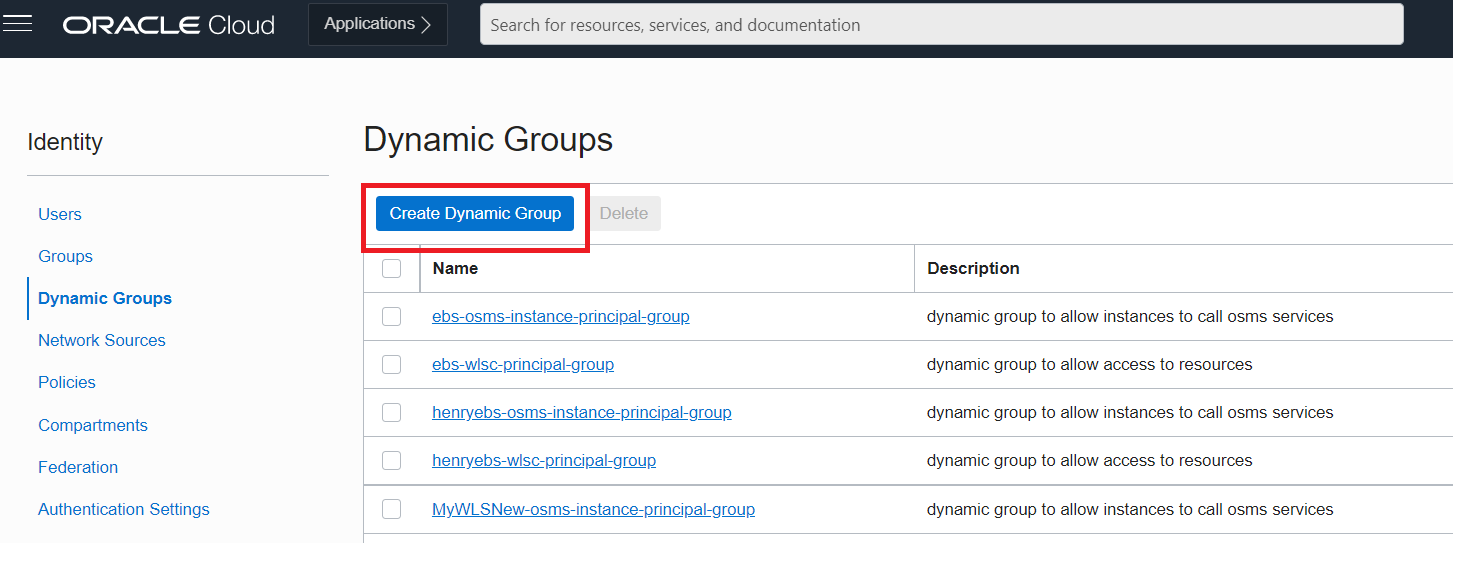
In the OCI Console, from the left side, select the navigation icon (looks like 3 bars), drop down the menu and click Identity & Security and then navigate to Dynamic Groups and select Create Dynamic Group.
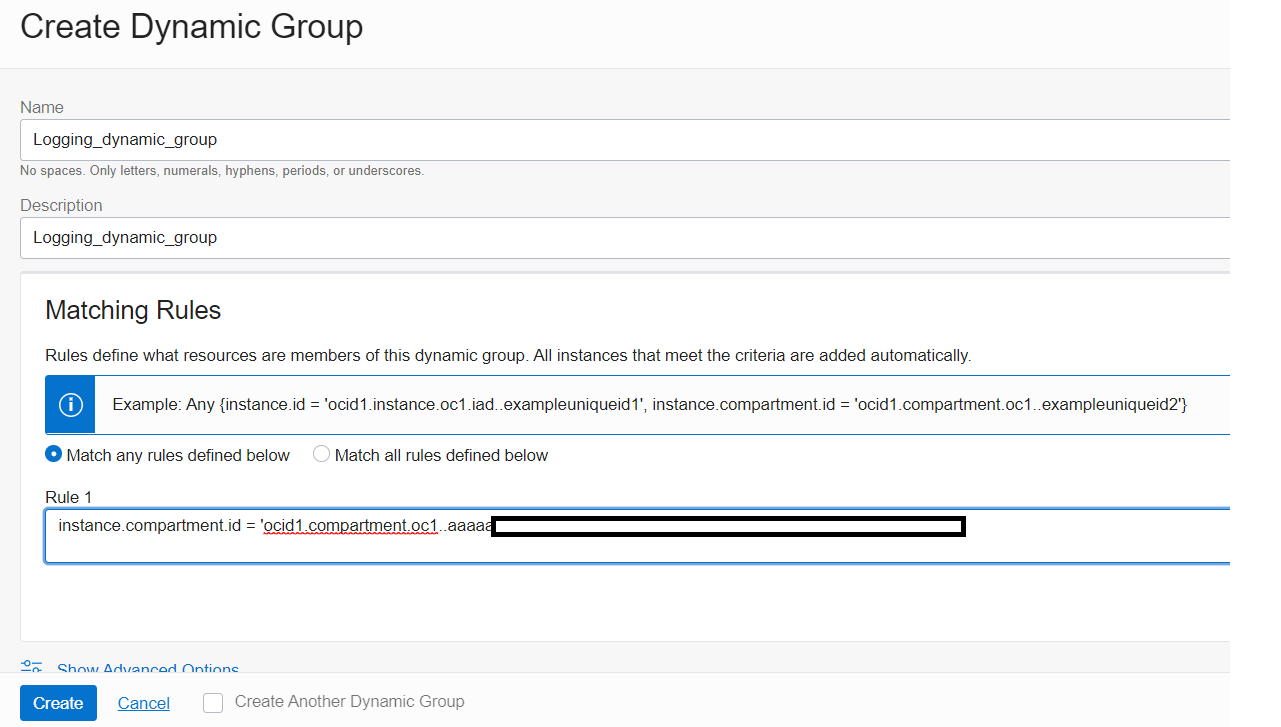
For this example, we will create a rule to include all Virtual Machines within one of the compartments. Fill in and configure as shown and then click the Create button.
The next step is to add policies for this dynamic group to grant Virtual Machines to allow the push of logs so the Logging Service can source them. From the OCI console, using the navigation icon, drop down the menu and select Identity & Security then navigate to the Policies page and then select Compartments on the left to verify what Compartment you have access. Then select Policies from the left, and in the Compartment field, drop down the menu selection and choose the Compartment you have access. Then click the Create Policy button.
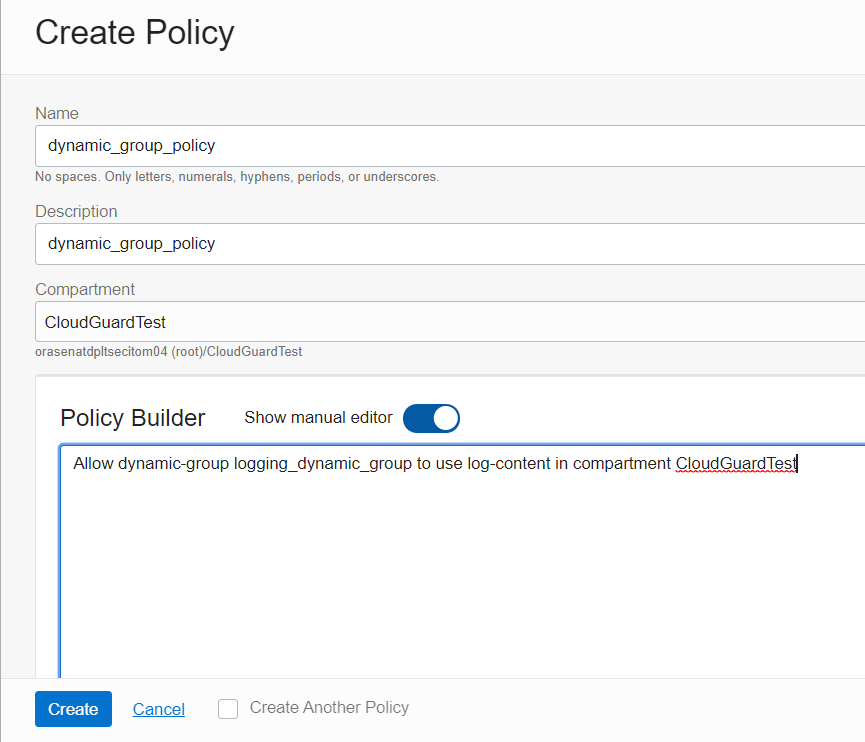
On the Create Policy page fill and configure as shown placing this command into the Policy Builder manual editor box
Allow dynamic-group logging dynamic_group to use log-content in compartment XYZ
Note: Replace XYZ with the compartment name you have access. In this example it was CloudGuardTest
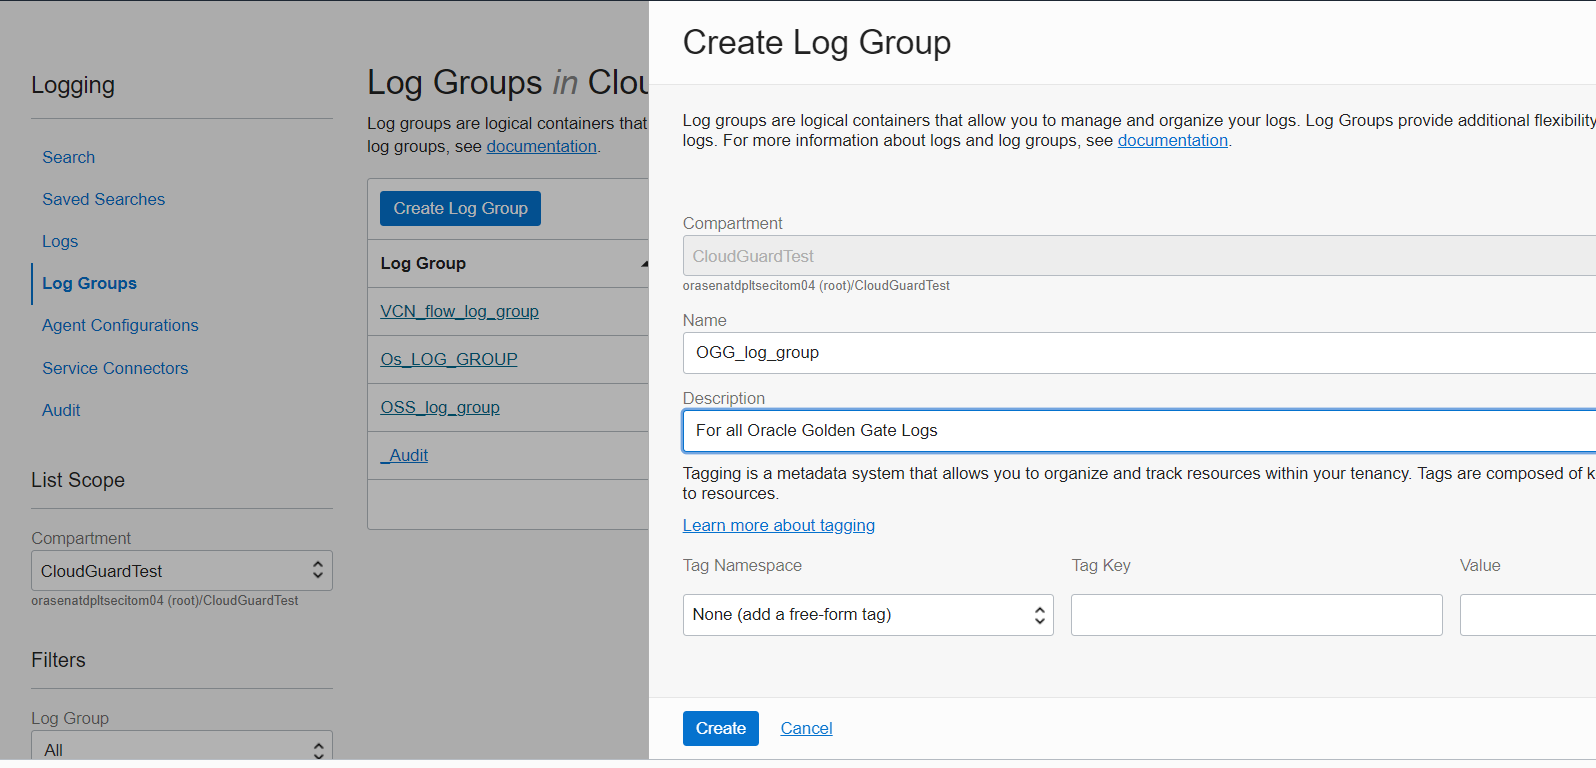
3. Next you need to create a Log Group. Log groups are logical containers that allow you to manage and organize your logs. In the OCI Console, from the navigation icon, drop down the menu and select Observability & Management then under Logging click Log Groups and you will then choose Create Log Group after you first confirm you have chosen a compartment you have permissions to work in. Provide a name and description for your Log Group and click on the Create button to submit.
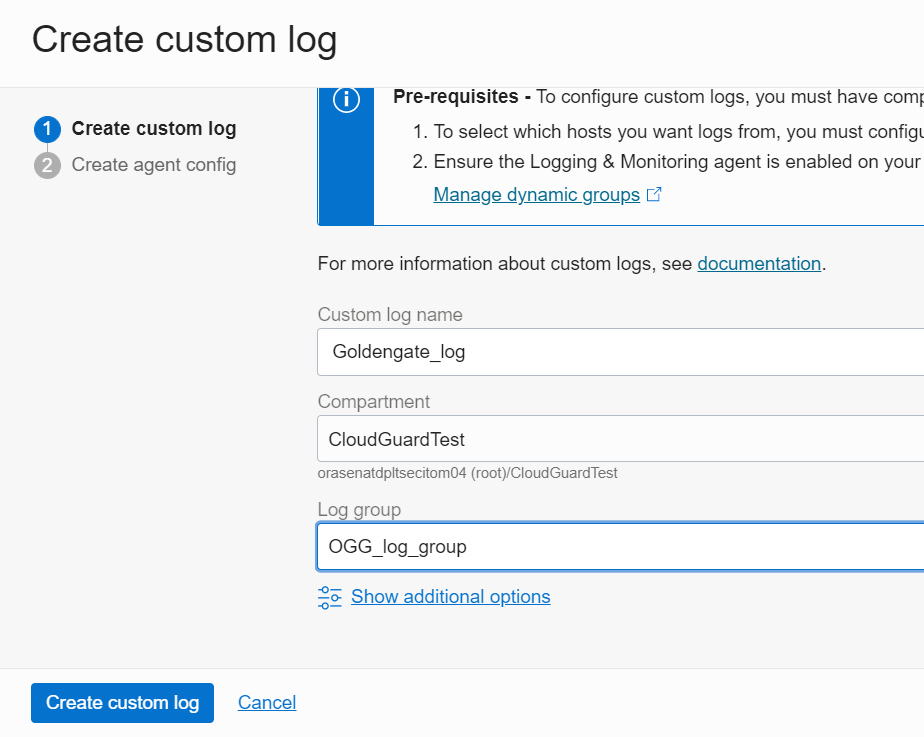
4. From the left side of the Logging page, click on Logs and then click the Create custom log button

On the Create Custom log page, enter a custom log name, verify you have the same compartment and Log Group that you used earlier (figure 6), then click on the Create custom log button.
5. Next is to create the Agent Config. That will allow you to configure what custom logs you want to ingest across your hosts. Agent configuration is a centralized endpoint for all your instances’ agents to connect to. In each agent configuration, you define a set of dynamic groups that can connect and a set of custom logs from your instance for OCI Logging to ingest. You’ll specify which hosts you want to collect logs from, log inputs, and log destination settings.
On the Create custom log, Create agent configuration page you will provide the following details:
- Enter a name in the Configuration field and a description, and select the Compartment you have permissions to work in
- In the Host Groups section, Dynamic group should be selected and under Group you select the dynamic group you created previously (figure 4). Logging_dynamic_group
- For the Input Type select Log Path
- Input Name as goldengateInput (any name you like)
- Set File paths as /home/opc/ogg/ggserr.log (the path where the ogg error logs exist)
- Log Group as “OGG_log_group” (created previously)
- Log name as “Goldengate_log” (created previously)
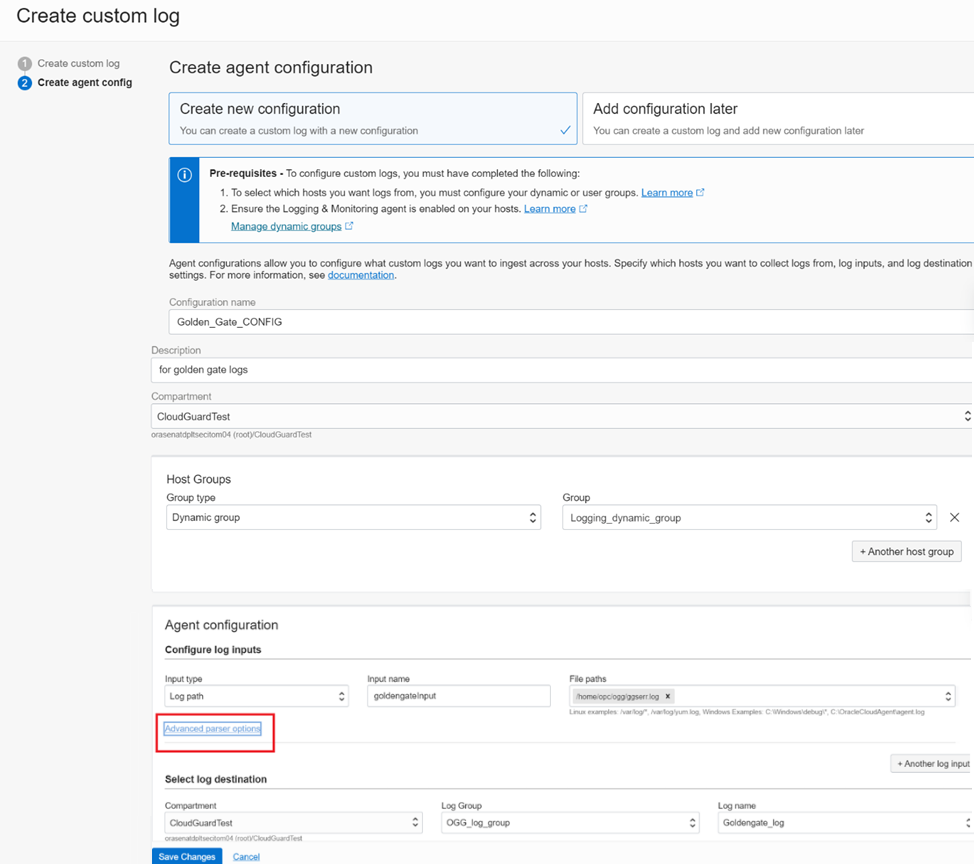
Click on the Advanced parser options link to further add the parser and expression for indexing the GoldenGate error logs to an appropriate format in OCI Logging.
As displayed below, set Parser as
REGEXP
Expression as
/^(?<timestamp>[^ ]*)\s+(?<Severity>[^ ]*)\s+(?<Error ID>[^ ]*)\s+(?<Message>.*)$/
And Time Format as
%Y-%m-%dT%H:%M:%S.%L%z
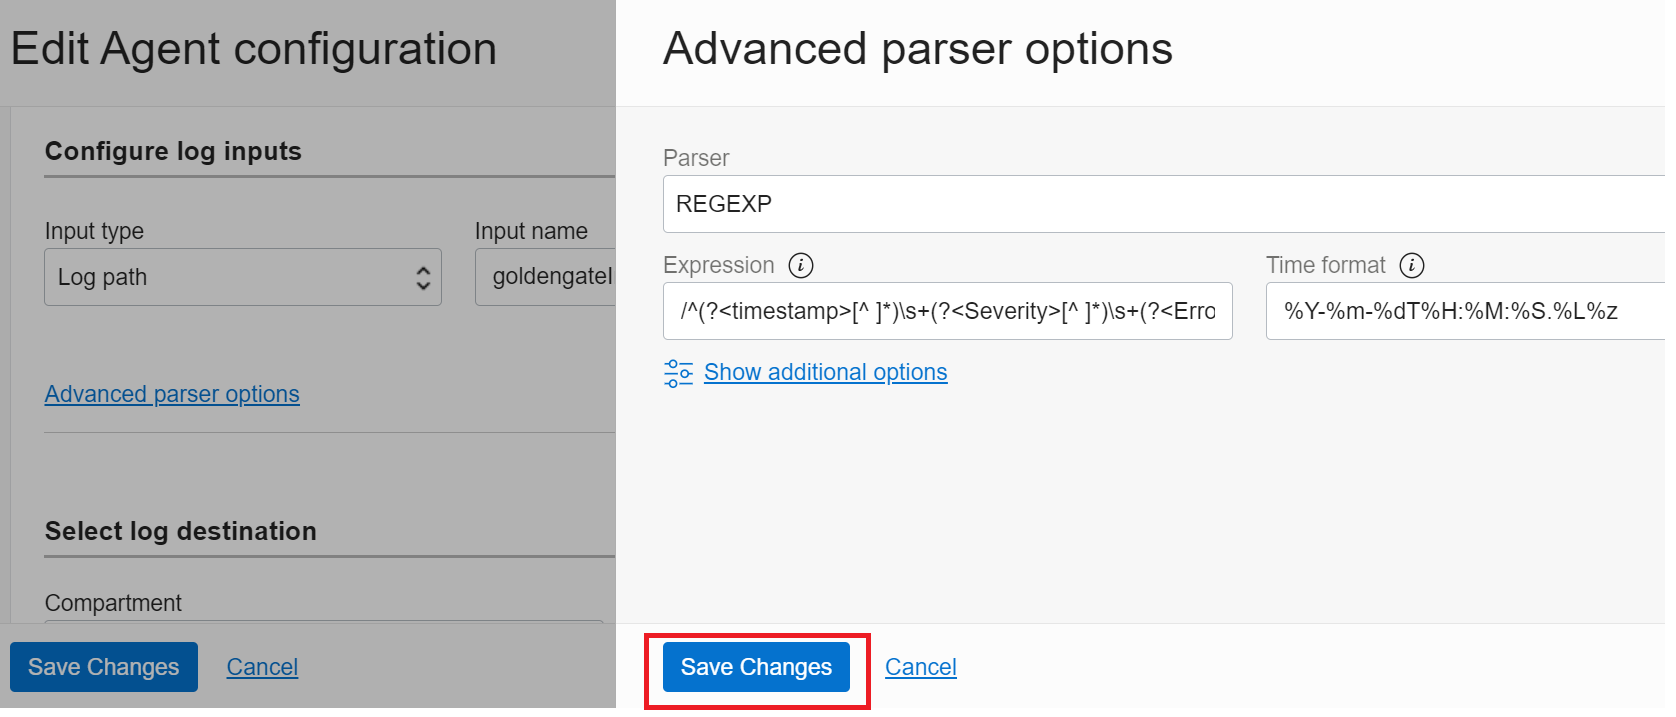
And then click the Save Changes button in the Advanced parser options dialog.
This parser will sort each log entry into 4 fields: timestamp, Severity, Error, and Message.
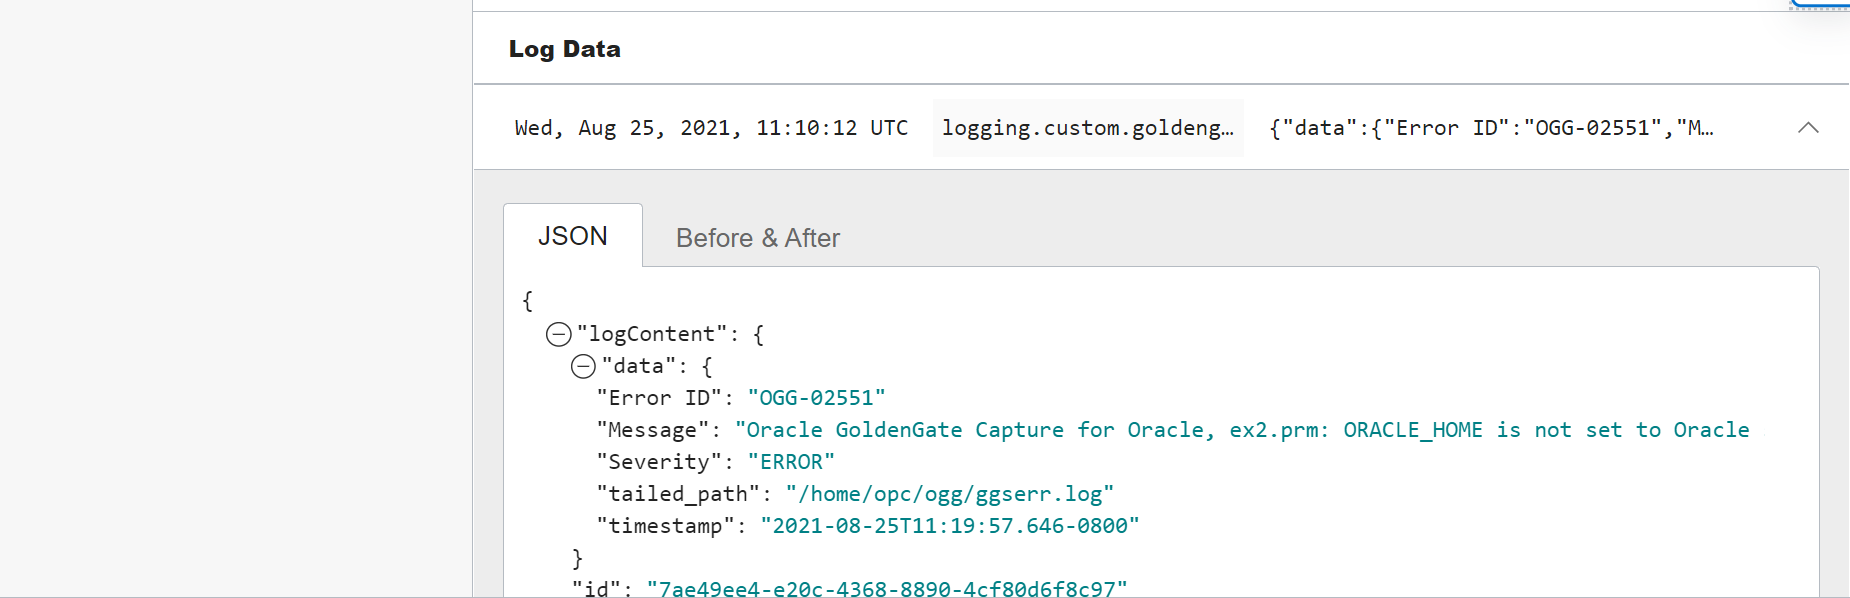
For example: The sample log below will be indexed as
|
|
- Timestamp 2021-06-16T13:50:29.953+0000
- Severity WARNING
- Error ID OGG-02905
- Message Oracle GoldenGate Capture for Oracle, EXT_E.prm: Replication of OID column in object tables may diverge
6. The GoldenGate logs would then be available by navigating to Logging then Logs then to Goldengate_log. You can click on the Explore with Log Search link to see more

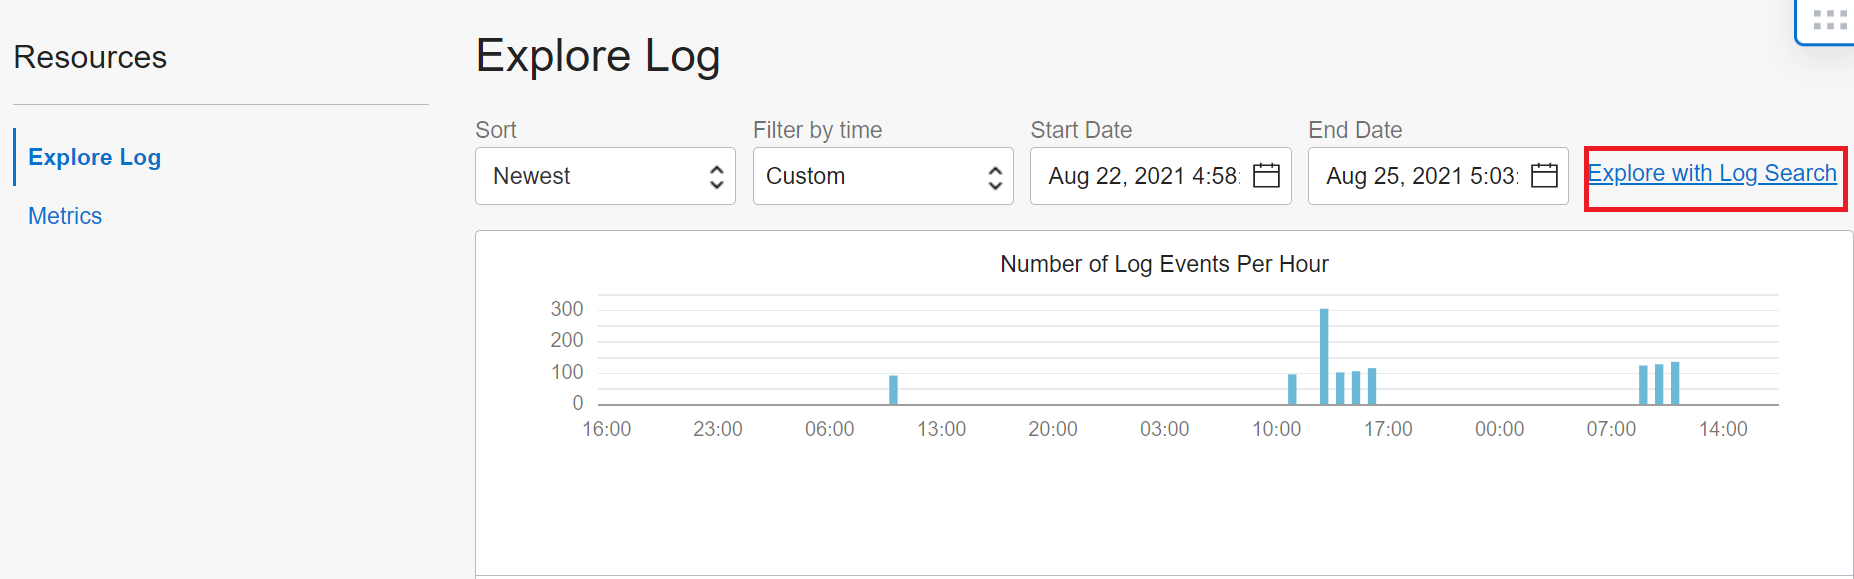
7. Next in the Filters field, add a filter where data.Severity=’ERROR’ to filter for the specific logs that have errors.

8. Before you click the Create Service Connector button, to define how data will move from the source service to a target service, you need to have an OCI Notifications Topic created if you don’t have one already (you may skip If you do).
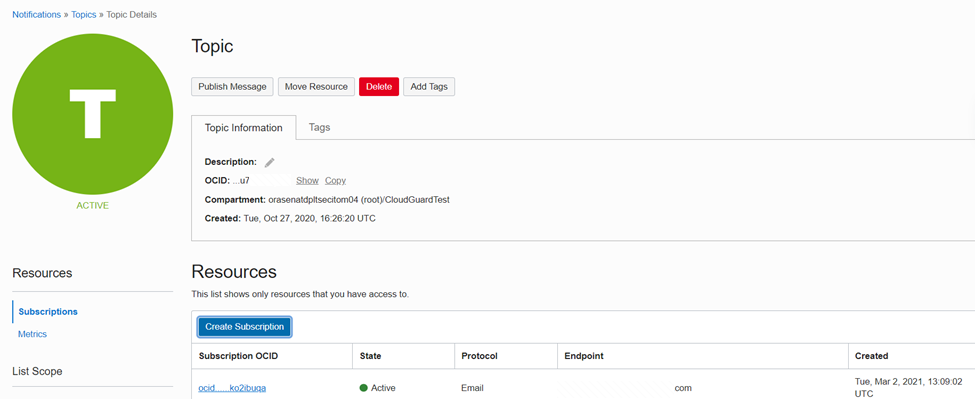
To create a Topic, in the OCI console, using the navigation icon, navigate to Developer Services then Application Integration then Notifications and then Create Topic.
The Notifications service broadcasts messages to distributed components through a publish-subscribe pattern. Use it to be notified when event rules are triggered or alarms are breached, or to directly publish a message. A Topic is a communication channel for sending messages to Subscriptions in the Topic.
On the Topic page you Create a Subscription and define Email as the Protocol and specify an Email address as an Endpoint so OCI Logging can notify the respective email/user when a log with an error is encountered.
9. Now on the Logging service search page, click the Create Service Connector button and then when you get to the Create Service Connector page enter in the fields the following details
- For Connector Name OGG_connector (or any name)
- For Description To notify/alert when there are errors in OGG
- For Source Logging
- Resource Compartment should be the compartment you have privileges to store the new service connector
- For Destination Notifications
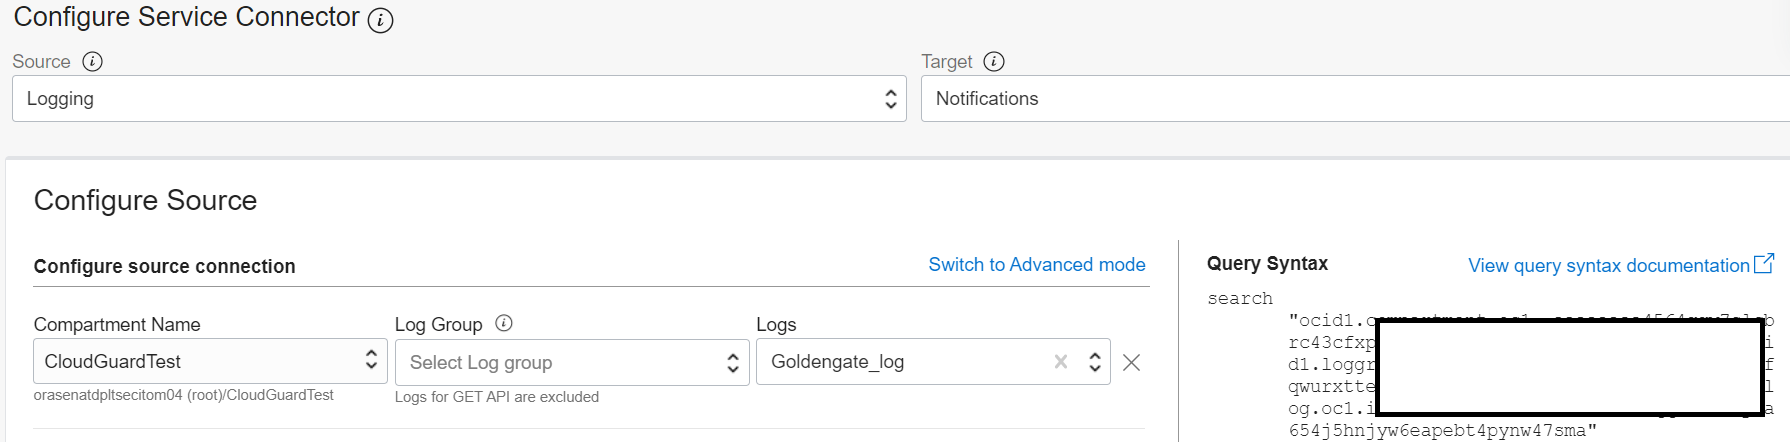
- For Configure Service Connector Source select Logging and for Target select Notifications
- For Configure source connection check to make sure the compartment you have privileges is selected and for Logs select the name of the custom log you created earlier Goldengate_log
- For Log Filter Task use the one you set (see Fig 10) and select the Property data.Severity and Value as ERROR
- And finally for Configure target connection, be sure the compartment you have privileges is selected and for Topic select Topic (the name you had just created or already had)


Once you have filled in the fields, then select the Create button.
10. Now you are able to receive a notification (similar to one below), when an GoldenGate error log is encountered by OCI Log Analytics. Then when there any issues you can take action on obvious items or then perform further analysis on root cause ot troubleshooting. You’ll do that next.

Analyzing GoldenGate Logs in OCI Log Analytics
Oracle Cloud Infrastructure Log Analytics service enables you to index, enrich, aggregate, explore, search, analyze, correlate, visualize and monitor all log data from your applications and system infrastructure.
Next, using native OCI integration OCI Service Connector capabilities, we’ll have data move from OCI Logging into a service like OCI Log Analytics so more advanced operations and analysis can be performed.
1. Create a Log Group in LogAnalytics.
In the Cloud console, from the navigation icon on the upper left, navigate to Menu then Observability & Management then Log Analytics then Administration select Log Groups and select the Create Log Group button.

2. Create a Log Parser of JSON Type.
By creating a parser, you define how to extract log entries from a log file and also how to extract fields from a log entry. From the Cloud console navigation menu, click Observability & Management. Under Log Analytics, click Administration. The Administration Overview page opens. The administration resources are listed in the left hand navigation pane under Resources. Click Parsers. In the Parsers page, click Create.
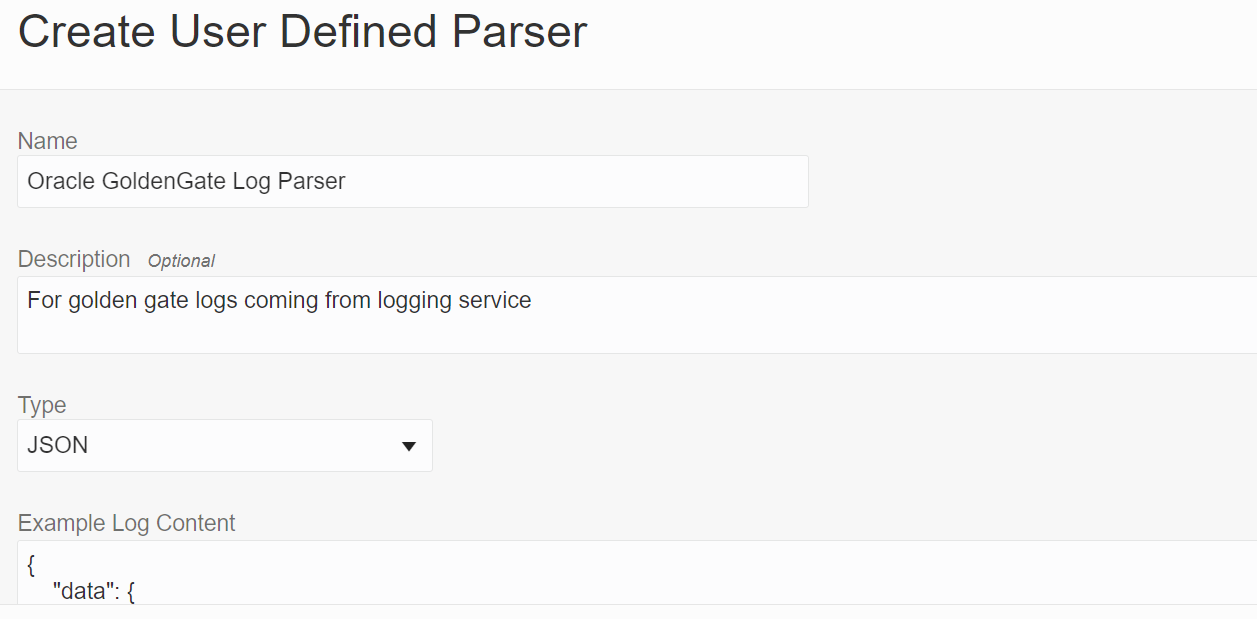
You will be providing the following details in the fields to create a parser.
- Name Oracle GoldenGate Log Parser
- Description For golden gate logs coming from logging service
- Type JSON
-
In the Example Log Content field, paste the contents from a log file that you want to parse, like the following:
|
|

Based on the example log content, the fields are picked and displayed in the Fields tab, like the above example
Field Name Time, Severity, Message, Error ID
After you have validated the information, click the Create Parser button.
3. Next is to create a Source. Log Sources define where the log files are located when you use management agent for collection, and how to parse and enrich the logs while ingesting them, irrespective of the method of ingestion. Oracle Cloud Log Analytics has hundreds of sources for database, applications, and infrastructure of both Oracle origin and non-Oracle origin. If you don’t find an Oracle-defined source that suits your requirement, then you can create your own.
Open the navigation menu and click Observability & Management. Under Log Analytics, click Administration. The Administration Overview page opens. The administration resources are listed in the left hand navigation pane under Resources. Click Sources and click Create Source.
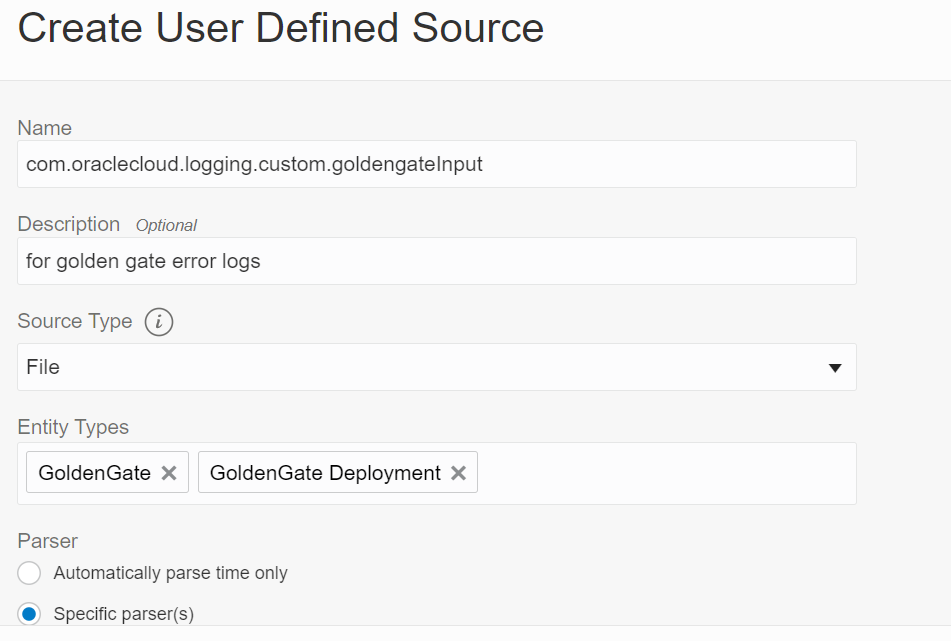
Provide the following details on the page
- Name com.oraclecloud.logging.custom.goldengateInput
- Description for golden gate logs
- Source Type File
- Entity Types GoldenGate, GoldenGate Deployment
- Parser Specific Parser Oracle GoldenGate Log Parser (you created previously)

After the fields have been filled in, click the Create Source button
4. Next you will return to the OCI Logging page and configure a Service Connector so the data can further flow into the Log Analytics service.
Open the navigation menu and click Observability & Management. Under Logging, click Service Connectors and on the page drop down the Compartment menu and select the compartment you have permissions(and used earlier).

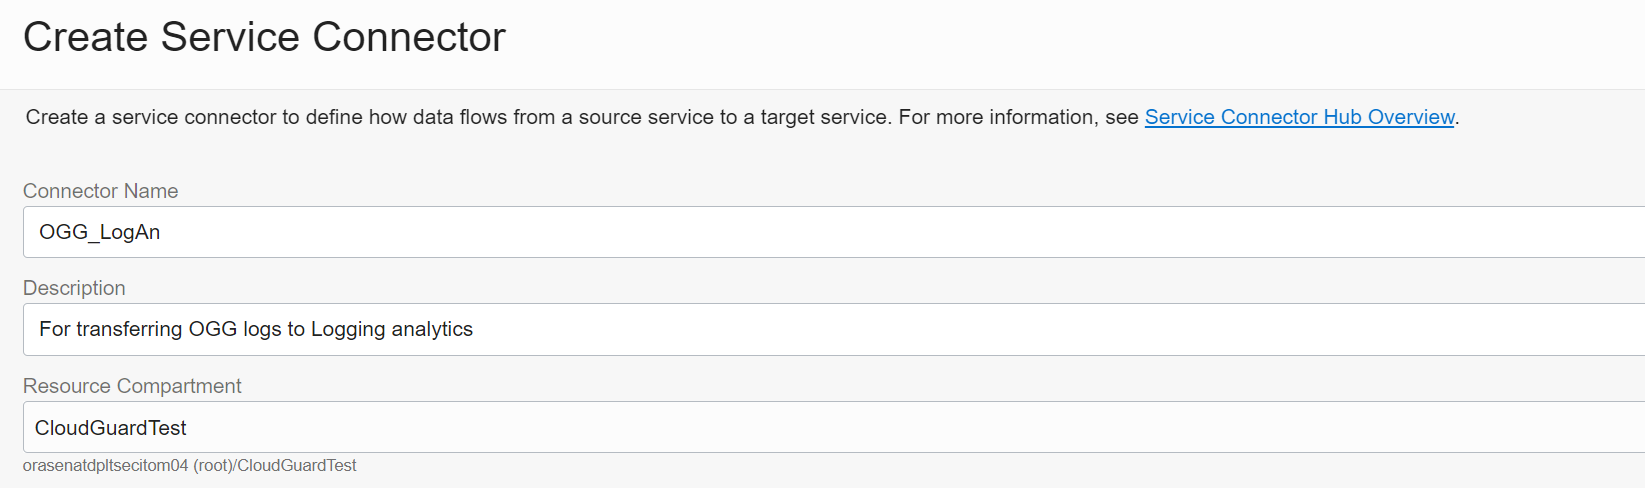
Click the Create Service Connector button and enter the details into the fields on the page (seen below) to create a Service Connector. and click on to create the the default policy and connector.
- Connector Name OGG_LogAn (any name)
- Description For transferring OGG logs to Log analytics
- Resource Compartment – Validate it’s the compartment you have privileges that you used earlier
- Source Logging and for Target Log Analytics
- For Configure Source connection, verify the Compartment Name again and for Log Group OGG_log_group (previously created for logging) and for Logs Goldengate_log (previously created for logging)
- For Configure Target connection specify Log Group OGG_log_group (created earlier in Analyzing GoldenGate logs in OCI Log Analytics Step 1)


Note that when a service connector is configured for Oracle Cloud Log Analytics as the target destination, it is assumed that the service connector hub and Oracle Cloud Log Analytics are available on the same tenant. If not, then you will need to further define a policy to to add the source tenant.
After the fields are filled in on the Create Service Corrector page, click the Create button for it to be created.
5. Once again in the OCI Console, from the navigation icon select Observability & Management then Log Analytics and then Log Explorer.
You can now see the logs flowing from OCI logging to Log Analytics.


With the log data now in OCI Log Analytics, you can use the pre-defined dashboards or create your own to analyze logs, pinpoint the cause of an issue and uncover issues that were buried in log data.

Now that you have been introduced to Log Analytics, and being there are far more capabilities and examples we don’t have time or space to cover in this blog, view the video series to learn more details on how it can be used to help solve complex application, database and system issues and more.
Resources